Your browser does not fully support modern features. Please upgrade for a smoother experience.
Please note this is a comparison between Version 1 by Eurico Madureira and Version 2 by Catherine Yang.
Respirable Coal Mine Dust (RCMD), with a specific focus on examining particle deposition across different regions of the airway system and lungs. The interplay of several critical factors, including particle characteristics and an individual’s breathing patterns, plays a pivotal role in determining whether particles settle in the lungs or are exhaled.
- respirable coal mine dust
- lung deposition
- coal dust
- dust exposure
- respiratory diseases
1. RCMD Inhalation and Lung Deposition
The journey of inhaled dust particles through the respiratory system is crucial to understanding RCMD inhalation and lung deposition. Beginning at the nostrils or mouth, dust particles enter the respiratory airways, encountering various clearance mechanisms. These mechanisms are found in distinct areas of the respiratory system. The nasal cavity (nasopharynx, larynx, and trachea) contains small hairs and mucus that filter out the largest particles (10 to 6 µm). Moving down the respiratory tract, the tracheobronchial (TB) tree (trachea, bronchi, and smaller bronchioles) is equipped with ciliated columnar and goblet cells, which trap particles in the size range of 6 to 3 µm. Finally, in the alveoli region (smaller bronchiole balloons), alveoli macrophage cells play a pivotal role. Upon contact with dust or harmful particles, the macrophage cells engulf and transport particles to the TB region, where expulsion from the respiratory system occurs through coughing or swallowing [1][2][11,12]. Lung fluid in this region aids in respiratory processes by moisturizing inhaled air and enhancing macrophage function [3][13].
Furthermore, research indicates that these clearance mechanisms, particularly in the alveoli region, can be impaired by prolonged dust exposure and macrophage overload. The retention or accumulation of particles in the lungs depends on the rate of dust particle deposition within the lungs and the efficiency of macrophage clearance. The duration of dust particle exposure directly affects the rate and quantity of particle deposition in the lungs. An increase in unidentified particle deposition in the alveoli prompts the recruitment of additional macrophages to enhance the clearance process, emphasizing the importance of understanding these mechanisms for assessing RCMD inhalation and lung deposition in mining environments [4][5][14,15].
1.1. Factors Influencing Deposition
Particle physicochemical characteristics (e.g., size, shape, charge), airway physiological parameters (e.g., breathing patterns), and airway geometry collectively influence the deposition of inhaled dust particles [6][7][8][9,16,17].
-
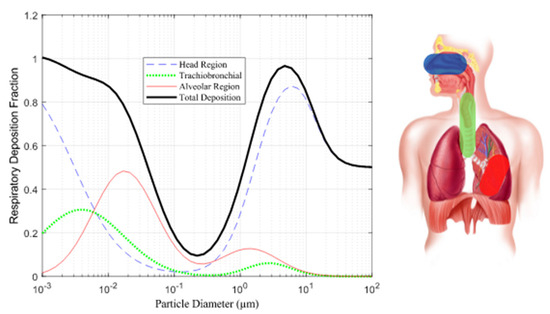
Particle Size: Particle size plays a pivotal role in determining where particles deposit in the respiratory system. Particles in the respirable range (10 nm to 10 µm) tend to deposit differently in three distinct regions: the head, TB, and alveoli regions. Smaller particles (<3 µm) and nano-sized particles (<300 nm) have a higher likelihood of depositing in the alveoli region as Illustrated in Figure 1 [9][18].
1.2. Deposition Mechanisms
Several mechanisms govern dust particle deposition, including inertial impaction, gravitational sedimentation, Brownian diffusion, interception, and turbulent diffusion [6][7][9,16].
This rpapesearchr focuses on the main mechanisms based on particle size:
-
Inertial Impaction: Particles travel at a speed that may cause them to collide with airway surfaces due to changes in airflow direction. Particle size, charge, airflow, and airway geometry influence impaction, particularly in the early respiratory system, where larger particles travel.
-
Gravitational Sedimentation: Particles gradually settle over time due to gravity, influenced by breath maneuvers, particle aerodynamic diameter, and density. Holding one’s breath increases the likelihood of sedimentation, with heavier particles settling faster.
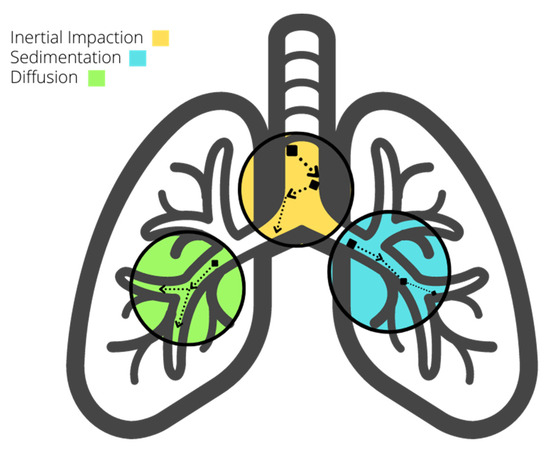
Figure 2.
Deposition mechanisms in the respiratory system.
Comprehending these factors and mechanisms in conjunction with fluid dynamics enables us to discern the advantages of particle fragmentation into larger sizes, as such particles possess a greater likelihood of early settlement and extraction from the respiratory system, with the converse being true. In scenarios where fine fragmentation prevails, it necessitates the implementation of comprehensive protective measures.
2. RCMD Sources and Exposure in Coal Mines
Dust sources in mining activities stem from rock-related processes such as blasting, cutting, transportation, and rock dusting [17][35]. Underground coal miners face greater risks compared to surface and metal mine workers due to higher dust concentrations in confined underground environments [18][36]. About 3% of airborne mine dust originates from excavations [19][37]. From normal operation to wear and tear, mining machinery emits harmful particles with varying chemical compositions [20][29]. These particles can linger in the air and enter the deepest parts of the human lung or be removed by the body’s clearance mechanisms [21][38]. Approximately 1.7 million U.S. workers, spanning both mining and non-mining sectors, face potential exposure to hazardous dust containing crystalline silica on an annual basis [22][39]. Research indicates that miners may develop chronic simple silicosis after roughly 20 years of exposure, with some enduring exposure periods as long as 44 years [23][24][7,40]. Occupations characterized by high levels of risk encompass roles such as drill operators, roof bolters, and machine operators, among others. Conversely, positions like belt operators and shovel operators entail lower risks [25][26][41,42]. Notably, roof bolting alone can account for up to 50% of quartz particles in dust, with 20% falling within the respirable size range (<10 µm) [27][28][43,44]. Workers situated in intake and exhaust areas face heightened risks of inhaling fine particles compared to those stationed at the working face [29][45]. Nevertheless, a discernible distinction that provides enhanced protection to individuals in high-risk positions is currently lacking. Methods for detecting coal and silica dust concentrations in mining operations encompass time-consuming laboratory techniques such as X-ray Diffraction (XRD) and Scanning Electron Microscopy with Energy Disperse X-ray (SEM-EDX). Meanwhile, field-portable devices such as the Fourier-Transform Infrared (FTIR) and Continuous Personal Dust Monitoring (CPDM) furnish essential data without necessitating laboratory assistance. In the context of both surface and underground coal mines, the responsibility for enforcing permissible exposure limits concerning coal dust and silica predominantly falls upon the mining operator, aided by contemporary monitoring devices such as the CPDM. This instrument yields estimations of dust concentrations at the conclusion of each work shift. Regrettably, it exhibits certain limitations, including bulkiness, noise emissions, and an inability to measure silica concentration [22][30][31][26,39,46]. This approach has demonstrated a relative inefficiency in enabling mine operators to make real-time decisions, as opposed to relying solely on end-of-shift data, while also incurring additional fatigue for the mine operator. Consequently, there is a discernible demand for more advanced equipment capable of enhancing precision. Notably, the aforementioned limitations of the CPDM have prompted research into alternative, more convenient solutions [32][33][47,48]. Continued inhalation of coal dust over time impairs respiratory tract clearance mechanisms, reducing their ability to expel particles and causing lung tissue lesions [34][35][28,49]. The International Labor Organization (ILO) classifies opacity caused by coal and silica dust inhalation into four categories (0, 1, 2, and 3) with twelve subcategories (0/1, 1/0, 1/1, etc.) [36][50]. Progression of pulmonary opacity is linked to higher exposure to silica dust, particularly in the mining of thin coal seams, where more host rock must be moved [23][37][7,51]. Opacity 1/0+ often advances more rapidly with exposure to quartz dust. Additionally, higher radiologic profusions are associated with ash content in low-rank coal and are influenced by both coal dust and ash content in high-rank coal [12][21].3. RCMD Characterization Techniques
RCMD is typically characterized by mass concentration and mass fraction, but factors such as shape, size, and particle composition also influence its hazard potential [15][24]. SEM-EDX, a commonly employed laboratory technique for dust sample characterization, involves the examination of dust particle surfaces through X-ray spectra generated by the interaction between an electron beam and the particle’s surface. However, it is worth noting that, on certain occasions, there is a potential for underestimating coal particles, which may lead to an unnoticed increase in exposure to coal dust due to the mischaracterization of RCMD [38][52]. In a study analyzing samples collected from a low-seam mine in central Appalachia (collected at the roof bolter, belt drive, and intake location), the results indicated that particles in the roof bolter and belt drive samples were primarily composed of alumino-silicate, with a presence of carbonaceous content in the roof bolter samples. These particles can be associated with coal mineral micro-agglomerates, which, despite being coal, may not always be classified as such by SEM-EDX. This observation becomes evident when comparing SEM-EDX results with Thermographic Analysis (TGA) results, which often reveal reduced coal values and increased rock dust content. This discrepancy may occur when coal particles are coated with rock dust or Diesel Particulate Matter (DPM) [1][37][11,51].4. Computational Fluid Dynamics in Investigating Particle Deposition
In the realm of computational fluid dynamics, numerous attempts have been made to simplify the intricate human respiratory system. These efforts involve focusing on specific respiratory system components or streamlining geometric representations. This section delves into various initiatives within this field. Within this compiled dataset of references, spanning from 2010 to 2022, a total of 54 references were analyzed for the CFD section. Over the years, the distribution of references has been diverse, with the highest percentage (26.23%) found in 2021. The remaining years each have a percentage of references ranging from 3.28% to 9.84%, illustrating the sustained research interest in this field throughout the past decade. The following bar Chart 1 visually represents the variation in publication years and their corresponding percentages used in the article.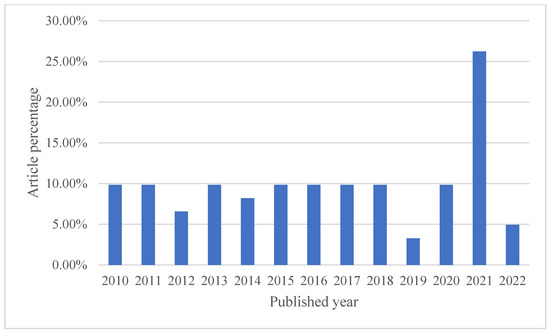
Chart 1.
Articles distribution in the CFD section.
4.1. Model Geometry
The computational analysis of the complex geometry of the human lung presents considerable challenges and demands a substantial investment of time. Consequently, research in this field frequently employs varying degrees of simplification, influenced by the specific research objectives. Basic Models: Some studies employ rudimentary models to explore the transport and deposition of microparticles and nanoparticles (1–50 nm) within the bronchial tree during inhalation [39][53]. Enhanced Models: In contrast, more sophisticated models, exemplified in Figure 34, are evident in various studies. These models incorporate additional airway generations and offer a more comprehensive representation of lung dynamics [40][41][42][43][54,55,56,57].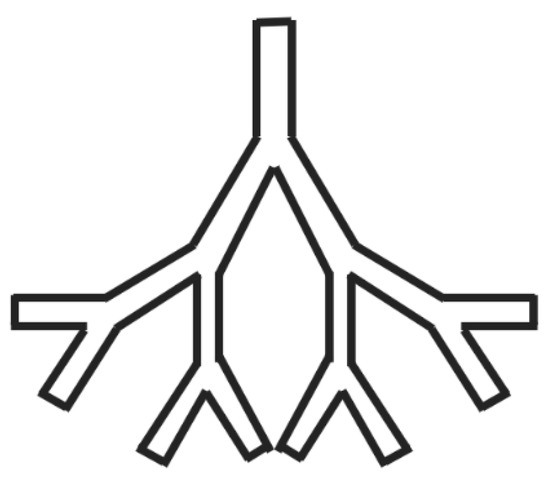
Figure 34.
Schematics of an enhanced airway model.
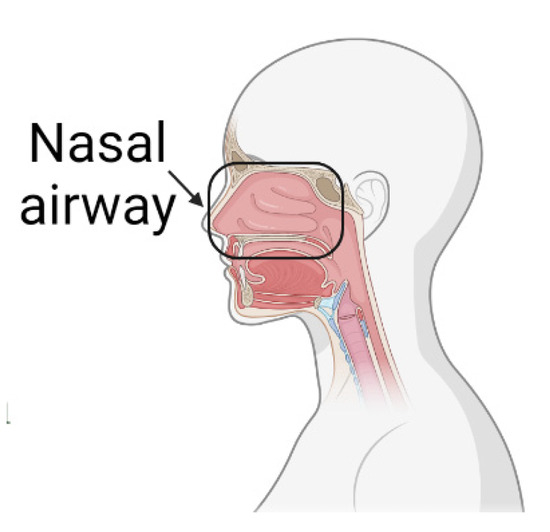
Figure 45.
Nasal airway section under investigation.
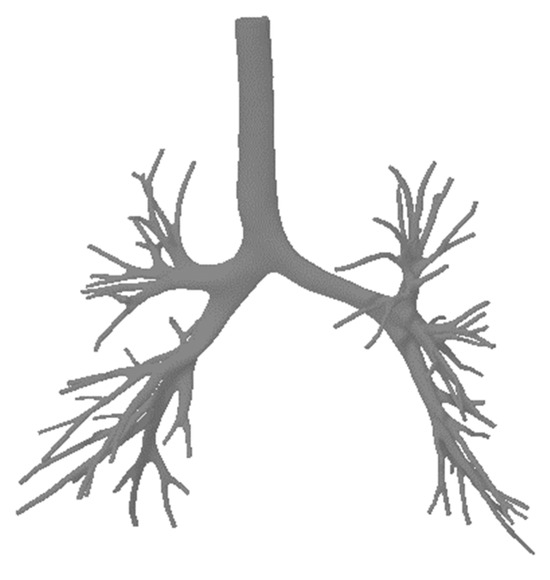
Figure 67.
A realistic lung model.