Your browser does not fully support modern features. Please upgrade for a smoother experience.
Please note this is a comparison between Version 2 by Jessie Wu and Version 1 by Fatmah Abdulaziz Alsaidi.
Flat foot is a postural deformity in which the plantar part of the foot is either completely or partially contacted with the ground. In recent clinical practices, X-ray radiographs have been introduced to detect flat feet because they are more affordable to many clinics than using specialized devices.
- flat foot
- template matching
- Convolutional Neural Network
- Random Forest
- VGG-16
1. Background
Flat foot (Pes Planus) is a common foot deformity in which the arch of the foot is depressed and the plantar part of the foot is either completely or partially contacted with the ground [1]. Mostly, flat feet can affect the natural gait and usually require therapy to resolve; in severe cases where the pain grows to be unbearable, surgical intervention is required [2,3,4][2][3][4]. According to the same sources, the severity levels of flat feet can be classified into three levels: mild, moderate, and severe (rigid).
Recently, measuring foot angles from X-ray images has become a preferable scheme for flat foot assessments as it is more affordable to many clinics than using specialized devices [5,6][5][6]. During imaging the foot, it is crucial for the foot to be in a weight-bearing state during the imaging, that is, when the foot is bearing the body weight, so the foot angles can be correctly measured [7].
When assessing flat feet from X-ray images, several Points of Interest (PoIs) should be hypothetically allocated and connected to form different foot angles. These angles are then measured and compared at certain intervals to precisely estimate the flatness of the foot as well as its severity level. According to the literature, there are many different foot angles that can be used in diagnosing flat feet; some of these angles can be measured from a certain view, such as a lateral X-ray view where the smallest toe is clearly visible [8,9,10][8][9][10]. Three of the most commonly used foot angles in adult flat foot assessment are: Calcaneal Inclination Angle (i.e., Calcaneal Pitch), Arch Angle (i.e., foot arch), and Meary’s Angle (i.e., Talus-First Metatarsal Angle), as shown in Figure 1 [11,12,13,14,15][11][12][13][14][15]. The figure shows nine PoIs allocated (white dots). The angles formed by connecting these points are: (A) the Calcaneal Inclination Angle (CIA), which measures the tilting degree of the Calcaneus bone, aka the heel (in red), using the Sesamoid bone as its base (in blue); (B) the Arch Angle (AA), which measures the tilting degree of the fifth Metatarsal, aka the smallest toe (in yellow); and (C) Meary’s Angle (MA), which measures the tilting of both the Talus (in purple) and the first Metatarsal bones (in green).
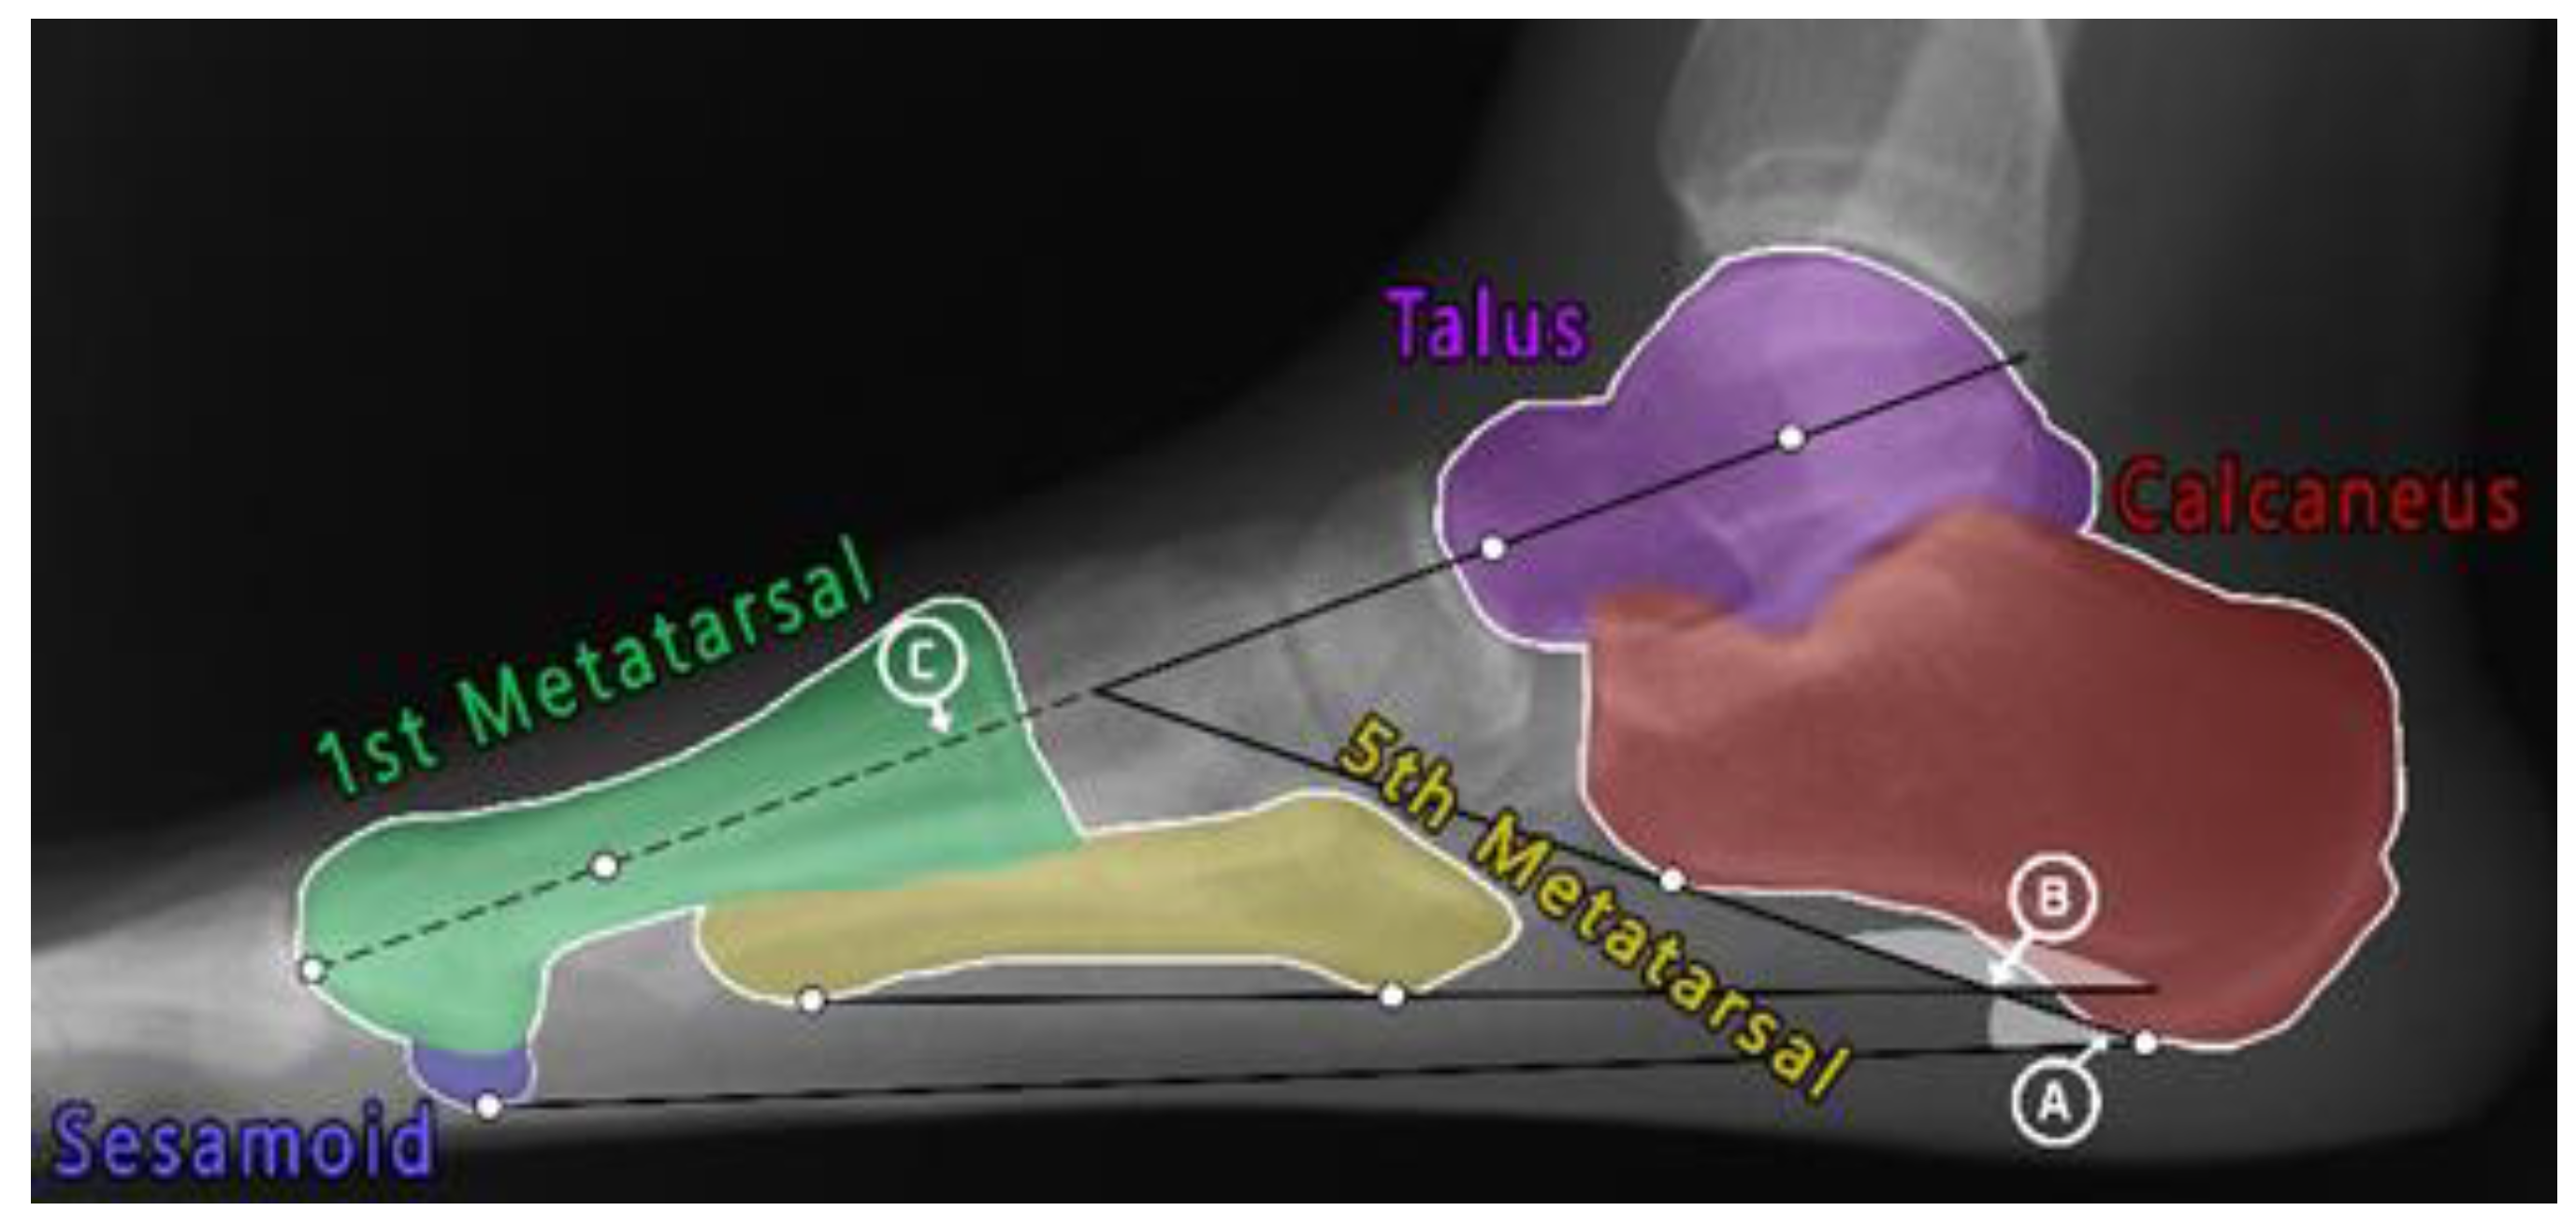
Figure 1. A total of nine PoIs (white dots) and three foot angles: (A) Calcaneal Inclination Angle, (B) Arche Angle, and (C) Meary’s Angle. The figure also shows five bones of interest: Talus (purple), Calcaneus (red), first Metatarsal (green), fifth Metatarsal (yellow), and Sesamoid (blue).
These resulting angles are then measured and compared to angle intervals to estimate the flatness of the foot as well as how severe the flatness is (either mild or moderate). Table 1 shows the angle intervals for each of the three aforementioned angles. For the CIA, several sources [16,17,18,19,20,21][16][17][18][19][20][21] agreed that if the angle a was between 20 and 30 degrees, then it was considered a normal foot. Other sources agreed that [16,18,20][16][18][20] if the angle was in the range of 10 to 20 degrees, then it shows a sign of a mild flat foot. Lastly, if the angle was lower than 10 degrees [16], then it is a moderate case of flat foot. When using the AA, any angle that falls between 150 and 165 is a normal foot, while an angle larger than that but smaller than 180 degrees is a mild flat foot. A moderately flat foot has an angle larger than 180 degrees, as stated by [16]. According to the sources [20,22][20][22], if the MA was between 0 and 4 degrees, then the foot is normal; if the angle was larger than 4 and smaller than 15, then it is a flat foot case; and lastly, if the angle was larger than mentioned, then it is a moderately flat foot.
Table 1.
Foot angle interval measurements in degrees.
| Angle | Normal Range | Mild Flat Foot | Moderate Flat Foot |
|---|---|---|---|
| CIA | 20 ≤ a ≤ 30 | 10 ≤ a < 20 | 10 > a |
| AA | 150 ≤ a ≤ 165 | 170 < a < 180 | 180 ≤ a |
| MA | 0 < a < 4 | 4 ≤ a ≤ 14 | 15 ≥ a |
Notes: foot angles: CIA: Calcaneal Inclination, AA: Arch, MA: Meary’s Angle, a: measured foot angle.
2. Allocating PoIs
According to the literature, allocating PoIs can be grouped into traditional image analysis approaches and machine learning-based approaches. Mainly, using the traditional image analysis technique involves defining bone edges and then implementing different mathematical equations to search along the bone edges for the PoI location. The system proposed by Jian et al. [23] measures foot Arch Angle to detect flat feet from lateral X-ray images. The method started with outlining the foot edges of each image using Canny Edge detection, and the noise was reduced by Gaussian blur filters. The image is then divided into four regions based on the percentage of each foot. Within each region, the bone edges are searched for a PoI using different novel mathematical algorithms. The PoIs are then connected, and the foot Arch Angle is measured for a final diagnosis. The proposed method requires direct human supervision to prevent misallocating the PoIs; therefore, the method provides manual adjustment for re-locating the PoIs. The authors performed statistical analysis rather than measuring performance using common performance metrics (such as accuracy, precision, recall, etc.). Yang et al. [24] used Mutual Information (MI) to register the bones of interest (Calcaneal bone and fifth metatarsal bone) for measuring the Arch Angle. MI is used to measure similarities between a template image and a reference image; the higher MI values indicate that both images are correctly aligned. In the method, the template images were created by selecting a representative image of the bones of interest and rotating it to be aligned horizontally against the surface. To measure the angles, the template bones are repeatedly rotated, and the MI is calculated until maximized. The amount of rotation made indicates the AA value, and then the angle defines a flat foot from a normal foot. The accuracy rate was calculated as the hit ratio, achieving 96% accuracy. Kao et al. [25] proposed a method to detect flat feet by measuring Arch Angle. The authors used Projection Profile, which is used to find the total sums of white pixels along each axis, to segment the images into two RoIs consisting of the bones of interest (the Calcaneal and fifth Metatarsal bones). The lower edges of each region were searched for two pixels of minimum spatial location; these PoIs were then connected, and the Arche Angle was measured to determine flat foot. As a result, the method was able to correctly detect 73.33% of the total cases. The authors suggested that measuring additional foot angles besides the Arch Angle would increase the overall accuracy. These traditional image analysis approaches are still in use in many medical imaging-oriented systems. However, from the reviewed results, such approaches may encounter difficulties when the new image differs from the tested ones; therefore, several restricted image enhancements are required to match the original image. Furthermore, these works did not provide a comprehensive comparison with state-of-the-art techniques, nor did they provide detailed results of their work for future comparison. In the proposed work, the new images would require slight image enhancements (such as brightness and contrast) only when needed.
Machine learning-based approaches consider generalization of the models to adapt new input images that may slightly differ from the trained dataset; additionally, it saves time and effort as well as providing consistent results. The work proposed by [26] deployed Extremely Randomized Forests to detect flat feet by measuring each of the Calcaneal Inclination Angle, Meary’s Angle, and Talar Declination Angle. The input images were searched in a pixel-by-pixel manner for PoIs using 40 Extremely Randomized Trees. In feature extraction, the model searched the images for candidate pixels as PoIs. The voting system was performed twice: once during down-sampling pixels and again after the original resolution was retrieved. The final PoIs were allocated by finding the mean position of candidate points. In classification, the trees are weighted based on the probability of each pixel being a PoI. These probabilities are estimated by the pixel’s spatial position plus its vicinity, including the three-pixel radius around this pixel. The closer the pixel to the PoI position, the higher its probability. To speed up the searching process, each image was divided into four subimages to be searched in parallel. In the proposed work, instead of searching the image using the pixel-by-pixel method, Template Matching is used to quickly identify the potential locations of PoIs, and then the classifier will decide the exact location of the points.
Nitris et al. [27] exploited a transfer learning scheme to overcome the problem of the limited dataset they have. The authors used the ResNet50 model, which was pre-trained on the ImageNet dataset, as the feature extractor for their dataset, and then they added a novel fully Convolutional Neural Network with Adam optimization. The classifier segments the images into three non-overlapping regions, where each region has one PoI located at the exact center of the box. As a result, the average of the differences between manual angular measurements and angles measured by their work was 1.27 degrees. Inspired by the work by [27], in the proposed work, VGG-16 (which was also pre-trained on the ImageNet dataset) is used as a feature extractor only to overcome the problem of a limited dataset. After that, a different classifier determines the exact location of PoIs using these feature vectors.
The latest attempt was proposed by Lauder et al. [28]. Their work provided an experimental set-up for two models: (1) Random Forest regression-voting Constrained Local Models [29], and (2) Spatial Configuration-Net [30]. The experiment’s aim was to detect flat feet from X-ray images and classify them into mild, moderate, and severe cases. The detection is based on allocating 61 PoIs that are used to measure the Calcaneal Inclination Angle, Meary’s Angle, and Cuboid Height. The first model extracts the feature values of each pixel and feeds them to the regressor to determine the most likely position of this pixel. Each tree in the forest was trained independently and voted based on given information from neighboring pixels. Furthermore, all votes are accumulated to predict the position of each pixel, creating a 2D histogram of votes. The second model defines the PoI location based on other PoI locations; it uses a network architecture that predicts each PoI using a combination of its local appearance plus the special configurations of the rest of the PoIs. The output is heatmap regression for each of the 61 PoIs instead of absolute coordinates. The smallest point-to-point error was 2.2 mm achieved by the first model. This woreseark ch was the only attempt that combined several foot angles for detecting flat feet; however, the authors did not clarify whether there were disagreements between the forementioned angles or not.
As a summary, the problem of automatically detecting flat feet from X-ray images has attracted the interest of the researchers. Driven by the related works, the detection process mainly consists of two main steps: first, a set of PoIs must be allocated and then connected to form a foot angle. Second, this angle is measured and compared to the angle intervals to determine the flatness of the foot. The two most widely used models for allocating PoIs were the Convolutional Neural Network (CNN) and Random Forest (regression). However, a large-scale dataset is required for training these models from scratch. The traditional image analysis approaches that used mathematical equations rather than machine learning approaches did not require large collections of datasets, although they were time-consuming and required several restricted image enhancements before implementing the methods. The work proposed in [27] used transfer learning as a solution for a limited dataset size and proved to achieve satisfying results.
According to the resource [31], manually allocating the PoIs and measuring the resulting foot angles could greatly consume effort and time. Moreover, it is prone to error since the judgment of each practitioner may differ, leading to a final misdiagnosis. Moreover, according to the literature, there was no research that detected flat feet and found their severity levels using a combination of foot angles instead of relying on only a single angle.
For these reasons, the purpose of this woreseark ch is to assist doctors and practitioners in automatically detecting flat foot deformity from X-ray images by allocating the set of PoIs and finding their coordinates on the image using a classifier. Using these coordinates, the points are connected, and the angle is formed. This process is repeated to form three different foot angles: CIA, AA, and MA, using a total of nine allocated PoIs. The final diagnosis (and the severity level if it was a flat foot) is determined by a combination of these angles votes; whenever an angle results in a different diagnosis than the others, the diagnosis with the highest vote is selected.
References
- Trbalić, A.Š.; Osmić, J.; Mehinović, N.; Junuzović, N. Comparative Analysis of Methodologies for Flat Foot Parameter Determination. J. Mechatron. Autom. Identif. Technol. 2021, 6, 11–16.
- Ueki, Y.; Sakuma, E.; Wada, I. Pathology and management of flexible flat foot in children. J. Orthop. Sci. 2019, 24, 9–13.
- Jackson, J.B., III; Pacana, M.J.; Gonzalez, T.A. Adult acquired flatfoot deformity. JAAOS J. Am. Acad. Orthop. Surg. 2022, 30, e6–e16.
- Kim, M.H.; Cha, S.; Choi, J.E.; Jeon, M.; Choi, J.Y.; Yang, S.-S. Relation of Flatfoot Severity with Flexibility and Isometric Strength of the Foot and Trunk Extensors in Children. Children 2022, 10, 19.
- Abousayed, M.M.; Alley, M.C.; Shakked, R.; Rosenbaum, A.J. Adult-acquired flatfoot deformity: Etiology, diagnosis, and management. JBJS Rev. 2017, 5, e7.
- Flores, D.V.; Mejía Gómez, C.; Fernández Hernando, M.; Davis, M.A.; Pathria, M.N. Adult acquired flatfoot deformity: Anatomy, biomechanics, staging, and imaging findings. Radiographics 2019, 39, 1437–1460.
- Polichetti, C.; Borruto, M.I.; Lauriero, F.; Caravelli, S.; Mosca, M.; Maccauro, G.; Greco, T.; Perisano, C. Adult Acquired Flatfoot Deformity: A Narrative Review about Imaging Findings. Diagnostics 2023, 13, 225.
- Weissman, B.N.W. Imaging of Arthritis and Metabolic Bone Disease; Elsevier Health Sciences: Amsterdam, The Netherlands, 2009.
- Burrow, J.G.; Rome, K.; Padhiar, N. Neale’s Disorders of the Foot and Ankle E-Book; Elsevier Health Sciences: Amsterdam, The Netherlands, 2020.
- Porter, D.A.; Schon, L.C. Baxter’s the Foot and Ankle in Sport; Elsevier Health Sciences: Amsterdam, The Netherlands, 2020.
- Geremia, E.; Clatz, O.; Menze, B.H.; Konukoglu, E.; Criminisi, A.; Ayache, N.J.N. Spatial decision forests for MS lesion segmentation in multi-channel magnetic resonance images. NeuroImage 2011, 57, 378–390.
- Konukoglu, E.; Glocker, B. Random forests in medical image computing. In Handbook of Medical Image Computing and Computer Assisted Intervention; Elsevier: Amsterdam, The Netherlands, 2020; pp. 457–480.
- Dogo, E.M.; Afolabi, O.J.; Nwulu, N.I.; Twala, B.; Aigbavboa, C.O. A comparative analysis of gradient descent-based optimization algorithms on convolutional neural networks. In Proceedings of the 2018 International Conference on Computational Techniques, Electronics and Mechanical Systems (CTEMS), Belgaum, India, 21–22 December 2018; IEEE: Piscataway, NJ, USA, 2018; pp. 92–99.
- Navamani, T.M. Efficient deep learning approaches for health informatics. In Deep Learning and Parallel Computing Environment for Bioengineering Systems; Elsevier: Amsterdam, The Netherlands, 2019; pp. 123–137.
- Khan, S.; Yairi, T. A review on the application of deep learning in system health management. Mech. Syst. Signal Process. 2018, 107, 241–265.
- Kunz, F.; Stellzig-Eisenhauer, A.; Zeman, F.; Boldt, J. Artificial intelligence in orthodontics. J. Orofac. Orthop. 2020, 81, 52–68.
- Amit, Y.; Geman, D. Shape quantization and recognition with randomized trees. Neural Comput. 1997, 9, 1545–1588.
- Cheplygina, V.; de Bruijne, M.; Pluim, J.P.W. Not-so-supervised: A survey of semi-supervised, multi-instance, and transfer learning in medical image analysis. Med. Image Anal. 2019, 54, 280–296.
- Simonyan, K.; Zisserman, A. Very deep convolutional networks for large-scale image recognition. arXiv 2014, arXiv:1409.1556.
- Morid, M.A.; Borjali, A.; Del Fiol, G. A scoping review of transfer learning research on medical image analysis using ImageNet. Comput. Biol. Med. 2021, 128, 104115.
- Tri Wahyuningrum, R.; Yasid, A.; Jacob Verkerke, G. Deep Neural Networks for Automatic Classification of Knee Osteoarthritis Severity Based on X-ray Images. In Proceedings of the 2020 The 8th International Conference on Information Technology: IoT and Smart City, Xi’an, China, 25–27 December 2020; pp. 110–114.
- Cootes, T.F.; Ionita, M.C.; Lindner, C.; Sauer, P. Robust and accurate shape model fitting using random forest regression voting. In Proceedings of the European Conference on Computer Vision, Florence, Italy, 7–13 October 2012; Springer: Berlin/Heidelberg, Germany, 2012; pp. 278–291.
- Jian, M.-S.; Shen, J.H.; Chen, Y.C.; Chang, C.C.; Fang, Y.C.; Chen, C.C.; Chen, W.H. Cloud image processing and analysis based flatfoot classification method. Int. J. Comput. 2014, 8, 90–98.
- Yang, C.H.; Chou, K.T.; Chung, M.B.; Chuang, K.S.; Huang, T.C. Automatic Detection of Calcaneal-Fifth Metatarsal Angle Using Radiograph: A Computer-Aided Diagnosis of Flat Foot for Military New Recruits in Taiwan. PLoS ONE 2015, 10, e0131387.
- Kao, E.-F.; Lu, C.-Y.; Wang, C.-Y.; Yeh, W.-C.; Hsia, P.-K. Fully automated determination of arch angle on weight-bearing foot radiograph. Comput. Methods Programs Biomed. 2018, 154, 79–88.
- Skwirczyński, M.J.; Gąciarz, T.; Skomorowski, M.; Wojciechowski, W. Automated measurement of foot deformities: Flatfoot, high arch, calcaneal fracture. Image Anal. Stereol. 2019, 38, 161–172.
- Nitris, L.; Varfolomeeva, A.; Blinov, D.; Kamishanskaya, I.; Lobishcheva, A.; Dydykin, S.; Blinova, E. Artificial Intelligence-based Solution for X-ray Longitudinal Flatfoot Determination and Scaling. Imaging Med. 2019, 11, 67–75.
- Lauder, J.; Harris, J.; Layton, B.; Heire, P.; Sorani, A.; DeSancha, M.; Davison, A.K.; Sammut-Powell, C.; Lindner, C. A fully automatic system to assess foot collapse on lateral weight-bearing foot radiographs: A pilot study. Comput. Methods Programs Biomed. 2022, 213, 106507.
- Adeshina, S.A.; Lindner, C.; Cootes, T.F. Automatic Annotation of Radiographs using Random Forest Regression Voting for Building Statistical Models for Skeletal Maturity. Int. J. Comput. Tech. 2017, 4, 49–55.
- Payer, C.; Štern, D.; Bischof, H.; Urschler, M. Regressing heatmaps for multiple landmark localization using CNNs. In Proceedings of the International Conference on Medical Image Computing and Computer-Assisted Intervention, Athens, Greece, 17–21 October 2016; Springer: Cham, Switzerland, 2016; pp. 230–238.
- Glocker, B.; Zikic, D.; Konukoglu, E.; Haynor, D.R.; Criminisi, A. Vertebrae localization in pathological spine CT via dense classification from sparse annotations. In Proceedings of the International Conference on Medical Image Computing and Computer-Assisted Intervention, Nagoya, Japan, 22–26 September 2013; Springer: Berlin/Heidelberg, Germany, 2013; pp. 262–270.
More