Your browser does not fully support modern features. Please upgrade for a smoother experience.
Please note this is a comparison between Version 2 by Lindsay Dong and Version 1 by Ilias Lazos.
Satellite geodesy, an indispensable modern tool for determining upper-crust deformation, can be used to assess tectonically active structures and improve our understanding of the geotectonic evolution in tectonically active regions. A region fulfilling these criteria is the North Aegean, part of the Eastern Mediterranean. It is one of the most tectonically, and hence, seismically, active regions worldwide, which makes it ideal for applying a satellite geodesy investigation.
- crust deformation
- GPS/GNSS analysis
- North Aegean geodynamics
- Greece
1. Introduction
Rapid technological advancements in navigation satellite missions, initially led by the US GPS (which started development in the 1970s) and subsequently other systems, such as the Russian GLONASS, Chinese Beidou and European Galileo, all integrated under the Global Navigation Satellite System (GNSS), provide an opportunity for the geoscience community to better understand plate tectonics motion and behaviour. Indeed, what was first an approximate estimation then became a high-resolution, quantified proof of how the lithospheric plates move and deform. The first studies started in the 1990s (e.g., [1][2]), and since then, the GPS/GNSS systems have been broadly used for monitoring geodynamics in various parts of the world. In the past several years, ground station hardware and analysis techniques have also significantly improved, making the acquisition and installation of the stations more attractive economically and the data processing more precise, leading to more realistic results. In this context, the spatial resolution has improved with the denser networks, while at the same time, the time windows have also become longer, permitting more extended periods of monitoring and more accurate observations.
In the East Mediterranean, plate tectonics have created a complex geodynamic regime: the westward tectonic escape of the Anatolian microplate pushes the respective Aegean southwestwards, producing intense interplate deformation expressed by lithospheric-scale tectonic structures, and intraplate deformation, forming numerous crustal faults [3][4]. The Hellenic Subduction Zone (HSZ), also known as the Hellenic Arc, and the North Anatolian Fault Zone (NAFZ) are the dominant interplate structures associated with the intense seismic activity. The key player in Aegean geodynamics is the 80 myr evolution of the Hellenic Arc, which migrated southwards to its current position with a simultaneous roll-back of the subducting slab ([5] and references therein). This procedure left room for the Anatolian plate to push the Aegean southwestwards through the North Anatolian Fault (NAF) and its western prolongation into the North Aegean Sea, i.e., the North Aegean Trough, generating a complex seismotectonic setting along the eastern Aegean Sea—western Anatolia (Figure 1).
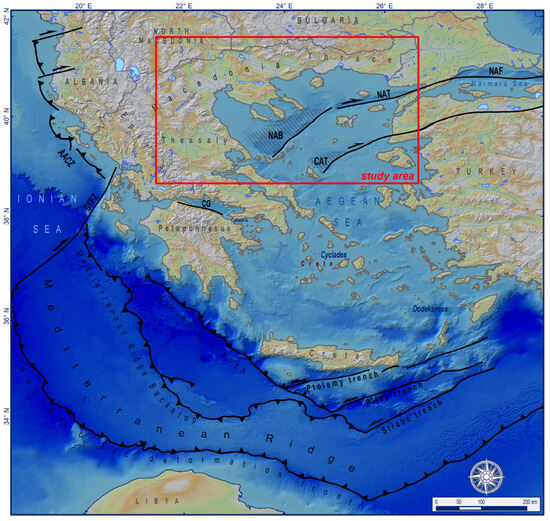
Figure 1. The main lithospheric-scale tectonic structures of the broader Aegean region (East Mediterranean). AACZ: Adria-Aegean Collision Zone, CTFZ: Cephalonia Transform Fault Zone, CAT: Central Aegean Trough, NAB: North Aegean Basin, NAF: North Anatolian Fault, NAT: North Aegean Trough, and CG: Corinth Gulf. The study area is marked by a red frame.
According to previous studies (e.g., [3][6]), the Hellenic Trench has undergone a retreat (approx. 580 km) since the Eocene–Miocene [7][8]. This geological phenomenon has resulted in a tectonic regime, which is characterized by N–S and NE–SW extensional occurrences in the Aegean and Anatolian regions [9][10]. The southwest Anatolian microplate motion is considered to be related to the exertion of pulling and pushing forces resulting from the HSZ in its western part [5]. This movement is affecting the lithospheric thickness across Anatolia and the Aegean [11][12]. The Hellenic Trench (HT) retreat results in the extensional stress field generation, causing the crustal thinning of central and northern Greece and western Anatolia ([13][14] and references therein).
Since it is clear to the scientific community that satellite geodesy can provide detailed information about the motions of plate tectonics and the deformation of the crust, it is widely applied. Particularly, the Aegean and the eastern Mediterranean constitute an ideal laboratory site for geodetic analyses, and especially for the determination of strain [15][16][17][18][19][20][21]. Therefore, various studies have been conducted in the Aegean region by implementing measurements recorded by either permanent or campaign GPS/GNSS stations [22][23][24][25][26][27]. While preceding seismological studies only implied the gross geodynamic setting of the East Mediterranean (the relation between the Arabian, Nubian and Eurasian plates), the geodetic studies confirmed and measured plate boundaries and motions. Furthermore, they resulted in the separating of the region into several blocks, proposing potential geodynamic models (e.g., [28][29][30][31]), which are complicated. Focusing on the Aegean, two distinct velocity clusters are observed throughout the area, distributed on both sides of the NAT (and its continuation) and considered as the boundary between the North and South Aegean [32][33]. The most recent studies predominantly focus on developing crustal block modelling (e.g., [31][34][35][36]), attempting to interpret their geodynamic activity, as well as their relationship to seismic events (e.g., [37][38][39][40]). Notably, the block modelling considers that each block partially receives the brittle tectonics effect [31][41][42], caused by tectonically active structures, while it is imprinted on the upper-crust strain. This North Aegean region strain is documented on the seismic slip and the gravitational collapse of the Aegean crustal wedge in response to slab roll-back at the Eurasian–Nubian convergence boundary [43][44][45], while in tandem, strike-slip faulting dominates in this region [46][47][48].
 A broad spectrum of strain field values is exhibited in the Strymon basin region. In particular, the MaHE values show a range of variability from approximately −60 to 2650 × 10−9, whereas the corresponding MiHE values demonstrate a range of variability from approximately −650 to 150 × 10−9, as depicted in Figure 2b. The primary analysis of the distribution of the values [46] indicates that the absolute maximum values of both MaHE and MiHE are primarily concentrated along the eastern boundary and the northernmost part of the western boundary of the Strymon basin. Moreover, the analysis of MaHE and MiHE suggests that extension is the dominant process in the study area, resulting in a normal faulting activity. In particular, the Strymon basin exhibits a notable concentration of maximum values at its eastern and northwestern boundaries. At the same time, the high MaHE values of these regions, coupled with exceedingly low absolute values of corresponding MiHE, suggest the prevalence of dip-slip normal faulting activity [46]. The documented data reveals a gradual decrease in both MaHe and MiHE values on either side of the area. Simultaneously, the difference in values between MaHE and MiHE decreases, with MaHE values remaining greater than the corresponding MiHE values. These findings suggest oblique-slip normal faulting activity in the Strymon and the adjacent (e.g., Drama) basins. Additionally, the northwestern part of the Strymon basin exhibits positive values for both MaHE and MiHE, indicating a prevalent, pure extensional setting characterized by normal faulting. Finally, it is worth mentioning that the direction of the MaHE vectors is nearly perpendicular to the strike of the faults and fault zones, thereby providing evidence for the existence of these tectonic structures and their normal faulting characteristics.
Focusing on the wider Thessalian basin region, the values show a range of −40 to 380 nano-strain, with the extensional regime prevailing as the dominant one (Figure 2a,b) [50]. The MaHE vectors exhibit an approximate N–S orientation in the southern Thessalian basin. This region also displays the most significant values, exceeding 200 nano-strain. A notable alteration in direction is discernible towards the westernmost Thessalian basin, while similar noticeable changes are documented in the MaHE direction of the northernmost part [50]. Remarkable values exceeding 150 nano-strain are observed within the Larissa plain and the Thessalian basin southern boundary. The findings of the MaHE study indicate a progressive rise of tectonic activity in the central and eastern Thessalian basin.
A broad spectrum of strain field values is exhibited in the Strymon basin region. In particular, the MaHE values show a range of variability from approximately −60 to 2650 × 10−9, whereas the corresponding MiHE values demonstrate a range of variability from approximately −650 to 150 × 10−9, as depicted in Figure 2b. The primary analysis of the distribution of the values [46] indicates that the absolute maximum values of both MaHE and MiHE are primarily concentrated along the eastern boundary and the northernmost part of the western boundary of the Strymon basin. Moreover, the analysis of MaHE and MiHE suggests that extension is the dominant process in the study area, resulting in a normal faulting activity. In particular, the Strymon basin exhibits a notable concentration of maximum values at its eastern and northwestern boundaries. At the same time, the high MaHE values of these regions, coupled with exceedingly low absolute values of corresponding MiHE, suggest the prevalence of dip-slip normal faulting activity [46]. The documented data reveals a gradual decrease in both MaHe and MiHE values on either side of the area. Simultaneously, the difference in values between MaHE and MiHE decreases, with MaHE values remaining greater than the corresponding MiHE values. These findings suggest oblique-slip normal faulting activity in the Strymon and the adjacent (e.g., Drama) basins. Additionally, the northwestern part of the Strymon basin exhibits positive values for both MaHE and MiHE, indicating a prevalent, pure extensional setting characterized by normal faulting. Finally, it is worth mentioning that the direction of the MaHE vectors is nearly perpendicular to the strike of the faults and fault zones, thereby providing evidence for the existence of these tectonic structures and their normal faulting characteristics.
Focusing on the wider Thessalian basin region, the values show a range of −40 to 380 nano-strain, with the extensional regime prevailing as the dominant one (Figure 2a,b) [50]. The MaHE vectors exhibit an approximate N–S orientation in the southern Thessalian basin. This region also displays the most significant values, exceeding 200 nano-strain. A notable alteration in direction is discernible towards the westernmost Thessalian basin, while similar noticeable changes are documented in the MaHE direction of the northernmost part [50]. Remarkable values exceeding 150 nano-strain are observed within the Larissa plain and the Thessalian basin southern boundary. The findings of the MaHE study indicate a progressive rise of tectonic activity in the central and eastern Thessalian basin.
 Concerning the Strymon basin, the MaxSS value analysis shows a range of approximately 1 to 2750 × 10−9 nano-strain (Figure 3a). The highest MaxSS values are recorded in the eastern region of the Strymon basin, with comparable values noted in the northwestern margin [46], respectively, as depicted in Figure 3a. Furthermore, high MaxSS values are documented in the southern region of the western boundary of the Strymon basin. The results of the geostatistical analysis, as presented in Figure 3b, provide the distribution of MaxSS. In particular, the analysis reveals that higher values of MaxSS are concentrated along the WNW–ESE axis of the Strymon basin [46]. Notably, the adjacent basins (such as the Drama basin) exhibit exceedingly low, nearly negligible values. Consequently, the significant shear values highlight the tectonic structures that are actively distributed along the boundaries of the Strymon basin, with particular emphasis on the eastern one.
Finally, the Thessaly area exhibits a range of MSS values from 5 to 730 nano-strain. According to the analysis of MSS values (Figure 3a,b), the regions with the highest values, exceeding 400 nano-strain, are adjacent to the western boundary of the Thessalian basin [50]; additionally, high MSS values are observed in the southern part of this region. Moreover, intermediate values (approximately 200–400 nano-strain) have been detected all along the western margin, while the northern part is characterized by low MSS values, measuring less than 100 nano-strain.
Concerning the Strymon basin, the MaxSS value analysis shows a range of approximately 1 to 2750 × 10−9 nano-strain (Figure 3a). The highest MaxSS values are recorded in the eastern region of the Strymon basin, with comparable values noted in the northwestern margin [46], respectively, as depicted in Figure 3a. Furthermore, high MaxSS values are documented in the southern region of the western boundary of the Strymon basin. The results of the geostatistical analysis, as presented in Figure 3b, provide the distribution of MaxSS. In particular, the analysis reveals that higher values of MaxSS are concentrated along the WNW–ESE axis of the Strymon basin [46]. Notably, the adjacent basins (such as the Drama basin) exhibit exceedingly low, nearly negligible values. Consequently, the significant shear values highlight the tectonic structures that are actively distributed along the boundaries of the Strymon basin, with particular emphasis on the eastern one.
Finally, the Thessaly area exhibits a range of MSS values from 5 to 730 nano-strain. According to the analysis of MSS values (Figure 3a,b), the regions with the highest values, exceeding 400 nano-strain, are adjacent to the western boundary of the Thessalian basin [50]; additionally, high MSS values are observed in the southern part of this region. Moreover, intermediate values (approximately 200–400 nano-strain) have been detected all along the western margin, while the northern part is characterized by low MSS values, measuring less than 100 nano-strain.
 Accordingly, the AS results of the Strymon basin reveal a dilatation dominance over compaction (Figure 4a), with values ranging from approximately −600 (compaction) to 2750 × 10−9 (dilatation). Even though the dilatation type dominates in the Strymon basin (Figure 4b), it partially coexists with compaction, indicating shear occurrence [46]. Specifically, the greatest concentrations are only documented within the Strymon basin area, especially along the eastern margin and the northwestern part of the Strymon basin. Concerning the high-value concentrations of compaction (Figure 4b), they are predominantly documented at the eastern Strymon basin boundary [46]. The difference between dilatation and compaction defines extension (dilatation > compaction) or compression (compaction > dilatation), whereas comparable values indicate shear tectonics [49]. The Strymon basin is predominantly characterized by dilatation over compaction; nevertheless, the compaction occurrence is noteworthy, indicating that despite the dilatation dominance, a remarkable shear component is documented, leading to oblique-slip, normal faulting. A typical example is the southernmost part of the Strymon basin, which is adjacent to the North Aegean Sea and potentially affected by the corresponding strike-slip tectonic regime.
Regarding the Thessalian basin area, it exhibits AS values that vary from −420 to 360 nano-strain [50], implying occurrences of both dilatation and compaction (Figure 6a,b). The phenomenon of compaction is primarily spotted at the western boundary of Thessalian basin, where the absolute strain (AS) exceeds 100 nano-strain. However, there are also some areas in the central part, where the absolute strain ranges between 50 and 150 nano-strain. The dilatation shows a greater dispersion when higher values are considered, specifically with values exceeding 200 nano-strain in the southeastern Thessalian basin [50]; the maximum dilatation is observed to the south of the Thessalian basin. Dilatation values ranging from 100 to 200 nano-strain have been observed in the northwestern part of the Thessalian basin, while at its northern part, small values (approximately 50 nano-strain) for both compaction and dilatation are documented.
Accordingly, the AS results of the Strymon basin reveal a dilatation dominance over compaction (Figure 4a), with values ranging from approximately −600 (compaction) to 2750 × 10−9 (dilatation). Even though the dilatation type dominates in the Strymon basin (Figure 4b), it partially coexists with compaction, indicating shear occurrence [46]. Specifically, the greatest concentrations are only documented within the Strymon basin area, especially along the eastern margin and the northwestern part of the Strymon basin. Concerning the high-value concentrations of compaction (Figure 4b), they are predominantly documented at the eastern Strymon basin boundary [46]. The difference between dilatation and compaction defines extension (dilatation > compaction) or compression (compaction > dilatation), whereas comparable values indicate shear tectonics [49]. The Strymon basin is predominantly characterized by dilatation over compaction; nevertheless, the compaction occurrence is noteworthy, indicating that despite the dilatation dominance, a remarkable shear component is documented, leading to oblique-slip, normal faulting. A typical example is the southernmost part of the Strymon basin, which is adjacent to the North Aegean Sea and potentially affected by the corresponding strike-slip tectonic regime.
Regarding the Thessalian basin area, it exhibits AS values that vary from −420 to 360 nano-strain [50], implying occurrences of both dilatation and compaction (Figure 6a,b). The phenomenon of compaction is primarily spotted at the western boundary of Thessalian basin, where the absolute strain (AS) exceeds 100 nano-strain. However, there are also some areas in the central part, where the absolute strain ranges between 50 and 150 nano-strain. The dilatation shows a greater dispersion when higher values are considered, specifically with values exceeding 200 nano-strain in the southeastern Thessalian basin [50]; the maximum dilatation is observed to the south of the Thessalian basin. Dilatation values ranging from 100 to 200 nano-strain have been observed in the northwestern part of the Thessalian basin, while at its northern part, small values (approximately 50 nano-strain) for both compaction and dilatation are documented.
2. Tectonic Geodesy Synthesis of the North Aegean Region
2.1. Synthesis of Strain Results
2.1.1. Maximum (MaHE) and Minimum (MiHE) Horizontal Extension
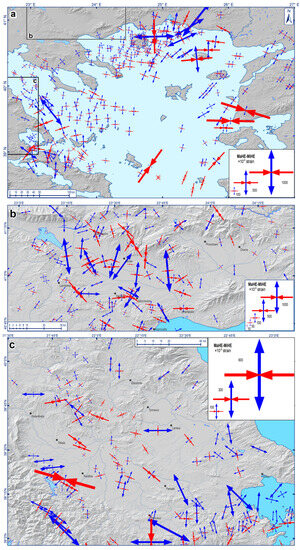
The MaHE and MiHE for the North Aegean Sea region are characterized by a wide range of strain field values. In particular, these parameters demonstrate a heterogeneous strain distribution within the North Aegean Sea region, as depicted in Figure 2a. The MaHE values range from approximately −50 to 1000 nano-strain, with the highest value observed in the Thrace region. Similarly, the MiHE values range approximately from −1250 to 70 nano-strain [49]. The North Aegean Sea is predominantly characterized by shear, with comparable values of MaHE and MiHE. Moreover, the MaHE and MiHE exhibit an increase in the northwestern region of Turkey, showing a slight NE–SW (MaHE orientation) extension dominance. These results indicate that the crustal dynamics of the North Aegean Trough (NAT) are more complex ranging from 100 to 700 nano-strain, particularly under a shear setting. At the same time, its extension is oriented in an NNE–SSW to N–S direction [49]. The shear occurrence can also be observed in the North Aegean Basin (NAB), characterized by moderate magnitudes and a gradual transition in an approximately NW–SE extension direction. The NAB exhibits a prevalence of local extension dominance over compaction. The area exhibits a distinct extensional trend in contrast to the adjacent regions, which follows an ENE–WSW direction [49]. The strain regime prevalent in the northern Aegean region, except for the wider Skyros Island area, is the transition from pure to quasi-pure extension.Figure 2. Maximum (MaHE; blue arrows) and Minimum (MiHE; red arrows) Horizontal Extension in the regions of: (a) North Aegean Sea; (b) Strymon basin; and (c) Thessalian basin.
2.1.2. Maximum Shear Strain (MaxSS)
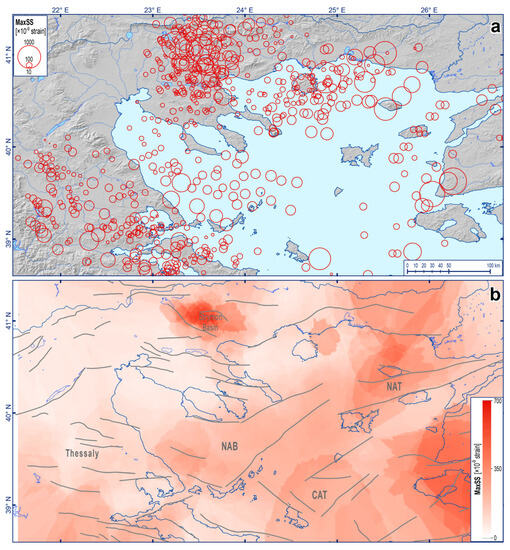
The MaxSS parameter exhibits a wide distribution of values within the North Aegean Sea region, as depicted in Figure 3. These values range from 10 to 1650 nano-strain, with both peak values observed in the Samothraki Plateau. The regions that show the highest values are documented in the eastern part of the Aegean Sea (western Turkey), the CAT (Central Aegean Trough) and the NAT, as shown in Figure 3a. The MaxSS is characterized by slightly reduced values within the vicinity of the NAB, in the transitional zone that links the NAB and the CAT, and the broader region of northwestern Turkey. The regions showing great values are primarily associated with shear faulting. The extension may exhibit a greater magnitude in regions with possible oblique-to-normal dip-slip faulting. An example of such a scenario can be observed in the eastern Aegean Sea region, suggesting the occurrence of normal and oblique-slip faulting. Local kinematic variations (from pure normal dip-slip to strike-slip faulting) can be observed in regions with moderate values.Figure 3. Maximum Shear Strain (MaxSS) in the wider North Aegean region: (a) MaxSS values (red circles) of all triangles, constructed within the three study areas; (b) MaxSS values grid, based on the interpolation (kriging) geostatistical analysis. Dark lines in (b) are faults.
2.1.3. Area Strain (AS)
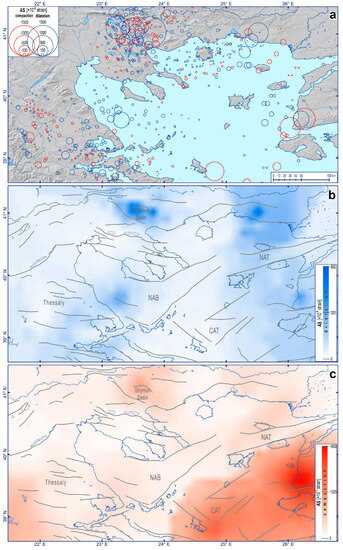
Two distinct AS types are distinguished: (i) dilatation, which is directly related to extension, and (ii) compaction, which is directly related to compression. Compaction is the predominant form of strain in the North Aegean Sea region, while the nano-strain values for AS range from −1180 (compaction) to 970 (dilatation) (Figure 4a). The dilatation encompasses a larger region (Figure 4b); the most significant values are documented in the eastern and northeastern parts of the North Aegean Sea. Samothraki Plateau and western NAB have smaller but notable dilatation values. Most compaction occurs in the southerly area of the North Aegean Sea (NAB and NAT). In particular, the CAT exhibits remarkably low values. Compaction is limited to the north of the NAB and NAT, showing a slight presence in the northeast of the North Aegean Sea and along the eastern coast of Thessaly. In a case of a vast contrast between dilatation and compaction, extensional or compressional tectonics occur, respectively. However, shear tectonics are documented in a case of similar dilatation and compaction values. For instance, the broader NAT region is characterized by high dilatation and compaction values, defining a more complex setting, as the two strain types do not extend uniformly or equally.Figure 4. Area Strain (AS) in the wider North Aegean area: (a) Dilatation (blue circles) and compaction (red circles) calculated values; (b) dilatation values grid, based on the interpolation (kriging) geostatistical methodology; and (c) compaction values grid, based on the interpolation (kriging) geostatistical methodology. Dark lines in (b,c) are faults.
References
- Bevis, M. GPS Networks: The Practical Side. Eos Trans. Am. Geophys. Union. 1991, 72, 49.
- Segall, P.; Davis, J.L. GPS Applications for Geodynamics and Earthquake Studies. Annu. Rev. Earth Planet. Sci. 1997, 25, 301–336.
- McKenzie, D. Active Tectonics of the Mediterranean Region. Geophys. J. Int. 1972, 30, 109–185.
- Taymaz, T.; Jackson, J.; McKenzie, D. Active Tectonics of the North and Central Aegean Sea. Geophys. J. Int. 1991, 106, 433–490.
- Jolivet, L.; Faccenna, C.; Huet, B.; Labrousse, L.; Le Pourhiet, L.; Lacombe, O.; Lecomte, E.; Burov, E.; Denèle, Y.; Brun, J.P.; et al. Aegean Tectonics: Strain Localisation, Slab Tearing and Trench Retreat. Tectonophysics 2013, 597–598, 1–33.
- Brun, J.P.; Faccenna, C. Exhumation of High-Pressure Rocks Driven by Slab Rollback. Earth Planet. Sci. Lett. 2008, 272, 1–7.
- Philippon, M.; Brun, J.P.; Gueydan, F.; Sokoutis, D. The Interaction between Aegean Back-Arc Extension and Anatolia Escape since Middle Miocene. Tectonophysics 2014, 631, 176–188.
- Erman, C.; Yolsal-Çevikbilen, S.; Eken, T.; Tilmann, F.; Keleş, D.; Taymaz, T. Constraints on the Lithospheric Kinematics in the Aegean and Western Anatolia Unveiled by SKS Splitting Observations. J. Geophys. Res. Solid. Earth 2022, 127, e2022JB025265.
- Le Pichon, X.; Angelier, J. The Hellenic Arc and Trench System: A Key to the Neotectonic Evolution of the Eastern Mediterranean Area. Tectonophysics 1979, 60, 1–42.
- Taymaz, T.; Yilmaz, Y.; Dilek, Y. The Geodynamics of the Aegean and Anatolia: Introduction. Geol. Soc. Spec. Publ. 2007, 291, 1–16.
- Meijer, P.T.; Wortel, M.J.R. Present-Day Dynamics of the Aegean Region: A Model Analysis of the Horizontal Pattern of Stress and Deformation. Tectonics 1997, 16, 879–895.
- McKenzie, D.; Jackson, J. Conditions for Flow in the Continental Crust. Tectonics 2002, 21, 5-1–5-7.
- Sodoudi, F.; Kind, R.; Hatzfeld, D.; Priestley, K.; Hanka, W.; Wylegalla, K.; Stavrakakis, G.; Vafidis, A.; Harjes, H.P.; Bohnhoff, M. Lithospheric Structure of the Aegean Obtained from P and S Receiver Functions. J. Geophys. Res. Solid. Earth 2006, 111, B12307.
- Jolivet, L.; Menant, A.; Clerc, C.; Sternai, P.; Bellahsen, N.; Leroy, S.; Pik, R.; Stab, M.; Faccenna, C.; Gorini, C. Extensional Crustal Tectonics and Crust-Mantle Coupling, a View from the Geological Record. Earth Sci. Rev. 2018, 185, 1187–1209.
- Noomen, R.; Springer, T.A.; Ambrosius, B.A.C.; Herzberger, K.; Kuijper, D.C.; Mets, G.-J.; Overgaauw, B.; Wakker, K.F. Crustal Deformations in the Mediterranean Area Computed from SLR and GPS Observations. J. Geodyn. 1996, 21, 73–96.
- Becker, M. Assessment of Height Variations by GPS at Mediterranean and Black Sea Coast Tide Gauges from the SELF Projects. Glob. Planet. Change 2002, 34, 5–35.
- Pérouse, E.; Chamot-Rooke, N.; Rabaute, A.; Briole, P.; Jouanne, F.; Georgiev, I.; Dimitrov, D. Bridging Onshore and Offshore Present-Day Kinematics of Central and Eastern Mediterranean: Implications for Crustal Dynamics and Mantle Flow. Geochem. Geophys. Geosyst. 2012, 13, Q09013.
- Müller, M.D.; Geiger, A.; Kahle, H.G.; Veis, G.; Billiris, H.; Paradissis, D.; Felekis, S. Velocity and Deformation Fields in the North Aegean Domain, Greece, and Implications for Fault Kinematics, Derived from GPS Data 1993–2009. Tectonophysics 2013, 597–598, 34–49.
- Serpelloni, E.; Faccenna, C.; Spada, G.; Dong, D.; Williams, S.D.P. Vertical GPS Ground Motion Rates in the Euro-Mediterranean Region: New Evidence of Velocity Gradients at Different Spatial Scales along the Nubia-Eurasia Plate Boundary. J. Geophys. Res. Solid. Earth 2013, 118, 6003–6024.
- Jenny, S.; Goes, S.; Giardini, D.; Kahle, H.G. Earthquake Recurrence Parameters from Seismic and Geodetic Strain Rates in the Eastern Mediterranean. Geophys. J. Int. 2004, 157, 1331–1347.
- Kahle, H.G.; Straub, C.; Reilinger, R.; McClusky, S.; King, R.; Hurst, K.; Veis, G.; Kastens, K.; Cross, P. The Strain Rate Field in the Eastern Mediterranean Region, Estimated by Repeated GPS Measurements. Tectonophysics 1998, 294, 237–252.
- Billiris, H.; Paradissis, D.; Veis, G.; England, P.; Featherstone, W.; Parsons, B.; Cross, P.; Rands, P.; Rayson, M.; Sellers, P.; et al. Geodetic Determination of Tectonic Deformation in Central Greece from 1900 to 1988. Nature 1991, 350, 124–129.
- Clarke, P.J.; Davies, R.R.; England, P.C.; Parsons, B.; Billiris, H.; Paradissis, D.; Veis, G.; Cross, P.A.; Denys, P.H.; Ashkenazi, V.; et al. Crustal Strain in Central Greece from Repeated GPS Measurements in the Interval 1989–1997. Geophys. J. Int. 1998, 135, 195–214.
- Chousianitis, K.; Ganas, A.; Evangelidis, C.P. Strain and Rotation Rate Patterns of Mainland Greece from Continuous GPS Data and Comparison between Seismic and Geodetic Moment Release. J. Geophys. Res. Solid. Earth 2015, 120, 3909–3931.
- England, P.; Houseman, G.; Nocquet, J.-M. Constraints from GPS Measurements on the Dynamics of Deformation in Anatolia and the Aegean. J. Geophys. Res. Solid. Earth 2016, 121, 8888–8916.
- D’Agostino, N.; Métois, M.; Koci, R.; Duni, L.; Kuka, N.; Ganas, A.; Georgiev, I.; Jouanne, F.; Kaludjerovic, N.; Kandić, R. Active Crustal Deformation and Rotations in the Southwestern Balkans from Continuous GPS Measurements. Earth Planet. Sci. Lett. 2020, 539, 116246.
- Caporali, A.; Aichhorn, C.; Barlik, M.; Becker, M.; Fejes, I.; Gerhatova, L.; Ghitau, D.; Grenerczy, G.; Hefty, J.; Krauss, S.; et al. Surface Kinematics in the Alpine-Carpathian-Dinaric and Balkan Region Inferred from a New Multi-Network GPS Combination Solution. Tectonophysics 2009, 474, 295–321.
- Le Pichon, X.; Chamot-Rooke, N.; Lallemant, S.; Noomen, R.; Veis, G. Geodetic Determination of the Kinematics of Central Greece with Respect to Europe: Implications for Eastern Mediterranean Tectonics. J. Geophys. Res. 1995, 100, 12675–12690.
- McClusky, S.; Balassanian, S.; Barka, A.; Demir, C.; Ergintav, S.; Georgiev, I.; Gurkan, O.; Hamburger, M.; Hurst, K.; Kahle, H.; et al. Global Positioning System Constraints on Plate Kinematics and Dynamics in the Eastern Mediterranean and Caucasus. J. Geophys. Res. 2000, 105, 5695.
- Kahle, H.G.; Cocard, M.; Peter, Y.; Geiger, A.; Reilinger, R.; Barka, A.; Veis, G. GPS-Derived Strain Rate Field within the Boundary Zones of the Eurasian, African, and Arabian Plates. J. Geophys. Res. Solid. Earth 2000, 105, 23353–23370.
- Nyst, M.; Thatcher, W. New Constraints on the Active Tectonic Deformation of the Aegean. J. Geophys. Res. B Solid. Earth 2004, 109, 1–23.
- Nocquet, J.M. Present-Day Kinematics of the Mediterranean: A Comprehensive Overview of GPS Results. Tectonophysics 2012, 579, 220–242.
- Simpson, R.W.; Thatcher, W.; Savage, J.C. Using Cluster Analysis to Organize and Explore Regional GPS Velocities. Geophys. Res. Lett. 2012, 39, L18307.
- Reilinger, R.; McClusky, S.; Paradissis, D.; Ergintav, S.; Vernant, P. Geodetic Constraints on the Tectonic Evolution of the Aegean Region and Strain Accumulation along the Hellenic Subduction Zone. Tectonophysics 2010, 488, 22–30.
- Avallone, A.; Briole, P.; Agatza-Balodimou, A.M.; Billiris, H.; Charade, O.; Mitsakaki, C.; Nercessian, A.; Papazissi, K.; Paradissis, D.; Veis, G. Analysis of Eleven Years of Deformation Measured by GPS in the Corinth Rift Laboratory Area. Comptes Rendus Geosci. 2004, 336, 301–311.
- Floyd, M.A.; Billiris, H.; Paradissis, D.; Veis, G.; Avallone, A.; Briole, P.; McClusky, S.; Nocquet, J.-M.; Palamartchouk, K.; Parsons, B.; et al. A New Velocity Field for Greece: Implications for the Kinematics and Dynamics of the Aegean. J. Geophys. Res. 2010, 115, B10403.
- Cocard, M.; Kahle, H.G.; Peter, Y.; Geiger, A.; Veis, G.; Felekis, S.; Paradissis, D.; Billiris, H. New Constraints on the Rapid Crustal Motion of the Aegean Region: Recent Results Inferred from GPS Measurements (1993-1998) across the West Hellenic Arc, Greece. Earth Planet. Sci. Lett. 1999, 172, 39–47.
- Briole, P.; Rigo, A.; Lyon-Caen, H.; Ruegg, J.C.; Papazissi, K.; Mitsakaki, C.; Balodimou, A.; Veis, G.; Hatzfeld, D.; Deschamps, A. Active Deformation of the Corinth Rift, Greece: Results from Repeated Global Positioning System Surveys between 1990 and 1995. J. Geophys. Res. Solid. Earth 2000, 105, 25605–25625.
- Lagios, E.; Sakkas, V.; Papadimitriou, P.; Parcharidis, I.; Damiata, B.N.; Chousianitis, K.; Vassilopoulou, S. Crustal Deformation in the Central Ionian Islands (Greece): Results from DGPS and DInSAR Analyses (1995–2006). Tectonophysics 2007, 444, 119–145.
- Hollenstein, C.; Müller, M.D.; Geiger, A.; Kahle, H.G. Crustal Motion and Deformation in Greece from a Decade of GPS Measurements, 1993-2003. Tectonophysics 2008, 449, 17–40.
- Reilinger, R.; McClusky, S.; Vernant, P.; Lawrence, S.; Ergintav, S.; Cakmak, R.; Ozener, H.; Kadirov, F.; Guliev, I.; Stepanyan, R.; et al. GPS Constraints on Continental Deformation in the Africa-Arabia-Eurasia Continental Collision Zone and Implications for the Dynamics of Plate Interactions. J. Geophys. Res. Solid. Earth 2006, 111, B05411.
- Vernant, P.; Reilinger, R.; McClusky, S. Geodetic Evidence for Low Coupling on the Hellenic Subduction Plate Interface. Earth Planet. Sci. Lett. 2014, 385, 122–129.
- Faccenna, C.; Bellier, O.; Martinod, J.; Piromallo, C.; Regard, V. Slab Detachment beneath Eastern Anatolia: A Possible Cause for the Formation of the North Anatolian Fault. Earth Planet. Sci. Lett. 2006, 242, 85–97.
- Reilinger, R.; McClusky, S. Nubia-Arabia-Eurasia Plate Motions and the Dynamics of Mediterranean and Middle East Tectonics. Geophys. J. Int. 2011, 186, 971–979.
- Mantovani, E.; Babbucci, D.; Tamburelli, C.; Viti, M. Late Cenozoic Evolution and Present Tectonic Setting of the Aegean–Hellenic Arc. Geosciences 2022, 12, 104.
- Lazos, I.; Papanikolaou, I.; Sboras, S.; Foumelis, M.; Pikridas, C. Geodetic Upper Crust Deformation Based on Primary GNSS and INSAR Data in the Strymon Basin, Northern Greece-Correlation with Active Faults. Appl. Sci. 2022, 12, 9391.
- Lazos, I.; Sboras, S.; Chousianitis, K.; Kondopoulou, D.; Pikridas, C.; Bitharis, S.; Pavlides, S. Temporal Evolution of Crustal Rotation in the Aegean Region Based on Primary Geodetically-Derived Results and Palaeomagnetism. Acta Geod. Geophys. 2022, 57, 317–334.
- Papanikolaou, D.J.; Royden, L.H. Disruption of the Hellenic Arc: Late Miocene Extensional Detachment Faults and Steep Pliocene-Quaternary Normal Faults-Or What Happened at Corinth? Tectonics 2007, 26, TC5003.
- Lazos, I.; Sboras, S.; Pikridas, C.; Pavlides, S.; Chatzipetros, A. Geodetic Analysis of the Tectonic Crustal Deformation Pattern in the North Aegean Sea, Greece. Mediterr. Geosci. Rev. 2021, 3, 79–94.
- Lazos, I.; Sboras, S.; Chousianitis, K.; Bitharis, S.; Mouzakiotis, E.; Karastathis, V.; Pikridas, C.; Fotiou, A.; Galanakis, D. Crustal Deformation Analysis of Thessaly (Central Greece) before the March 2021 Earthquake Sequence near Elassona-Tyrnavos (Northern Thessaly). Acta Geodyn. Geomater. 2021, 18, 379–385.
More