Your browser does not fully support modern features. Please upgrade for a smoother experience.
Please note this is a comparison between Version 1 by Anton R Kiselev and Version 2 by Dean Liu.
Skeletal muscles, as well as adipose tissue, are largely recognized as endocrine organs, producing biologically active substances, such as myokines and adipokines. They may have either beneficial or harmful effects on the organism and its functions, acting through the endocrine, paracrine, and autocrine pathways. Moreover, the collocation of adipose tissue and skeletal muscles, i.e., the amount of intramuscular, intermuscular, and visceral adipose depots, may be of major importance for metabolic health. Traditionally, the generalized and progressive loss of skeletal muscle mass and strength or physical function, named sarcopenia, has been thought to be associated with age.
- obesity
- steroidogenesis
- sarcopenia
- skeletal muscle dysfunction
- insulin resistance
1. Metabolic Properties of INTM Fat
Currently, INTM fat is most often considered to be related to metabolic disturbances. Indeed, several studies have established that the increase in the amount of INTM fat is significantly associated with a decrease in muscle mass and strength, as well as insulin sensitivity [1][2][24,25]. Several studies indicate that INTM fat is functionally quite similar to visceral adipose tissue (VAT), particularly with regard to its ability to induce and maintain inflammation and influence insulin sensitivity [1][3][24,26]. For instance, both INTM fat and VAT are characterized by the increased expression of interleukin (IL)-6, tumor necrosis factor (TNF), and plasminogen activator inhibitor 1 (PAI1) [4][27]. At the same time, the results of direct comparisons of the qualitive and quantitative composition of inflammatory proteins secreted by INTM fat, VAT, or subcutaneous adipose tissue (SAT) in individuals with obesity clearly indicate that INTM depots secrete substantially greater amounts of inflammatory cytokines (such as interferon-(IFN) γ, IL-2, IL-5, and IL-10) and chemokines compared to VAT or SAT [5][28]. Moreover, it was shown that the lipolytic capacity of INTM fat was significantly greater than the rate of lipolysis in subcutaneous adipose tissue and was similar to that in VAT [6][7][29,30]. Thus, INTM fat may increase the concentration of free fatty acids in the interstitial space, negatively influencing the local muscle microenvironment and promoting muscle insulin resistance. In an in vitro study, it was shown that proteins secreted by INTM fat were able to increase the concentration of 1,2-diacylglycerols within the myotubes, intramyocellular lipids associated with impaired insulin sensitivity [6][29]. Sachs et al. [3][26] demonstrated that the metabolic properties of INTM fat can change and become more unfavorable with the aggravation of metabolic health. Further, taking into account the role of insulin signaling in muscle protein synthesis, the impaired insulin sensitivity of skeletal muscles resulting from myosteatosis may directly contribute to the decrease in muscle strength and mass [8][31].
It is suggested that INTM fat may originate from several cell sources, in particular fibro-adipogenic progenitors, muscle satellite stem cells, adipose-derived stem cells, and bone-marrow-derived mesenchymal stem cells.
2. Intramyocellular Fat Depots
Intramyocellular (IMCL) fat depots refer to the accumulation of fat within the myofibers themselves. Inside the muscle fibers, lipids are stored mainly in the form of triacylglycerols (TAG), being localized within the lipid droplets. Other components of such lipid droplets include diacylglycerols (DAG), sphingolipids, and phospholipids. These depots are thought to be important for muscle contraction during physical exercises and to be associated with the impaired insulin sensitivity in patients with obesity and/or T2DM, as well as in elderly and sedentary individuals. Indeed, in their study, J.J. Dubé et al. [9][49] showed that the completion of a 16-week moderate exercise training program was accompanied by the increase in IMCL fat content by 21% in 25 older obese individuals. Additionally, the authors noticed that physical activity contributed to the increase in the content of triacylglycerols in skeletal muscles and to the decrease in the content of both diacylglycerols and ceramides within the IMCL depots. This, in turn, resulted in the improvement of insulin sensitivity. It is worth noting that the above-mentioned effect was independent of weight reduction, thus suggesting that physical activity itself may have a beneficial effect on the metabolic health of obese adults.
These described findings are in line with the so called “athlete’s paradox”; that is, the higher amounts of IMCL fat in the muscles are observed not only in patients with obesity and/or T2DM, but also in endurance-trained athletes (Figure 12) [9][10][11][49,50,51]. There are several possible explanations for this phenomenon. First, the increase in the IMCL fat amount in trained athletes is necessary to provide enough substrates for energy metabolism during regular physical exercise, whereas in obese patients and patients with T2DM, the IMCL depots serve as storage for excess fat [12][52]. Second, the content of IMCL depots does differ between the endurance-trained athletes and obese adults. In particular, the latter have greater amounts of DAGs and ceramides within the IMCL depots. These substances are regarded as lipid metabolites, and the increase in their content within the myofibers is suggested to be associated with impaired insulin sensitivity, possibly due to the decrease in muscle oxidative capacity [9][49]. Accordingly, B.C. Bergman et al. [11][51] demonstrated that physical exercise promoted the decrease in di-saturated DAG concentration both within the membrane and cytosol, and this resulted in the insulin sensitization of skeletal muscles. Moreover, A Gemmink et al. [13][53] showed that trained athletes had higher concentrations of perilipin 5 (PLIN5), a lipid droplet coating protein, compared to patients with T2DM. Although the content of PLIN5 was not significantly associated with the size and number of lipid droplets, it was positively correlated with the muscle oxidative capacity.
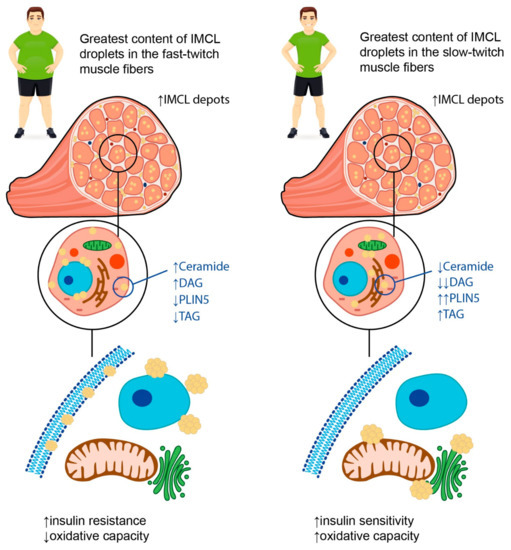
Figure 12. Possible explanations for “athlete’s paradox”. The term “athlete’s paradox” describes a condition characterized by high amounts of IMCL fat in the muscles observed both in patients with obesity and/or T2DM, and in endurance-trained athletes. In obese individuals, the IMCL depots are located mainly in fast-twitch muscle fibers and contain high amounts of ceramides and diacylglycerols (DAGs), as well as low concentrations of perilipin 5 (PLIN5) and triacyclglycerols (TAGs). In contrast, in endurance-trained athletes, IMCL droplets are situated primarily in slow-twitch muscle fibers and carry high amounts of TAGs and PLIN5 along with low concentrations of lipid metabolites, such as DAGs and ceramides. The intracellular localization of IMCL depots also differs between endurance-trained athletes and patients with obesity. In particular, in athletes, lipid droplets are located predominantly in close relation to mitochondria and the endoplasmic reticulum, while in obese individuals, they may be found in the sarcolemma, subsarcolemmal, or perinuclear regions. Overall, these differences determine a decrease in muscle oxidative capacity and insulin sensitivity in obese patients in contrast to the athletes, despite similar numbers of IMCL depots within the muscle fibers. Up-oriented arrows (↑) indicate up-regulation. Down-oriented arrows (↓) indicate downregulation. The number of arrows corresponds to the magnitude of the differences.
Third, the rate of TAG synthesis within the myofibers differs between the endurance-trained athletes, insulin resistant obese patients, and lean sedentary individuals, being the highest in the former. These data suggest that high rates of IMCL fat synthesis, which influences intramuscular lipid structuring and localization, can help to prevent the formation of insulin resistance [10][11][50,51]. In relation to lipid droplet partitioning, it was established that the accumulation of triglycerides in the sarcolemma and nucleus was negatively corelated with insulin sensitivity, whereas the localization of IMCL fat depots in close relation to mitochondria and the endoplasmic reticulum was not associated with the development of insulin resistance and appeared to facilitate the oxidation of TAGs [11][14][51,54]. Similar results were obtained in the study by M.C. Devries et al. [15][55] that included 11 obese and 12 lean sedentary women who underwent the 12-week endurance training program. Though the endurance training did not result in weight loss, it led to the increase in muscle oxidative capacity. Additionally, after the completion of the endurance training program, the localization of the IMCL fat depots changed in both groups: the content of IMCL lipid droplets in the subsarcolemmal region reduced, whereas the content of IMCL fat depots in the intermyofibrillar compartment increased. Finally, the saturated vs. unsaturated fatty acid ratio within the IMCL fat depots may also be relevant. Indeed, D. Kahn et al. [14][54] showed that patients with T2DM had the highest content of saturated fatty acids within the myofibers, and this appeared to be significantly associated with insulin resistance.
Interestingly, the degree of lipid accumulation within IMCL depots in obesity may depend on the type of muscle fibers. In their study, N. Umek et al. [16][56] demonstrated that the fast-twitch muscles of obese mice (i.e., gastrocnemius and intermediate plantaris muscles) were characterized by the greatest content of IMCL lipid droplets, while in slow-twitch muscles (soleus muscle), there was no significant lipid accumulation. Furthermore, the authors described an increase in the expression of fast-type myosin heavy chain in the slow-twitch soleus muscles of the obese mice.
In summary, one can conclude that not only the amount, but also the composition and localization of IMCL fat depots within the myofibers may be crucial for the development of insulin resistance and the deterioration of metabolic health in obese patients. Additionally, the capacity of skeletal muscles for lipid oxidation may be the factor determining the association between IMCL fat content and insulin resistance and may depend on muscle composition as well as metabolic flexibility.
3. Skeletal Muscle Composition and Metabolic Flexibility in Obesity
Skeletal muscle metabolism is crucial for total daily energy expenditure; along with the brain, liver, heart, and gastrointestinal tract, skeletal muscles are regarded as major contributors to overall metabolic rate [17][57]. This is due to their participation in resting energy expenditure and ability to increase energy expenditure with physical exercise [18][58]. Depending on metabolic activity, fatigability, mitochondrial content, and movement rates, muscle fibers may be classified into two different types: type I (slow-twitch or oxidative) and type II (fast-twitch or glycolytic) muscle fibers [19][20][59,60]. Type II fibers can be further classified as type IIa fibers, also called fast-oxidative glycolytic fibers or intermediate fibers, and IIx fibers, also termed fast glycolytic fibers. The latter contain high amounts of glycogen and use primarily anaerobic metabolism to generate adenosine triphosphate (ATP), so they are characterized by relatively small numbers of mitochondria [19][21][59,61]. It is believed that the distribution of muscle fiber types within muscle groups varies substantially among individuals and may be influenced by both environmental (nutrition, physical exercises, etc.) and biological factors (age, gender, genetics, etc.), thus determining the individual differences in daily energy expenditure, as well as the individual risk for sustaining a positive energy balance, and, as a consequence, weight gain [18][21][58,61]. Indeed, it was established that patients with obesity have lower proportions of type I muscle fibers characterized by an increased number of mitochondria and, at the same time, greater proportions of type IIx fibers compared with lean individuals [21][22][23][61,62,63]. These data are confirmed by the results of D.A. Reiter et al., suggesting that obesity is associated with reduced muscle energetic efficiency with a predominance of glycolysis over oxidation processes [24][64].
In addition to disturbed proportions of different muscle fibers, mitochondria content and muscle tissue metabolism are also altered in obesity. To define the ability of muscle fibers to use either glucose or fatty acids as a fuel depending on the availability of the substrates, physical activity, and conditional changes in metabolic or energy demand, the term “muscle metabolic flexibility” was proposed [25][65]. This concept, named the Randle Cycle, was first suggested by P.J. Randle et al. in 1963 [26][66] to describe the fuel selection in the transition from fasting to fed states and to characterize its role in insulin sensitivity and metabolic health. Nowadays, the term “metabolic flexibility” is used with respect to physiological adaptability and encompasses several other tissues and metabolic circumstances.
Increasing evidence suggests that an inability to adapt to metabolic stimuli, such as insulin signaling or fatty acid exposure, may lead to the decrease in muscle oxidative capacity characteristic of obesity [27][28][29][67,68,69]. In their study including 28 juvenile Iberian pigs fed either a control or a high-fructose, high-fat (HFF) diet for 10 weeks, H.C. Spooner et al. [30][70] demonstrated that the HFF diet resulted in decreased IMCL fat content and in the formation of less oxidative skeletal muscle phenotype, reflecting the disturbed ability of skeletal muscles to use lipids as a fuel. These changes were similar to the effects of detraining or muscle atrophy, indicating the reduced capacity of muscles to perform endurance-type exercises [31][71]. These effects may be followed by a long-term decrease in muscle mass and strength. Indeed, G.V. Hernandez et al. [32][72] showed that there was a reduction in plasma creatinine levels in juvenile Iberian pigs fed an HFF diet during 10 weeks, suggesting a tendency towards deterioration in muscle growth in this animal model.
Disturbed muscle oxidative capacity is believed to be associated with both changes in the proportions of muscle fiber types and mitochondrial dysfunction (Figure 23). It was shown that obesity is accompanied by a decrease in mitochondrial surface area by, on average, 20–60%, as well as by the substantially lower expression of mitochondrial genes and metabolites [27][28][33][67,68,73]. Accumulating data suggest that obesity has an unfavorable impact on the activity of the mitochondrial electron transport chain and oxidative phosphorylation, as well as stimulating the production of reactive oxygen species (ROS), facilitating mitochondrial fragmentation and mutations in mitochondrial DNA [34][74]. This may be due to mitochondria lipid overload, which causes incomplete β-oxidation and, consequently, the accumulation of lipid intermediates, such as ceramides. It was shown that ceramides could affect membrane potential, electron transport, and mitochondrial morphology, resulting in mitochondrial dysfunction [34][74]. In these settings, the expression of peroxisome proliferator-activated receptor–gamma coactivator-1alpha (PGC-1α), known to be involved in mitochondrial biogenesis, and to exert antioxidant action is being downregulated in order to prevent further mitochondrial function deterioration due to the accumulation of damaged mitochondrial DNA [35][75]. PGC-1α is also known to regulate lipid oxidation, energy homeostasis, and insulin sensitivity. In particular, it was demonstrated that the inactivation of PGC-1α expression in skeletal muscles in mice led to a shift from oxidative type I and IIa muscle fibers toward type IIx and IIb glycolytic muscle fibers [36][76]. On the contrary, elevated levels of PGC-1α in the skeletal muscles of transgenic mice were shown to protect against age-related obesity and T2DM [37][77]. The results of these studies reflect the important role of PGC-1α in promoting effective muscle energy metabolism and regulating energy balance in the body.
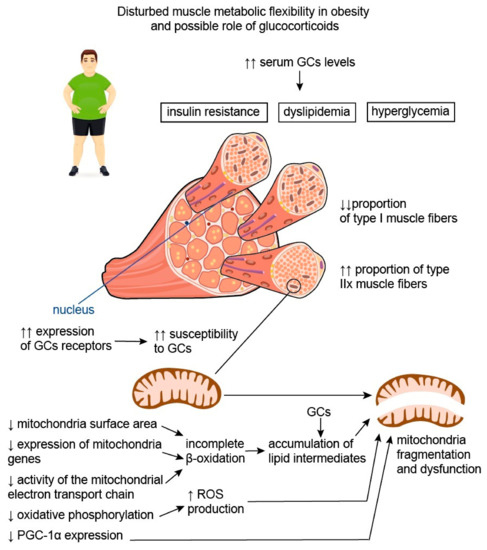
Figure 23. Disturbed muscle metabolic flexibility in obesity and possible role of glucocorticoids. Disturbed muscle oxidative capacity is believed to be associated with both the change in the proportions of muscle fiber types and mitochondrial dysfunction. Patients with obesity have lower proportions of type I muscle fibers characterized by an increased number of mitochondria and, at the same time, greater proportions of type IIx fibers compared with lean individuals. Thus, obesity is associated with reduced muscle energetic efficiency with a predominance of glycolysis over oxidation processes. In addition, obesity is characterized by the decrease in mitochondrial surface area, substantially lower expression of mitochondria genes, and reduced activity of the mitochondrial electron transport chain. This causes incomplete β-oxidation and, consequently, the accumulation of lipid intermediates, capable of affecting mitochondrial morphology and function. Disturbed oxidative phosphorylation leads to the increased production of reactive oxygen species (ROS), which facilitate mitochondrial fragmentation. In these settings, the expression of peroxisome proliferator-activated receptor–gamma coactivator-1alpha (PGC-1α), which is initially lower in type IIx fibers compared to type I fibers, is being downregulated, further aggravating mitochondrial damage and dysfunction. It is well known that serum glucocorticoid (GC) levels are elevated in individuals with obesity, and this contributes to the development of insulin resistance, hyperglycemia, and dyslipidemia. Moreover, GCs appear to be involved in the disturbance of muscle metabolic flexibility in obesity. It is established that type IIx muscle fibers, being the predominant muscle fiber type in patients with obesity, are characterized by greater susceptibility to GCs, possibly due to the greater expression of GC receptors. Therefore, the negative effects of GCs on skeletal muscle may be more pronounced in patients with obesity. Additionally, GCs are known to increase the accumulation of lipid intermediates in skeletal muscle, thus facilitating mitochondria dysfunction and impairment of muscle energy metabolism. Up-oriented arrows (↑) indicate up-regulation. Down-oriented arrows (↓) indicate downregulation. The number of arrows corresponds to the magnitude of the differences.
Interestingly, weight loss does not necessary lead to an increase in mitochondrial number and the recovery of mitochondrial function. In their study, E.V. Menshikova et al. [38][78] assessed the impact of weight loss through calorie restriction (n = 7) or moderate-intensity exercise (n = 10) on skeletal muscle mitochondrial content, mitochondrial enzyme activities, and insulin resistance in 17 overweight or obese individuals aged 60–75 years. Interestingly, although both interventions resulted in weight loss and improved insulin sensitivity, only physical activity was associated with an increase in mitochondria content and the activity of enzymes involved in mitochondrial electron transport chain and fatty acid oxidation within the skeletal muscle.
4. Myokines in Obesity
4.1. Irisin
A recent meta-analysis concluded that circulating irisin levels were higher in obese individuals compared to healthy controls, though they appeared to be affected by ethnicity and age [39][79]. Irisin is produced by the proteolytical cleavage of FNDC5 during muscle contraction and physical exercise. It is a PGC-1α-dependent myokine, able to increase the browning of white adipose tissue by increasing the expression of uncoupling protein 1 (UCP-1). Adipose tissue and liver are also able to secret this molecule in small amounts [40][80]. The elevation in circulating irisin levels in patients with obesity without T2DM may be explained by the existence of obesity-induced metabolic dysfunction, particularly insulin resistance. In this case elevated irisin levels may represent an attempt to maximize glucose uptake by skeletal muscle and prevent hyperglycemia [41][42][81,82]. Interestingly, it was shown that after the onset of T2DM, the expression of FNDC5 in the muscle of treatment-naïve patients in vivo was reduced by ~15%. However, in in vitro experiments, myotubes isolated from these patients were capable of expressing FNDC5 in greater amounts than myotubes taken from lean individuals [41][81]. In contrast, it was shown that the irisin secretion from adipocytes in patients with obesity is lower than in lean controls [41][43][81,83]. However, as the body fat mass is substantially increased in patients with obesity, the overall levels of irisin secreted by adipose tissue in patients with obesity may be quite similar or even superior to those in lean individuals.
It is worth noting that plasma irisin levels may be significantly decreased following weight loss due to bariatric surgery. This effect may be explained by the decrease in fat-free mass during weight loss and, as a consequence, lower FNDC5 mRNA expression in skeletal muscle. In support of this suggestion, the irisin concentration returned to baseline levels in patients who regained the original weight [44][45][84,85]. However, the contribution of adipose tissue to the increase in total irisin levels upon weight regain cannot be excluded. These data also confirm the notion that an increase in irisin levels in patients with obesity may mirror metabolic disturbances characteristic of these patients, and may be directed at the compensation of these abnormalities [46][20].
According to J. Jia et al. [39][79], irisin levels were higher in young participants compared to older ones, possibly due to the age-related decline in muscle function. These authors further found out that irisin levels were higher in obese individuals compared to controls when they were from Africa, while no significant differences were described in European, Asian, or American populations. These inconsistencies may result from genetic factors capable of influencing the levels of irisin, as well as from the differences in body mass index (BMI) criteria used to diagnose overweight and obesity in the Asian population.
Moreover, it was shown that irisin expression may be associated with some anti-inflammatory markers [47][86]. In particular, irisin was able to suppress the expression of pro-inflammatory cytokines, nuclear factor-kappa B (NF-κB), TNF-α, and IL-6. In addition, irisin reduced the monocyte chemoattractant protein 1 (MCP-1) expression in cultured adipocytes with the subsequent attenuation of macrophage migration in the presence of irisin. Irisin was also able to induce the transition from the M1 (pro-inflammatory) macrophage phenotype to the M2 (anti-inflammatory) phenotype [47][48][86,87].
Therefore, taking into account the above-mentioned information, irisin seems to play a protective role in the development of metabolic dysfunction in obesity directed at the attenuation of insulin resistance and inflammation, as well as at the improvement of energy metabolism. However, its concentration may be decreased in case of sarcopenic obesity.
4.2. Myostatin
Myostatin, also known as growth and differentiation factor 8 (GDF8), is a member of the TGF-β superfamily. It is expressed predominantly in skeletal muscle, and its secretion and production are inhibited during muscle contraction and exercise [49][88]. Except for being involved in muscle atrophy [50][89], myostatin is regarded as a potential modulator of metabolic homeostasis acting through the regulation of adipose tissue function [51][52][90,91]. With regard to its effects, myostatin may be considered an irisin antagonist. For instance, it was demonstrated that the inhibition of myostatin was able to decelerate the development of insulin resistance and obesity in mice fed a high-fat diet, possibly due to the intensification of lipolysis and mitochondrial lipid oxidation in liver and adipose tissue. Moreover, it was shown that the inactivation of myostatin resulted in the formation of brown adipose tissue in the white adipose tissue of myostatin knockout mice [53][92]. This mouse line was also characterized by the upregulation of the expression and phosphorylation of adenosine monophosphate (AMP)-activated protein kinase (AMPK) in muscle, leading to the activation of PGC-1α and FNDC5 [54][93]. A study by M. Amor et al. reported an increase in serum myostatin concentrations in patients with obesity compared to lean individuals with no differences in myostatin expression in adipose tissue [51][90]. The authors showed that circulating myostatin levels were positively correlated with insulin resistance, while muscle myostatin gene expression was strongly associated with the expression of metabolic genes, particularly the insulin receptor substrate-1 (IRS-1) gene and sterol regulatory element binding transcription factor 1 (SREBTF1) gene [51][90]. Interestingly, the inhibition of myostatin expression in mice was accompanied by an improvement in insulin sensitivity: myostatin knockout mice were even more insulin sensitive than wild-type mice, suggesting that myostatin’s effect on insulin signaling may be independent of muscle mass [55][94]. Accordingly, physical exercises, bariatric surgery [56][95], and a calorie-restricted Dietary Approaches to Stop Hypertension (DASH) diet [57][96], due to their well-known beneficial effects on insulin sensitivity, were demonstrated to suppress myostatin production in skeletal muscles.
Accumulating data suggest that myostatin is expressed in the human reproductive system and may have different functions. For instance, myostatin is involved in the regulation of steroidogenesis, cell proliferation, the formation of extracellular matrix, and gonadotrophin responsiveness, thus influencing the process of cell differentiation in emerging follicles [58][97]. In addition, it is suggested that myostatin may be involved in the pathogenesis of some ovarian diseases, particularly polycystic ovary syndrome and ovarian hyperstimulation syndrome [59][60][98,99].
In view of the important role of myostatin in muscle atrophy, sarcopenia, and fat accumulation, this substance represents a promising direction for future research with respect to aging and obesity being associated with the growing incidence of chronic non-communicable diseases.