Your browser does not fully support modern features. Please upgrade for a smoother experience.
Please note this is a comparison between Version 1 by Juan José Ramos-Rodríguez and Version 2 by Dean Liu.
Amyotrophic lateral sclerosis (ALS) is a fatal neurodegenerative disease with unknown etiology. Many metabolic alterations occur during ALS progress and can be used as a method of pre-diagnostic and early diagnosis. Dyslipidemia is one of the physiological changes observed in numerous ALS patients.
- amyotrophic lateral sclerosis
- lipids
- meta-analysis
- cholesterol
1. Included Studies and Lipid Levels in Control Cohort and ALS Patients
The basic data collection from the systematic review is shown in Table 1. As previously mentioned, 19 studies were selected in total. The selected articles were published between 1989 and 2022 (Table 1 and Table 2). There was demographic variety in the studies selected (European, American, and Asiatic). In some studies, the control population was not used (D/N). The type of article and the study are detailed in Table 1 and Table 2. The average ages of the control population and the ALS patients at the beginning of the disease did not show differences (58.7 and 59.6 years old, respectively). Most patients had non-bulbar (or spinal) symptom onset (71.1%), in comparison with the percentage of patients with bulbar symptom onset (28.9%). BMI was compared in order to more reliably compare the blood lipid levels between the control population and the ALS patients. Thus, the possible relationship between elevated serum lipid levels and the degree of obesity was eliminated. The average BMI was within the normal range and did not show a difference between the two populations (24.8 in the healthy population and 24.5 in the ALS patients) (Table 2).
Table 1. Characteristics of studies included in the systematic review. N/D: not available value.
| Cohorte | ||||||||
|---|---|---|---|---|---|---|---|---|
| Site of Symptom Onset | BMI | |||||||
| Author | Year | Location | Article Type | N Control |
N ALS | |||
| Author | Year | Location | Age Control | Age ALS | Bulbar | Nonbulbar | Control | ALS |
| Ingre et al. [1][46] | 2020 | Sweden | Clinical trial | Ingree et al. [1] | N/D | [46] | 99 | |
| 2020 | Sweden | N/D | 65.7 | 38 | 61 | N/D | 24.38 | Mariosa et al. [2 |
| 59 | ||||||||
| 64 | ||||||||
| 90 | ||||||||
| 205 | ||||||||
| 26 | ||||||||
| 25 | ||||||||
| 58.7 ± 1.5 | 59.6 ± 1.3 | 28.9% | 71.1% | 24.8 ± 0.6 | 24.5 ± 0.5 | |||
In addition, the serum lipid levels were analyzed in the healthy population and the ALS patients in each of the studies selected (Table 3). The TC, LDL, HDL, and TG levels (mmol L−1) were extracted and converted from each of the manuscripts. Only studies showing lipid levels in mg·dL−1 or mmol L−1 were used in the comparison between both populations. So, 1 article was excluded in order to compare the serum lipid levels between the healthy population and ALS patients due to the lack of data in the manuscript. The data shown in Table 3 were used to perform the mean and standard error calculations in each population. No significant differences were obtained in any of the lipid levels (TC: p = 0.760; LDL: p = 0.598; HDL: p = 0.792; TG: p = 0.654) between the control cohort and the ALS patients. Nevertheless, an upward trend was observed in the ALS lipid levels (TC: 5.35 ± 0.2 mmol L−1; LDL: 3.15 ± 0.1 mmol L−1; HDL: 1.38 ± 0.1 mmol L−1 and TG: 2.45 ± 0.2 mmol L−1) compared with those of the healthy population (TC: 5.18 ± 0.3 mmol L−1; LDL: 3.08 ± 0.2 mmol L−1; HDL: 1.41 ± 0.1 mmol L−1 and TG: 2.33 ± 0.3 mmol L−1). These results could support the hyperlipidemia serum in ALS disease described by other authors. The mean survival data were extracted from each article and are shown in Table 3. The mean survival value was 31.28 months (~2.6 years) from the diagnosis of the disease. This value is relatively low because diagnosis of the disease is performed when advanced symptoms appear. The results presented in the table show that there is no relationship between increased lipid levels and a high survival rate.
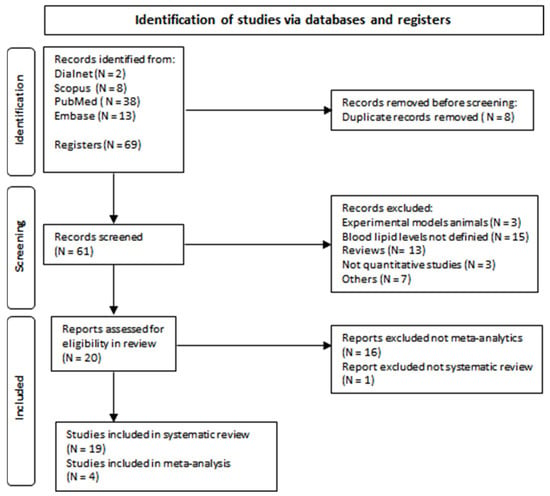
Figure 1. Flow diagram of document selection process.
Table 3. Serum lipid (TC, LDL, HDL, and TG in mg·dL−1) levels in control population and ALS patients. Mean values are shown in the last row; the values represent the mean and standard error. The Student’s t-test was performed. N/D: not available value.
| Total Cholesterol (mmol·L−1) | Low-Density Protein (mmol·L−1) | High-Density Protein (mmol·L−1) |
Triglycerides (mmol·L−1) | |||||||||||||||||||||
|---|---|---|---|---|---|---|---|---|---|---|---|---|---|---|---|---|---|---|---|---|---|---|---|---|
| Author | TC Control |
TC ALS Patients | LDL Control |
LDL ALS Patients | HDL Control | HDL ALS Patients |
TG Control |
TG ALS Patients | Mean Survival (Months) |
|||||||||||||||
| Ingre et al. [1][46] | N/D | 5.46 | N/D | 3.14 | N/D | 1.64 | N/D | 1.54 | 13.72 | |||||||||||||||
| ][47] | 2017 | Sweden | Prospective cohort study | N/D | 623 | |||||||||||||||||||
| Mariosa et al. [ | Bjornevik et al. [3] | |||||||||||||||||||||||
| Mariosa et al. [2][47] | 2017 | 2][ | Sweden | 47 | N/D | ] | N/D | 5.4867 | N/D | N/D | N/D | 3.59 | 3.69N/D | N/D | 1.52 | N/D | N/D | 12.00 | [23] | 2021 | USA | Randomized controlled trials | 275 | 547 |
| Bjornevik et al. [3][23] | 2021 | USA | 64.6 | 69.4 | N/D | N/D | ||||||||||||||||||
| Chelstowka et al. | 26.9 | [4] | 26.2 | [48] | N/D | 5.37 | N/D | 3.28 | N/D | 1.34 | N/D | Chelstowka et al. [4][48] | 2021 | Poland | Clinical studies | N/D | 203 | |||||||
| 3.50 | 19.92 | Chelstowka et al. [4][48] | 2021 | Poland | N/D | 56 | N/D | N/D | N/D | 24.6 | ||||||||||||||
| Dorst et al. [5][31] | 4.70 | 6.00 | 4.91 | 3.87 | N/D | 1.29 | 1.40 | Dorst et al. [5][31] | ||||||||||||||||
| Dorst et al. | 2011 | [5] | Germany | [Clinical trial | N/D | 488 | ||||||||||||||||||
| 1.77 | 51.00 | 31] | 2011 | Germany | ||||||||||||||||||||
| Ikeda et al. [6][33 | N/D | 57.6 | 89 | 398 | N/D | 25.4 | ] | 5.33 | 5.47 | 3.21 | 3.34 | 1.49 | 1.49 | 3.06 | 3.30 | 23.70 | Ikeda et al. [6][33] | 2012 | Japan | |||||
| Ikeda et al. [6][33 | ||||||||||||||||||||||||
| Won Yang et al. [7][ | Clinical trial | ] | 92 | 92 | ||||||||||||||||||||
| 49 | 2012 | Japan | 59.2 | 58.8 | 10 | ] | 5.11 | 4.87 | 3.1182 | 2.99 | 1.20 | 1.22 | 4.04 | 3.28 | N/D | Won Yang et al. [7][49] | ||||||||
| Mandrioli et al. | 2013 | Korea | Clinical trial | [8 | 99 | 54.14 | ||||||||||||||||||
| ][ | Mandrioli et al. [8][50] | 2017 | Italy | Clinical studies: retrospective cohort study | N/D | 275 | ||||||||||||||||||
| ][49] | 2013 | Korea | 52.5 | 54.1 | N/D | N/D | N/D | N/D | ||||||||||||||||
| Mandrioli et al. [8][50] | 2017 | Italy | N/D | 65.2 | 83 | 30.2 | N/D | 24.5 | Dupuis et al. [9][32] | |||||||||||||||
| Dupuis et al. [ | 2008 | 9 | France | Randomized controlled trials: retrospective cohort study | ] | 286 | [32] | 2008 | France369 | N/D | 57.5 | 92.2 | 276.7 | N/D | 2021 | UK | Longitudinal clinical studies: prospective population cohort | 502,409 | 343 | |||||
| Chio et al. [15][29] | 2009 | Italy | Clinical studies | 658 | 658 | |||||||||||||||||||
| 24.6 | Nakatsuji et al. [16][54] | 2017 | Japan | Clinical trial | 483 | 55 | ||||||||||||||||||
| 22.8 | 22.6 | |||||||||||||||||||||||
| Won Yang et al. [7 | ||||||||||||||||||||||||
| 5.50 | 3.90 | 3.20 | 1.45 | 1.55 | N/D | N/D | N/D | |||||||||||||||||
| 5.18 ± 0.3 | 5.35 ± 0.2 | 3.08 ± 0.2 | 3.15 ± 0.1 | 1.41 ± 0.1 | 1.38 ± 0.1 | 2.33 ± 0.3 | 2.45 ± 0.2 | 31.28 ± 7.46 | ||||||||||||||||
2. Characteristics of Studies Included in Meta-Analysis
Only four studies were included for meta-analysis because they showed correlating data between the ALS-FRS level and the blood lipid levels. The data collected from the manuscripts used for meta-analysis had different origins: two studies were conducted in Japan, one in China, and one in Australia. The years of publication were between 2012 and 2018. In total, the entire sample comprised 597 ALS patients. According to the size of the cohort and the country of publication, 24.6% of the patients were Japanese, 69.2% were Chinese, and the remaining 6.19% were Australian.
3. Clinical Data
The ALS-FR score values were used to determine the initial disease progression. The ALS-FRS mean score was 36.6 ± 2.8 at the beginning of the disease. Life span was 37.8 ± 7.9 months (~3.15 years) after ALS was diagnosed. To strengthen the our meta-analysis study and exclude the possibility that the differences obtained were due to changes in baseline lipid levels, researchers awe analyzed whether there was a significant difference in the TC and TG values between the control and the ALS subjects. The mean TC (Control: 208.7 ± 1.7 mg·dL−1 and 206.2 ± 1.5 mg·dL−1; p = 0.566) and TG (Control: 120.3 ± 4.2 mg·dL−1 and 147.6 ± 7.4 mg·dL−1; p = 0.159) levels were not statistically significant in the ALS patients compared to those of the control group. These data are represented in Table 4 and Table 5. However, an interesting increase in TG levels, but not in TC levels, was observed in the ALS patients when compared with those of the control population.
Table 4. Basic data of studies included in meta-analysis. * Last row values represent the mean and standard error and total bulbar and non-bulbar symptoms onset. N/D: not available value.
| Author |
|---|
Characteristics of studies included in meta-analysis. Last row values represent the mean and standard error and total bulbar and non-bulbar symptoms onset. N/D: not available value.
| Location | Total Cholesterol (mmol·L−1 | Participants (ALS/Control) | ) | Triglycerides (mmol·L−1 | Age (Years) (ALS/Control) |
Symptom Onset (Bulbar/Nonbulbar) | ) | BMI (ALS/Control) |
||||||||||||||||||
|---|---|---|---|---|---|---|---|---|---|---|---|---|---|---|---|---|---|---|---|---|---|---|---|---|---|---|
| Author | TC Control | TC ALS | TG Control | TG ALS | ALS-FRS | |||||||||||||||||||||
| Ikeda et al., 2012 [6][33] | Japan | 92/92 | 58.8/59.2 | 10/82 | 22.6/22.8 | |||||||||||||||||||||
| Huang et al., 2015 [10][51 | ||||||||||||||||||||||||||
| Ikeda et al., 2012 [6]33] | 5.33 | 5.47 | 3.06 | 3.30 | 40.3 | |||||||||||||||||||||
| ] | China | 413/400 | ||||||||||||||||||||||||
| Huang et al., 2015 [10][51] | 5.31 | 5.24 | 51.8/51.4 | N/D | 21/21.5 | |||||||||||||||||||||
| 3.14 | 3.30 | 31.2 | Ahmed et al., 2018 [11][45] | |||||||||||||||||||||||
| Ahmed et al., 2018 [11][ | Australia | 45 | 37/32 | ] | 5.51 | 6.6055.9/64.7 | 9/28 | 25.7/24.9 | 1.00 | 1.90 | 38.5 | Nakatsuji et al., 2017 [16][54] | Japan | 55/483 | 51.1/53.2 | N/D | 22.7/24.2 | |||||||||
| [ | ||||||||||||||||||||||||||
| Nakatsuji et al., 2017 [16][54] | 5.56 | 5.3 | 3.66 | 3.76 | N/D | * 54.4 ± 0.9/57.1 ± 1.5 | 19/110 | 2.71 ± 0.5 | 3.06 ± 0.4 | 36.6 ± 2.8 | 50] | N/D | 5.12 | N/D | 3.36 | N/D | 1.29 | N/D | 2.59 | N/D | ||||||
| Dupuis et al. [9][32] | 2.10 | 2.50 | 1.20 | 1.60 | 0.60 | 0.60 | 1.30 | 1.30 | N/D | |||||||||||||||||
| Huang et al. [10][51] | 2014 | China | Clinical studies | 400 | ||||||||||||||||||||||
| Huang et al. | 413 | |||||||||||||||||||||||||
| [10][51] | 2014 | China | 51.4 | 51.8 | N/D | N/D | 21.5 | 21 | ||||||||||||||||||
| Huang et al. [10][51] | 5.31 | 5.24 | 2.81 | 2.80 | 1.36 | 1.20 | 3.14 | 3.30 | 21.80 | |||||||||||||||||
| Ahmed et al. [11][45] | 5.51 | 6.60 | N/D | N/D | 1.90 | 1.50 | 1.00 | 1.90 | 20.40 | Ahmed et al. [11][45] | 2018 | |||||||||||||||
| Ahmed et al. | Australia | [11] | Clinical studies | [ | 32 | 37 | ||||||||||||||||||||
| 45] | 2018 | Australia | ||||||||||||||||||||||||
| Dedic et al. [12][ | 64.7 | 55.9 | 9 | 30] | N/D | 5.80 | N/D | 2.9528 | 24.9 | 25.7 | N/D | 1.37 | N/D | 1.87 | 50.52 | Dedic et al. [12][30] | 2013 | Serbia | Randomized controlled trials: retrospective cohort study | N/D | 82 | |||||
| Dedic et al. [12][30] | 2013 | Serbia | N/D | 53.7 | 30 | 52 | ||||||||||||||||||||
| Nakamura et al. [13] | N/D | 26.7 | [52 | Nakamura et al. [13][52] | ||||||||||||||||||||||
| ] | N/D | N/D | N/D | 2.97 | N/D | 1.63 | N/D | 2.82 | N/D | Nakamura et al. | 2022 | [13] | Japan | [Clinical studies: retrospective cohort study | N/D | 78 | ||||||||||
| 52] | 2022 | Japan | N/D | 71 | 26 | |||||||||||||||||||||
| Thompson et al. [14] | 52 | [53 | N/D | ] | 21.7 | 5.65 | 5.64 | 3.52 | 3.54 | 1.40 | 1.30 | 1.48 | 1.67 | 14.63 | Thompson et al. [14][53] | |||||||||||
| Thompson et al. [14][53] | 2021 | UK | 58 | 62 | N/D | N/D | ||||||||||||||||||||
| Chio et al. [15][29] | 5.38 | 5.46 | 3.25 | 26.7 | 3.33 | 1.54 | 1.53 | 27.2 | ||||||||||||||||||
| 3.05 | 2.98 | N/D | Chio et al. [15][29] | 2009 | Italy | 62.7 | 62.9 | 201 | ||||||||||||||||||
| Nakatsuji et al. [16][54] | 5.56 | 457 | 24.8 | 25.1 | 5.30 | N/D | N/D | 1.45 | 1.54 | |||||||||||||||||
| 3.66 | 3.76 | 85.20 | Nakatsuji et al. [16][54] | 2017 | Japan | |||||||||||||||||||||
| Ballantyne et al. [17][55] | N/D | 53.2 | 51.1 | N/D | 5.26 | N/D | 24.2 | 22.7 | N/D | 3.05 | N/D | 1.02 | N/D | 2.65 | N/D | Ballantyne et al. [17][55] | 1989 | USA | Prospective, randomized clinical trial | N/D | ||||||
| Ballantyne et al. [17][55 | ||||||||||||||||||||||||||
| Wuolikainen et al. | 39 | |||||||||||||||||||||||||
| ] | [18] | 1989 | USA | N/D | 50 | N/D | N/D | N/D | [56 | N/D | ] | 5.80 | 6.00 | 3.20 | 3.40 | 1.75 | 1.85 | 1.25 | 1.10 | N/D | Wuolikainen et al. [18][56] | 2014 | USA | Clinical trial | 40 | 52 |
| Wuolikainen et al. [18][56] | 2014 | USA | 61.7 | 58.7 | N/D | |||||||||||||||||||||
| Sutedja et al. | N/D | [19][57] | 25.3 | 23.8 | 5.85 | Sutedja et al. [19][57] | 2015 | The Netherlands | Randomized controlled trials | 2100 | 303 | |||||||||||||||
Table 2. Basic data of studies included in the systematic review. N/D: not available value.
| Sutedja et al. |
| [ |
| 19 |
Table 5.
| 5.42 ± 0.1 |
| 5.65 ± 0.3 |
| ] |
| [ |
| 57 |
| ] |
| 2015 |
| The Netherlands |
4. Meta-Analysis for ALS-FRS Score and Lipid Levels
Four random-effect meta-analyses were performed. The basic data are shown in Table 4. Each meta-analysis analyzed the correlation between the TG, LDL, HDL, and TC levels and ALS progression (ALS-FRS score). The data are shown in Table 5. Three studies were used to correlate the TC and TG levels with the ALS-FRS scores. Moreover, two of them were used to perform the meta-analysis of the HDL and LDL levels with the ALS-FRS score.
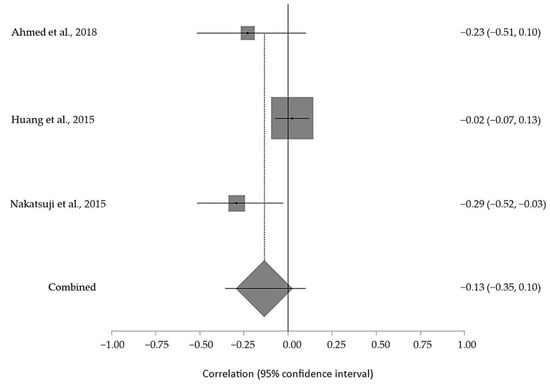
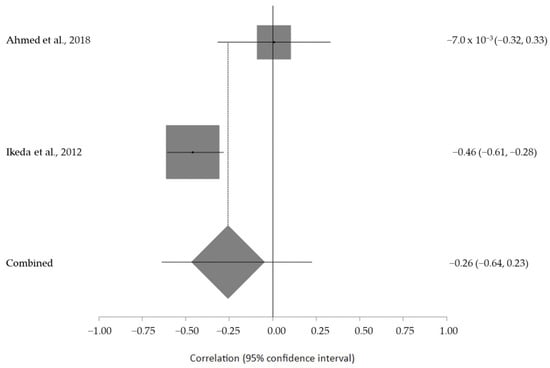
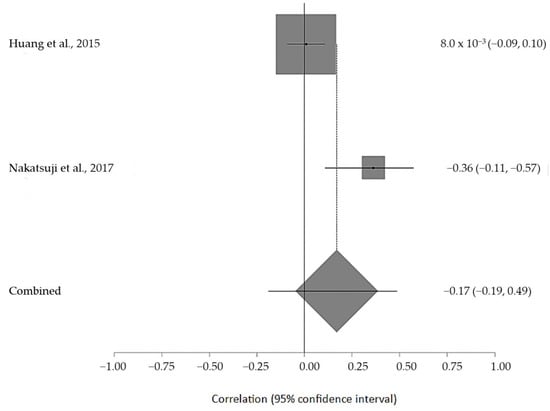
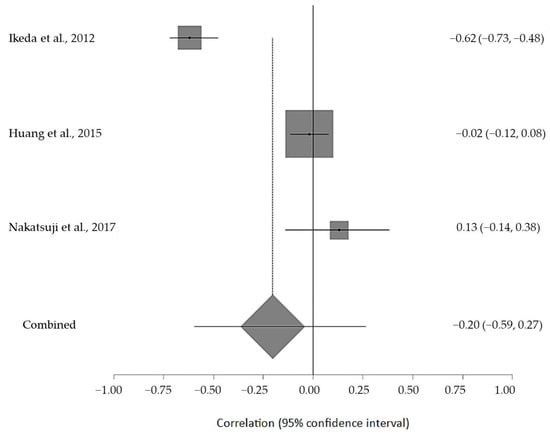
The estimated meta-analytical correlation of the ALS-FRS value with TG was r = −0.13 (95% CI −0.35, 0.10. p > 0.05; n = 505) (Figure 2); with LDL, it was r = −0.26 (95% CI 0.64, 0.23. p > 0.05; n = 129) (Figure 3); with HDL, it was r = 0.17 (95% CI −0.19, 0.49. p < 0.05; n = 468) (Figure 4); and, finally, with TC, it was r = −0.20 (95% CI −0.59, 0.27. p > 0.05) (n = 560 ALS patients) (Figure 5). I2 was higher than 50%, reflecting a high degree of heterogeneity in all the meta-analyses.
No study was eliminated after the sensitivity analysis, and the value of the Egger test showed that there was no publication bias. As one of the main parameters used in the meta-analysis was the ALS-FRS scale, the size of the control cohort (healthy individuals) was not considered for theour meta-analysis study.