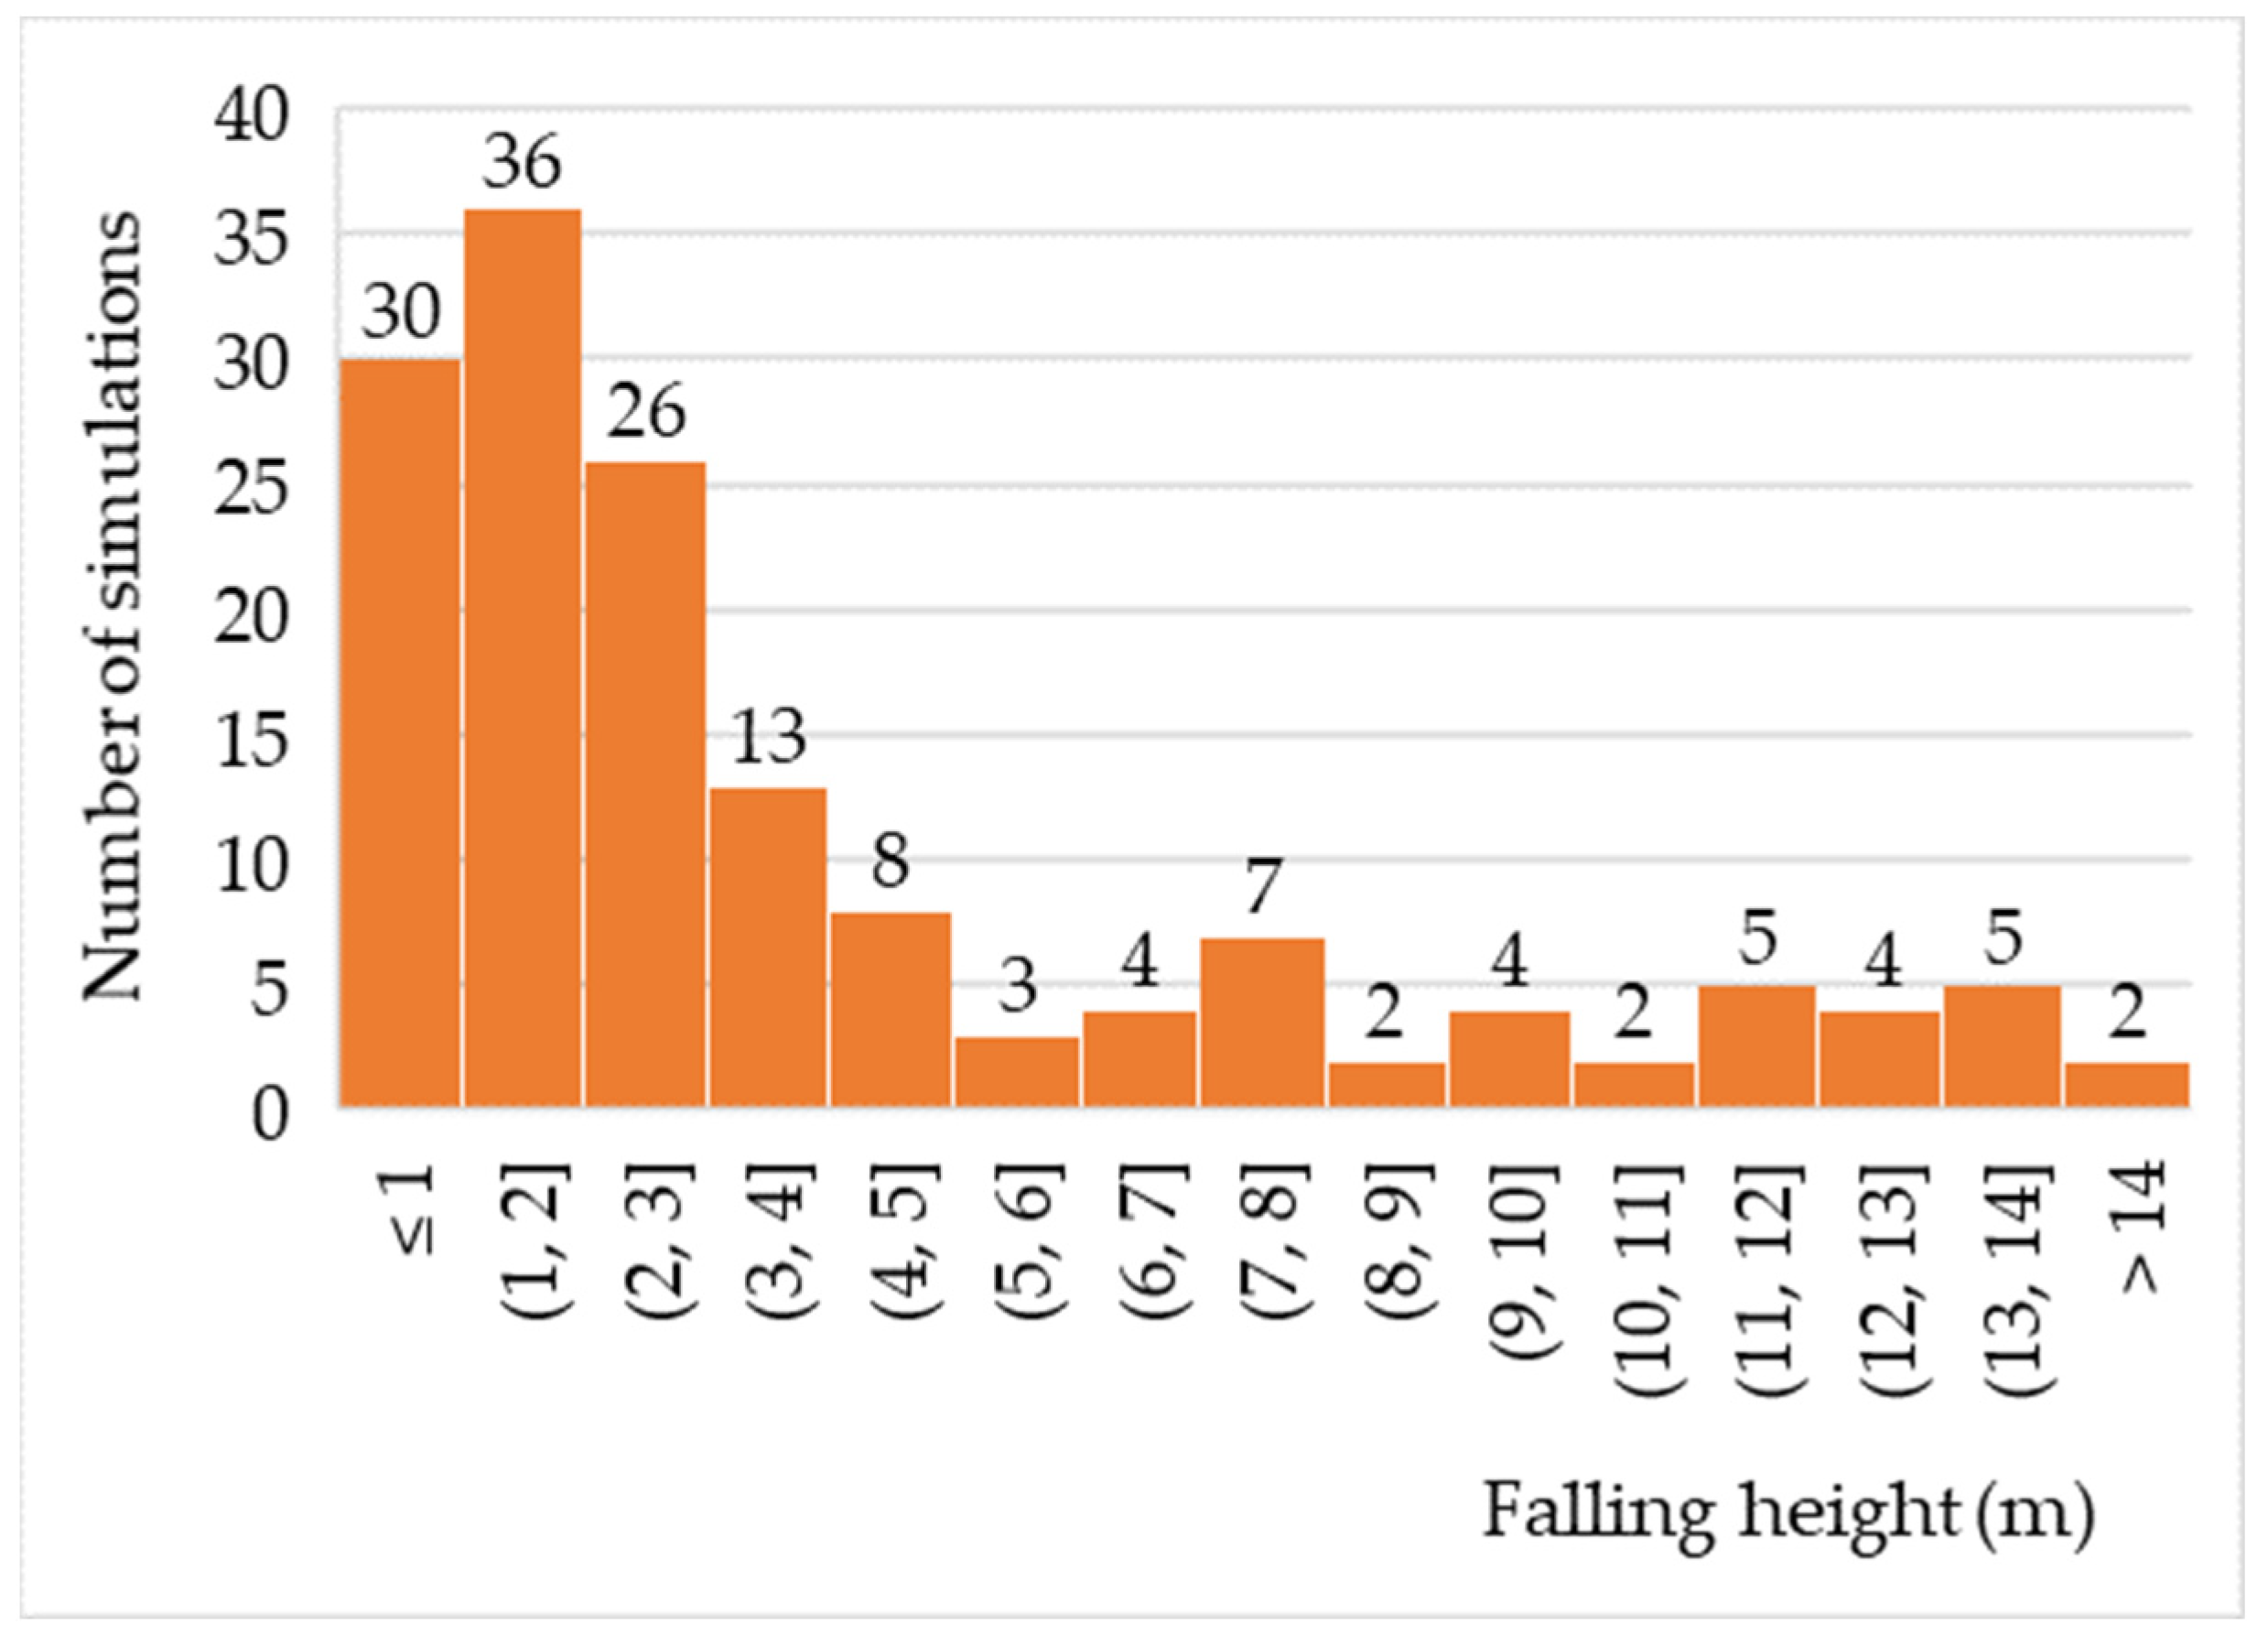
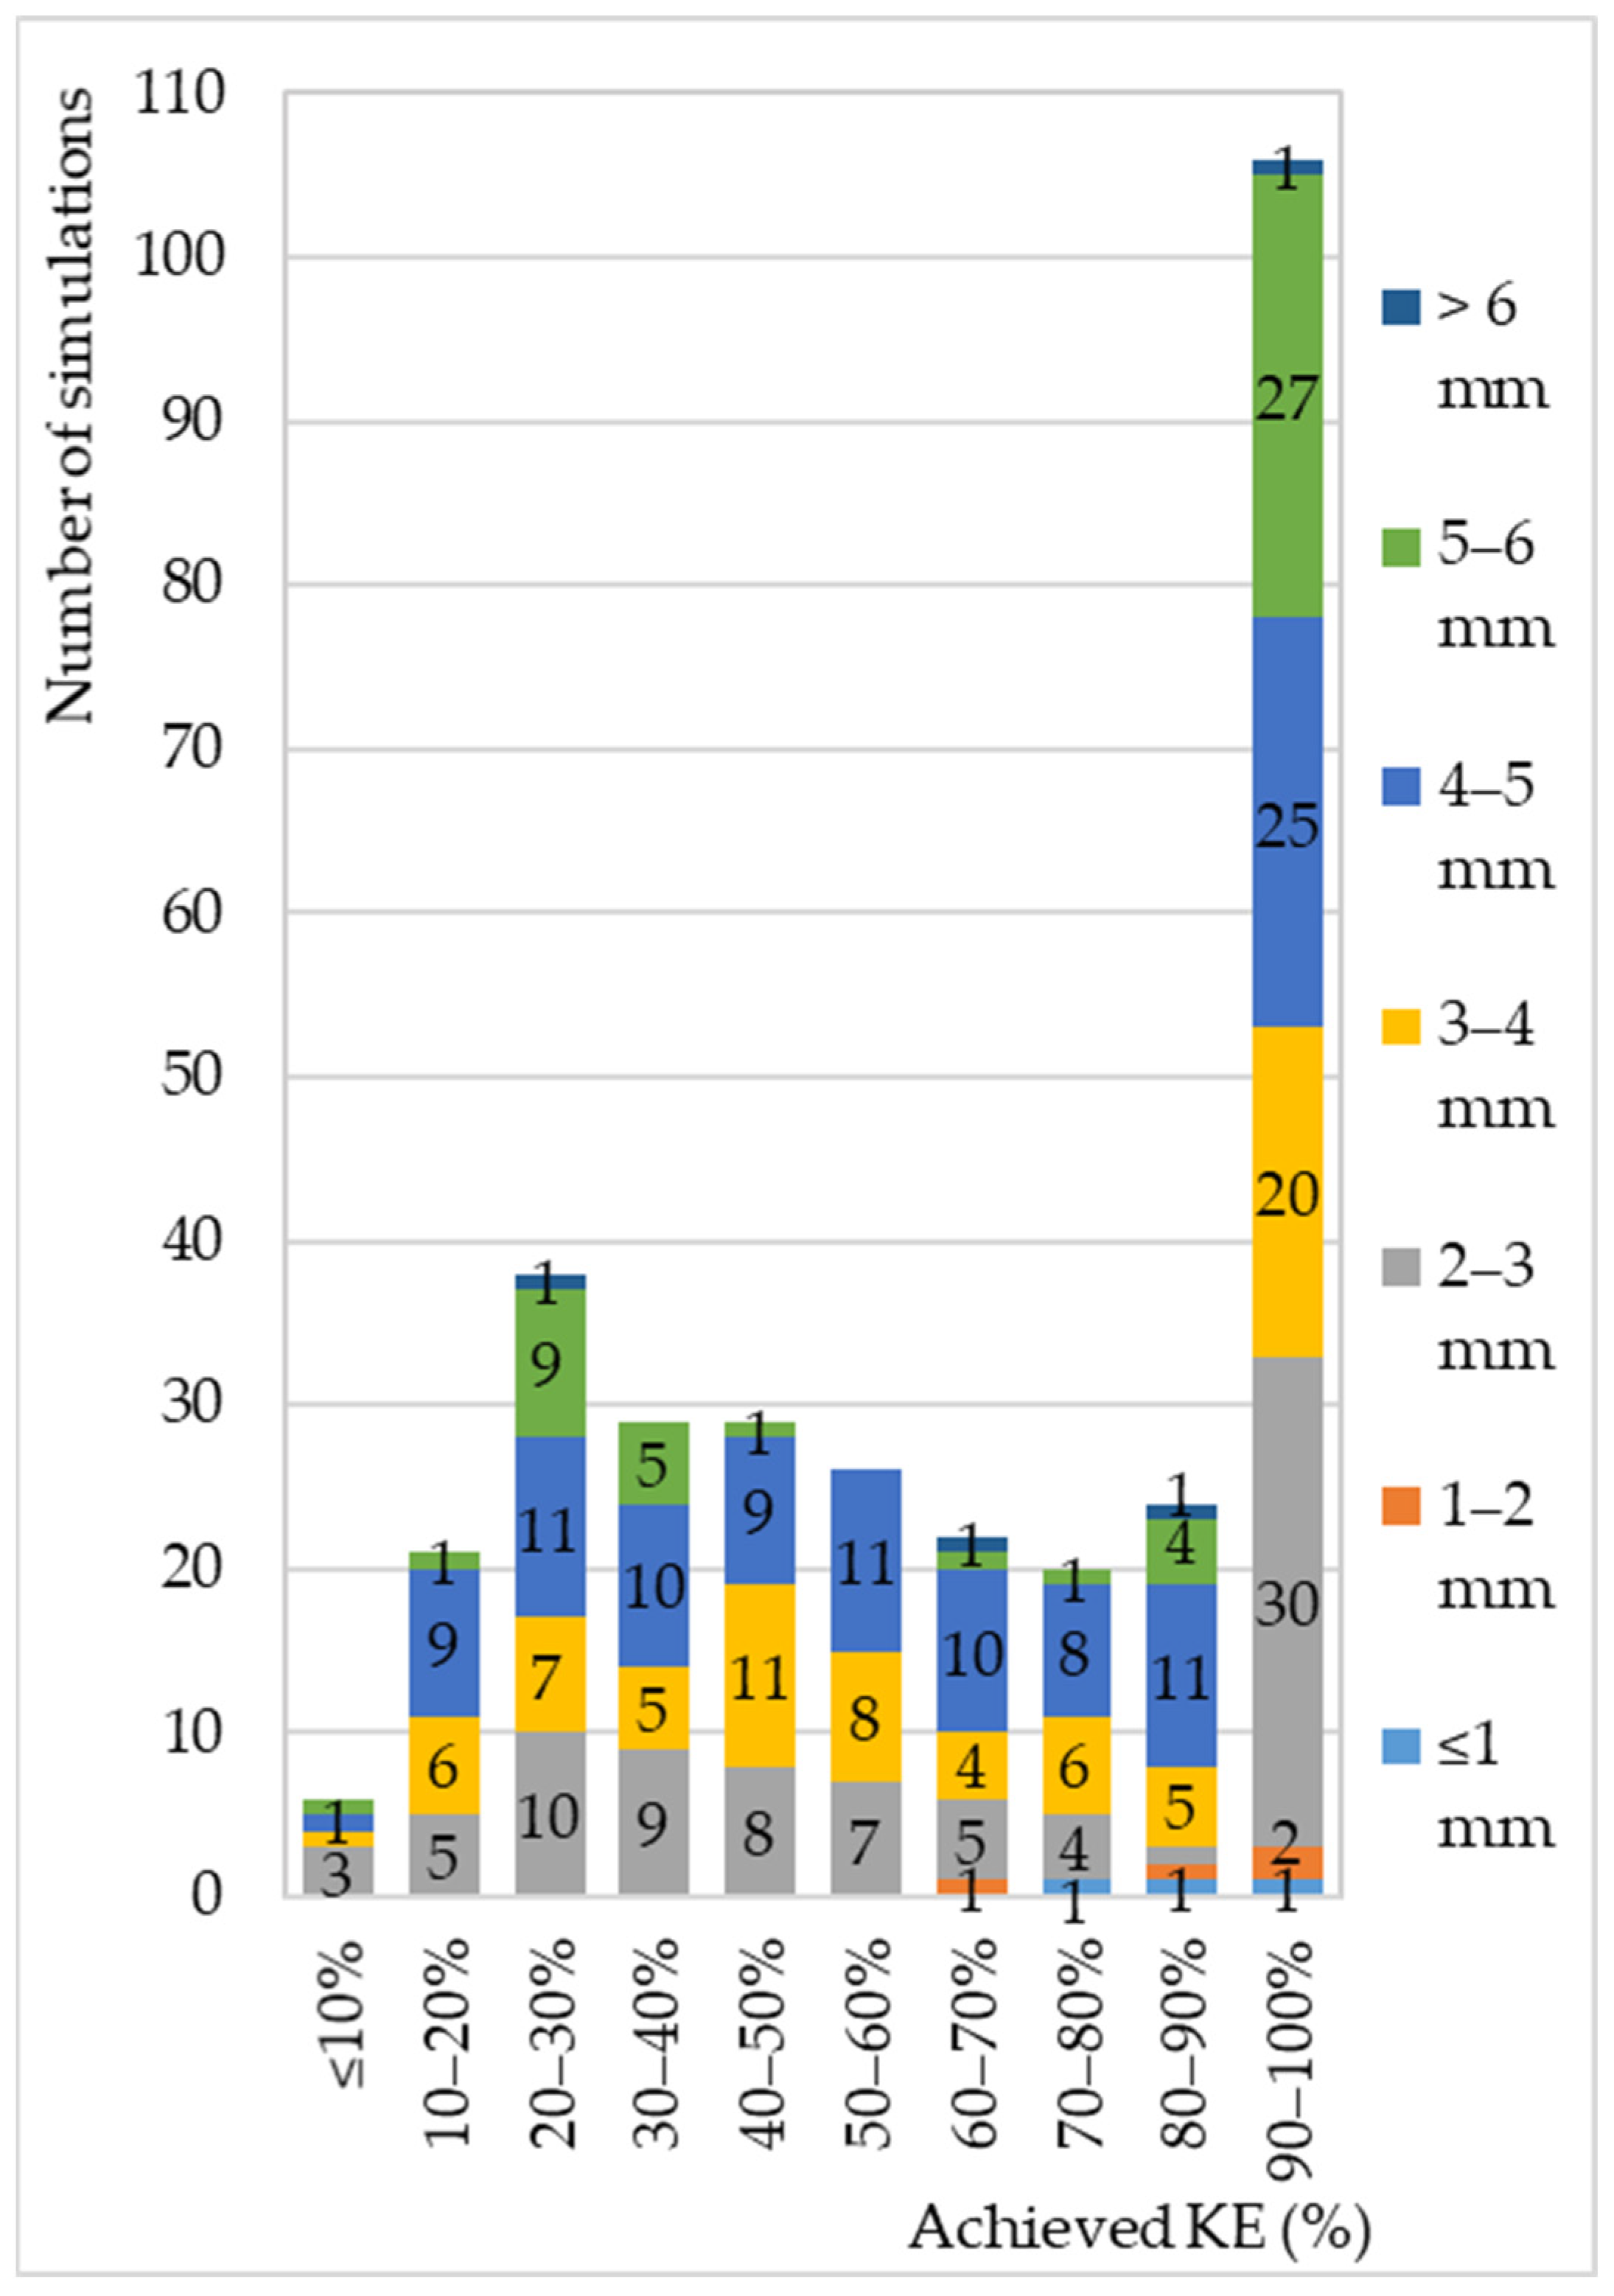
Rainfall simulators represent often-used equipment for soil research. Depending on their performance, they could be appropriate for some soil research or not. Dripping rainfall simulators (DRS) can provide rainfall that corresponds to natural rainfall, except in terms of the drop size distribution and wetted area. However, usually there are more factors that do not correspond to natural rainfall, such as the median drop size, volume and kinetic energy. The sizes of the drops generated by the simulator drippers are mostly in the range between 2 and 6 mm, while the number of drops smaller than 2 mm is relatively small. The intensity and duration of the simulated rain can be successfully produced to match natural values, with the most frequently simulated short-term rainfall of a high intensity. Most simulations were conducted at a fall height of up to 2 m, and then their number gradually decreases as the height gets closer to 5 m. Most simulations (58.6%) occur in the range between 20–90% KE, then 33.0% in a range of 90–100%, with only 8.4% lower than 20% KE.
- dripping rainfall simulators
- drippers
- simulator performance
- soil research
1. Introduction
2. DRS for Soil Research Performances
2.1. Wetted Area
2.2. Drop Size
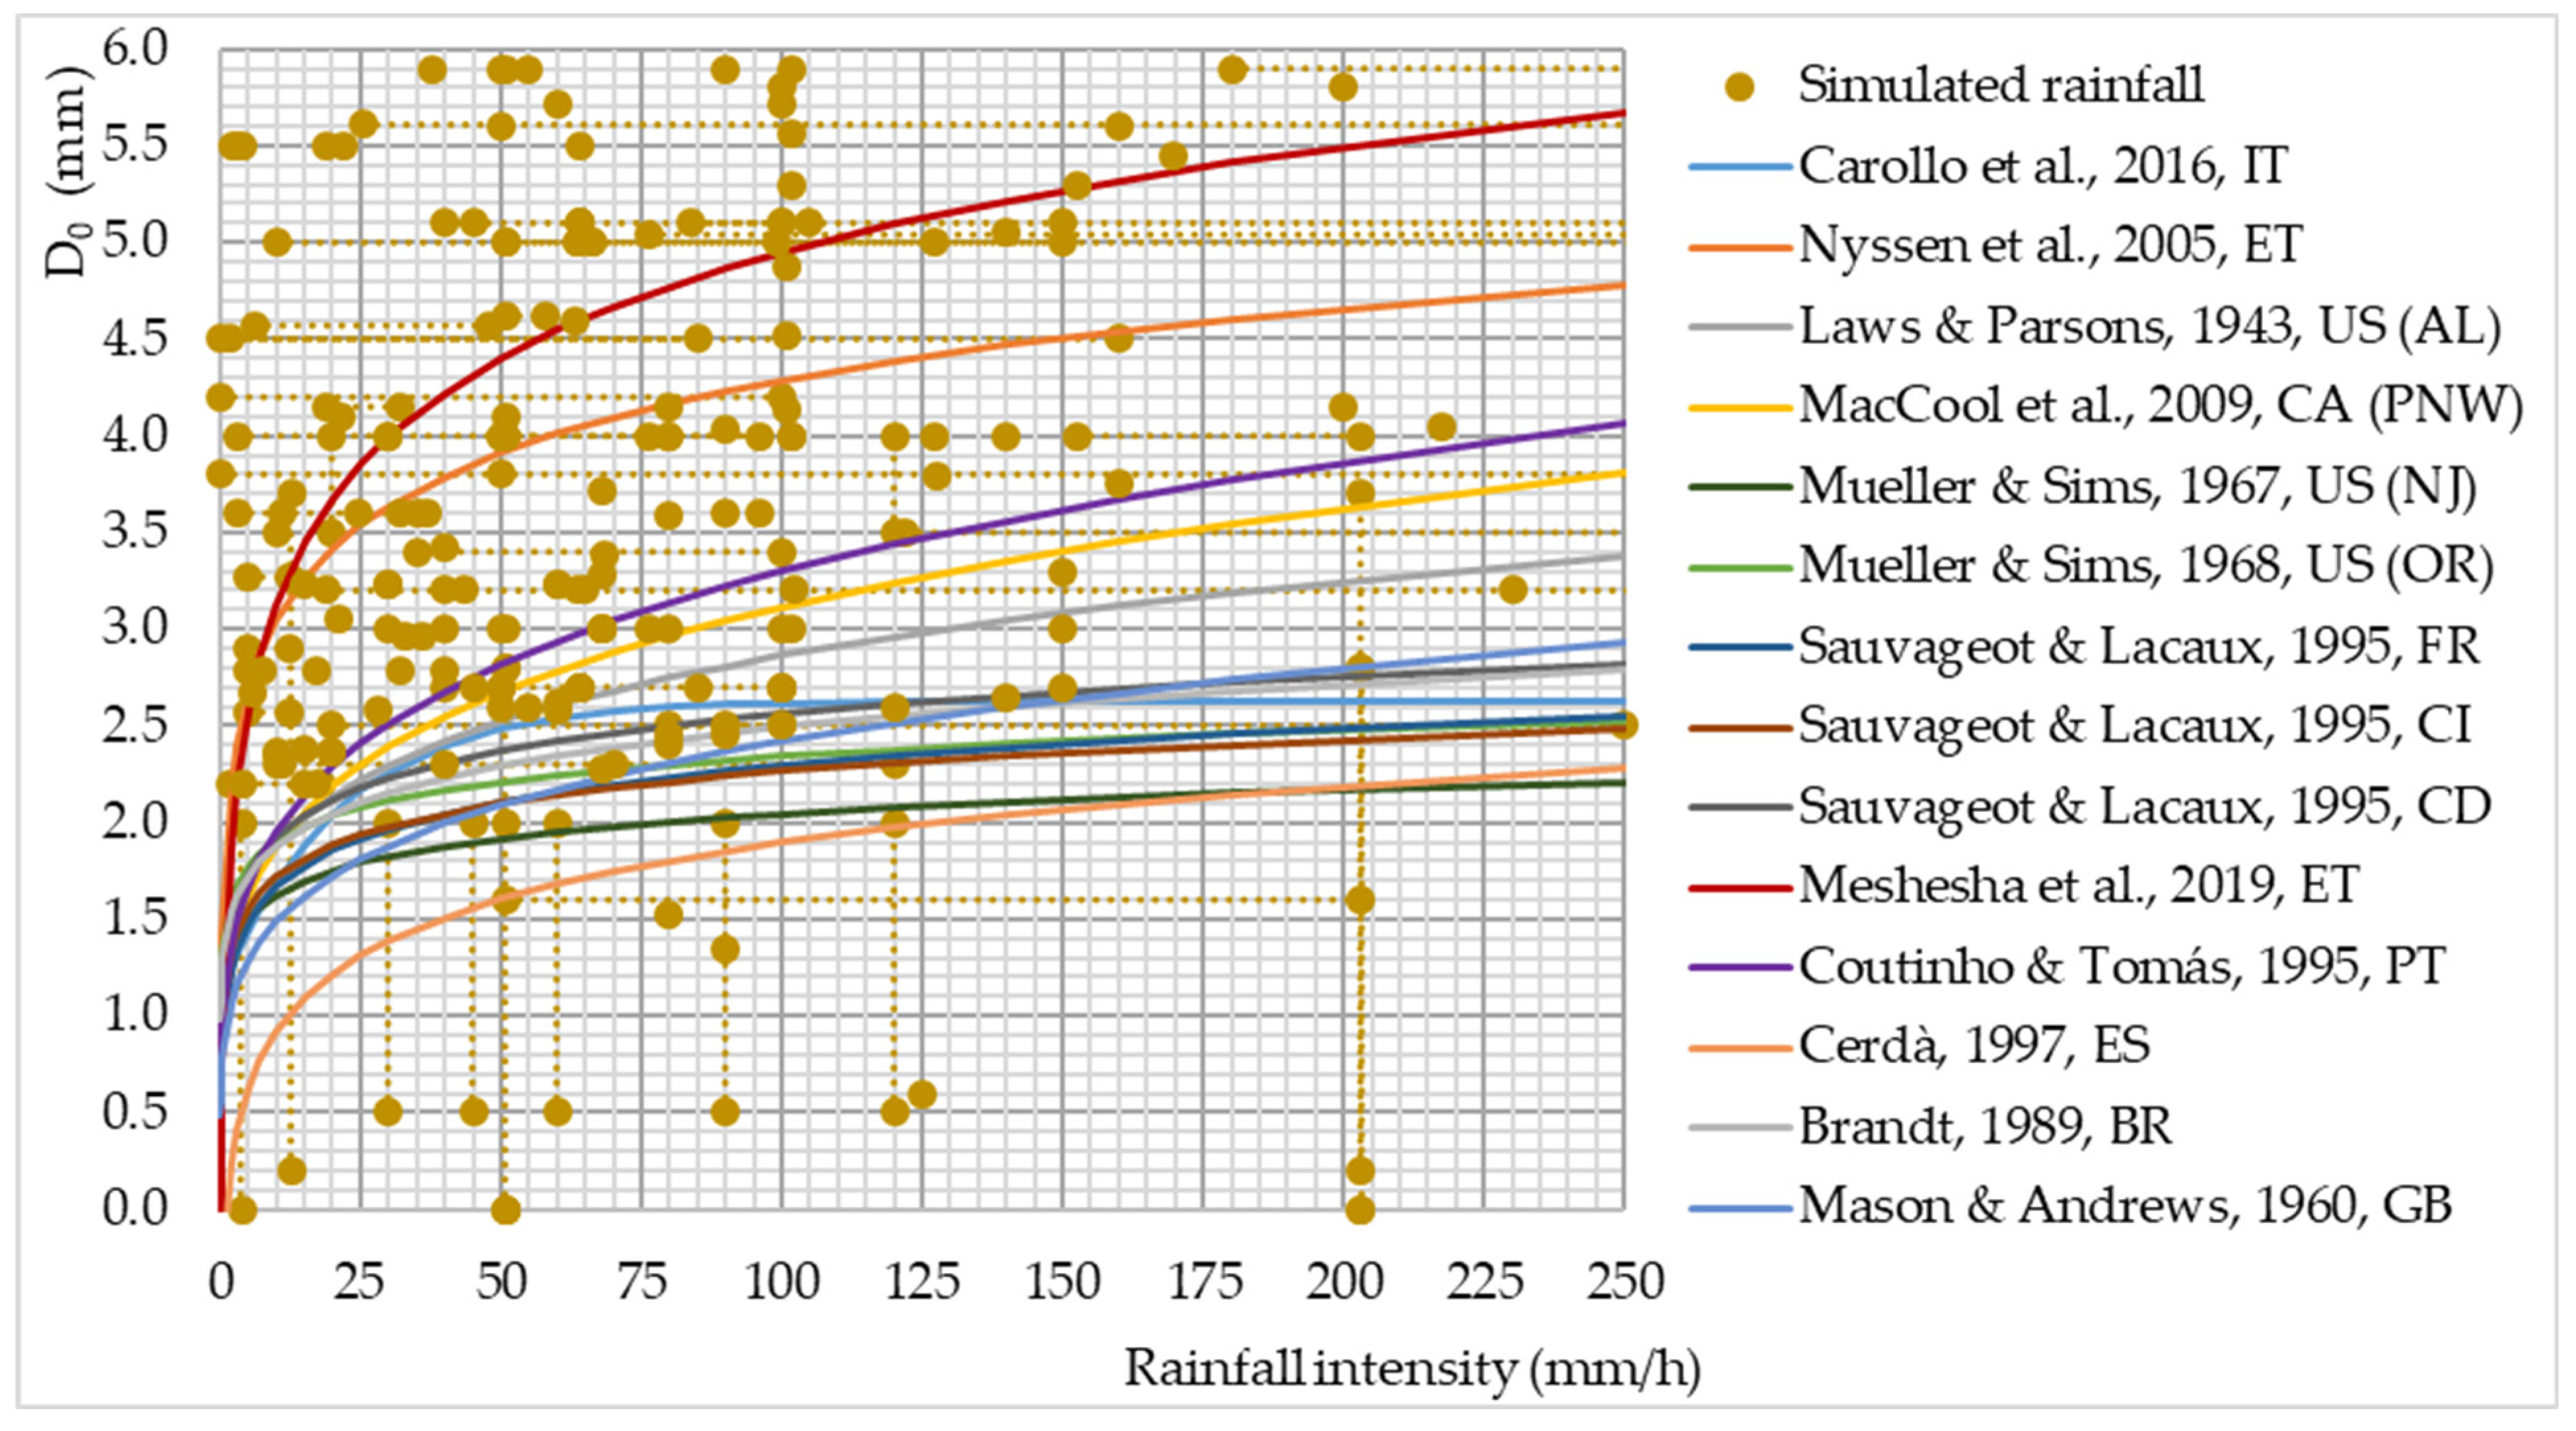
Natural or simulated rainfall drop size is defined by the diameter of a sphere whose volume is identical to the drop volume, although raindrop shape usually is not entirely spherical [62,63,64][47][48][49]. The choice of drippers for the DRS is often based on the experience of previous research or personal empirical knowledge, under the assumption that drippers in the form of tubes and holes with a smaller internal diameter (ID) generate drops of a smaller diameter and vice versa, neglecting other factors that affect the size of the drops. However, when fitting logarithmic functions, the dripper diameter of metal and plastic tubes (MT and PT) showed a strong relation for the dripper’s outer diameter (OD), while the relation for the dripper’s ID is moderate-to-weak (Figure 1a,b). For some of the drippers, both the ID and OD values were available, so their pairs can be noticed in the graph.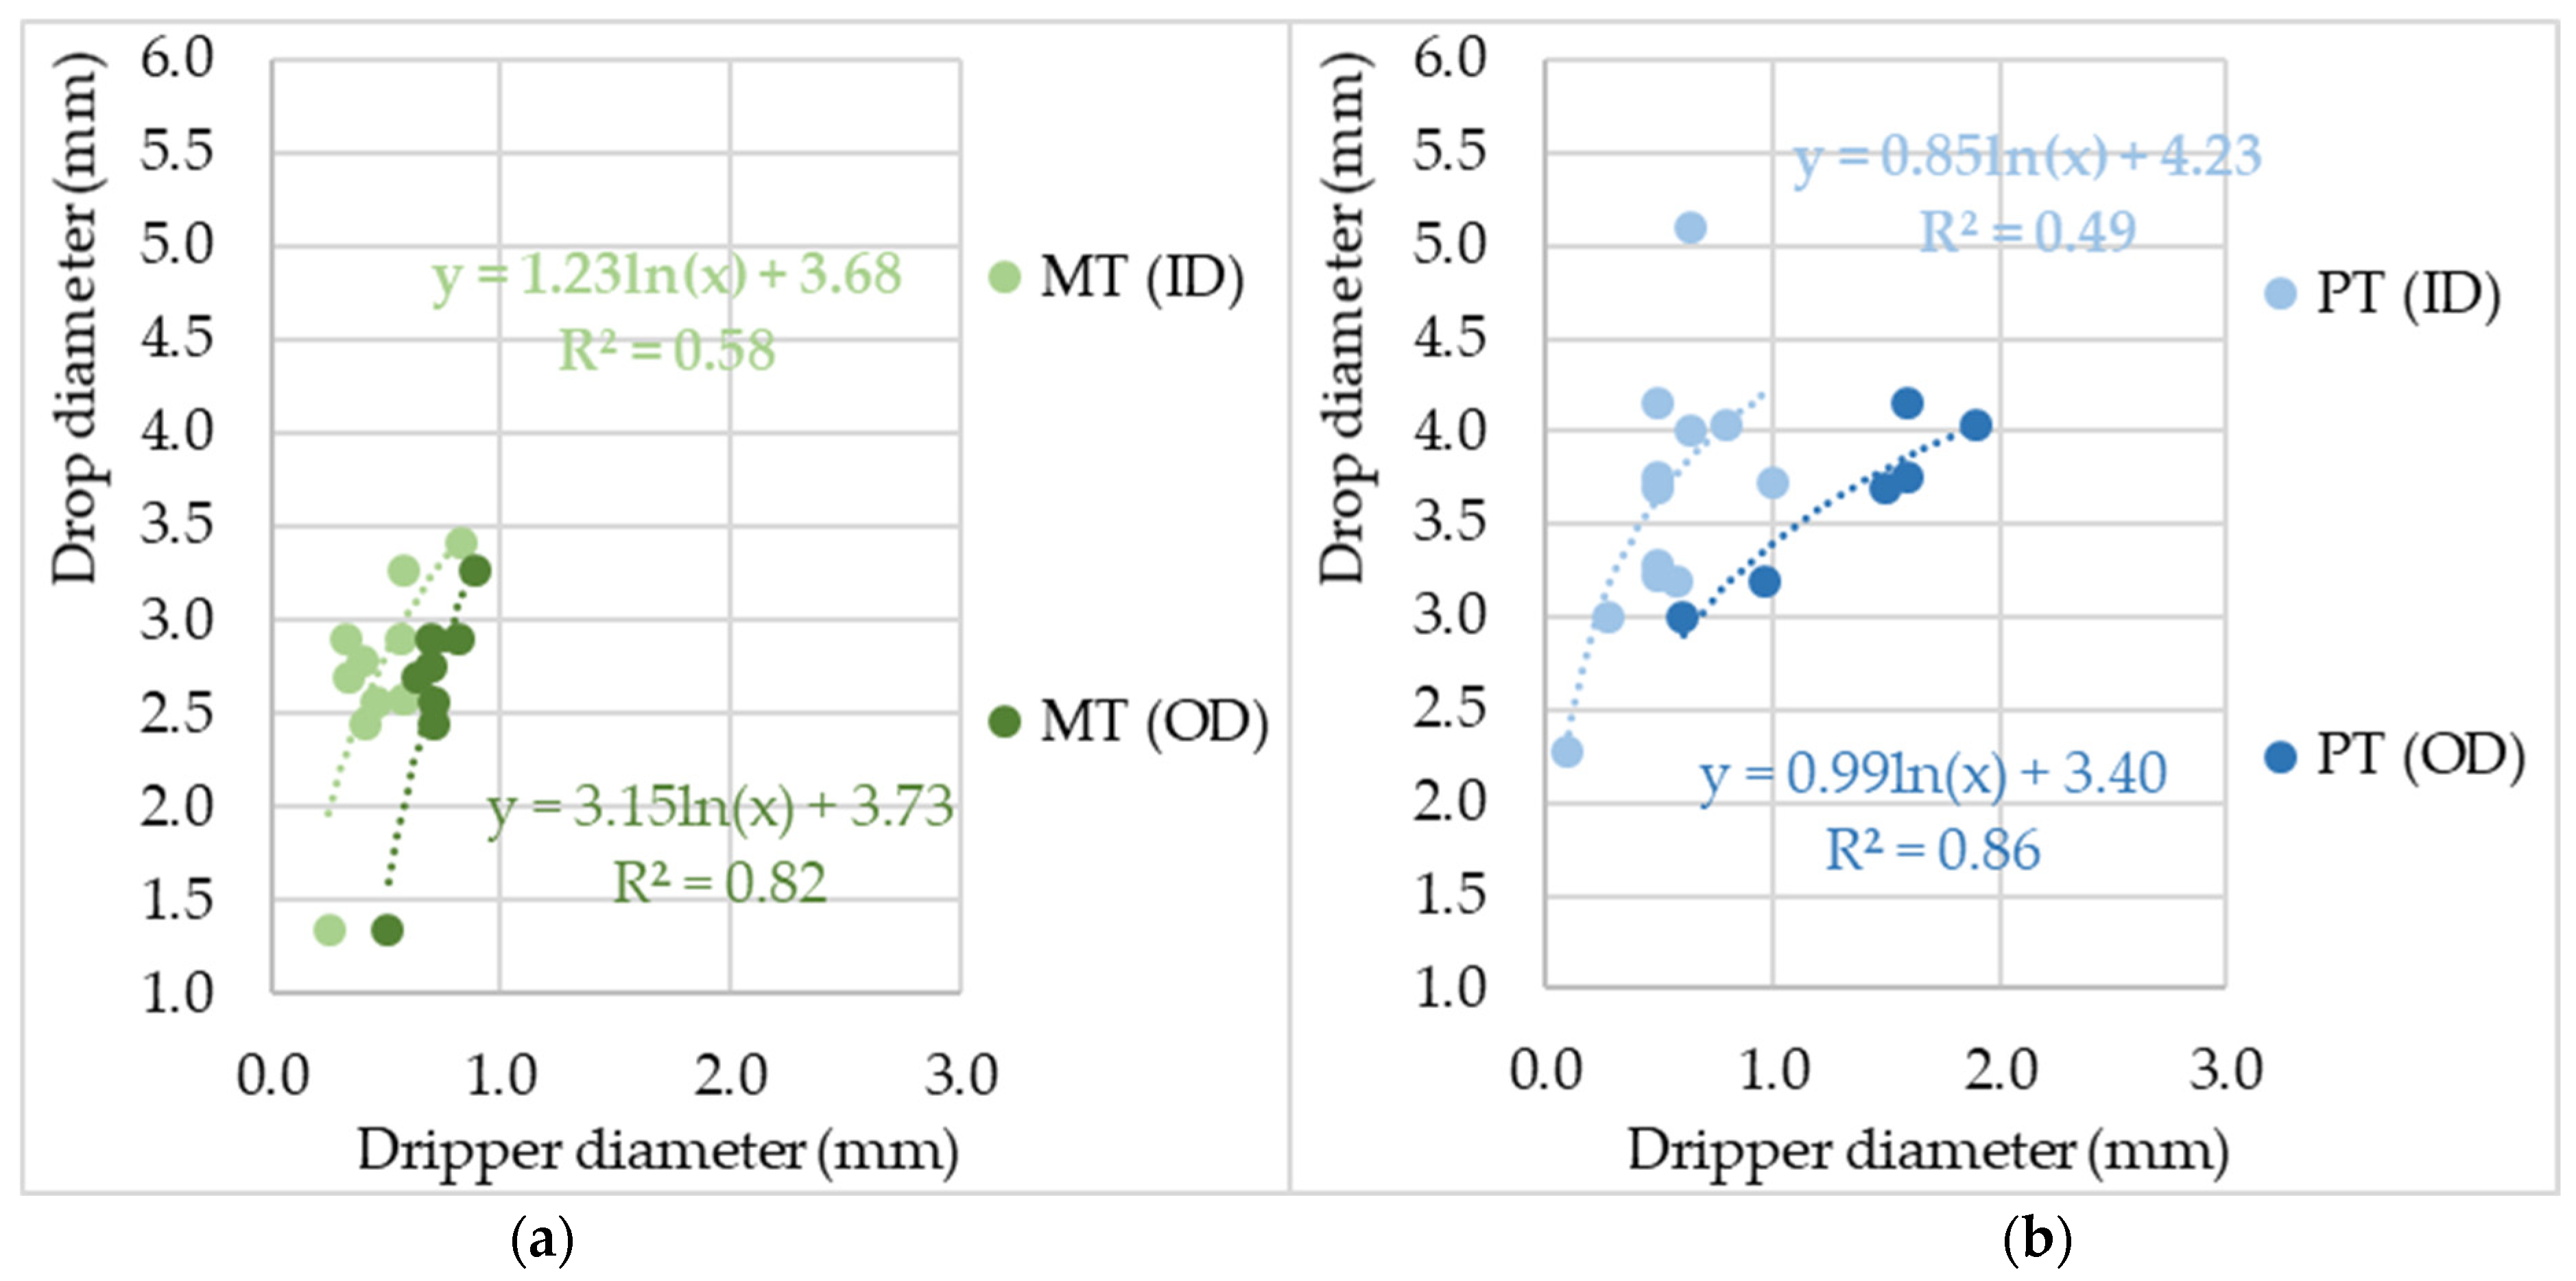
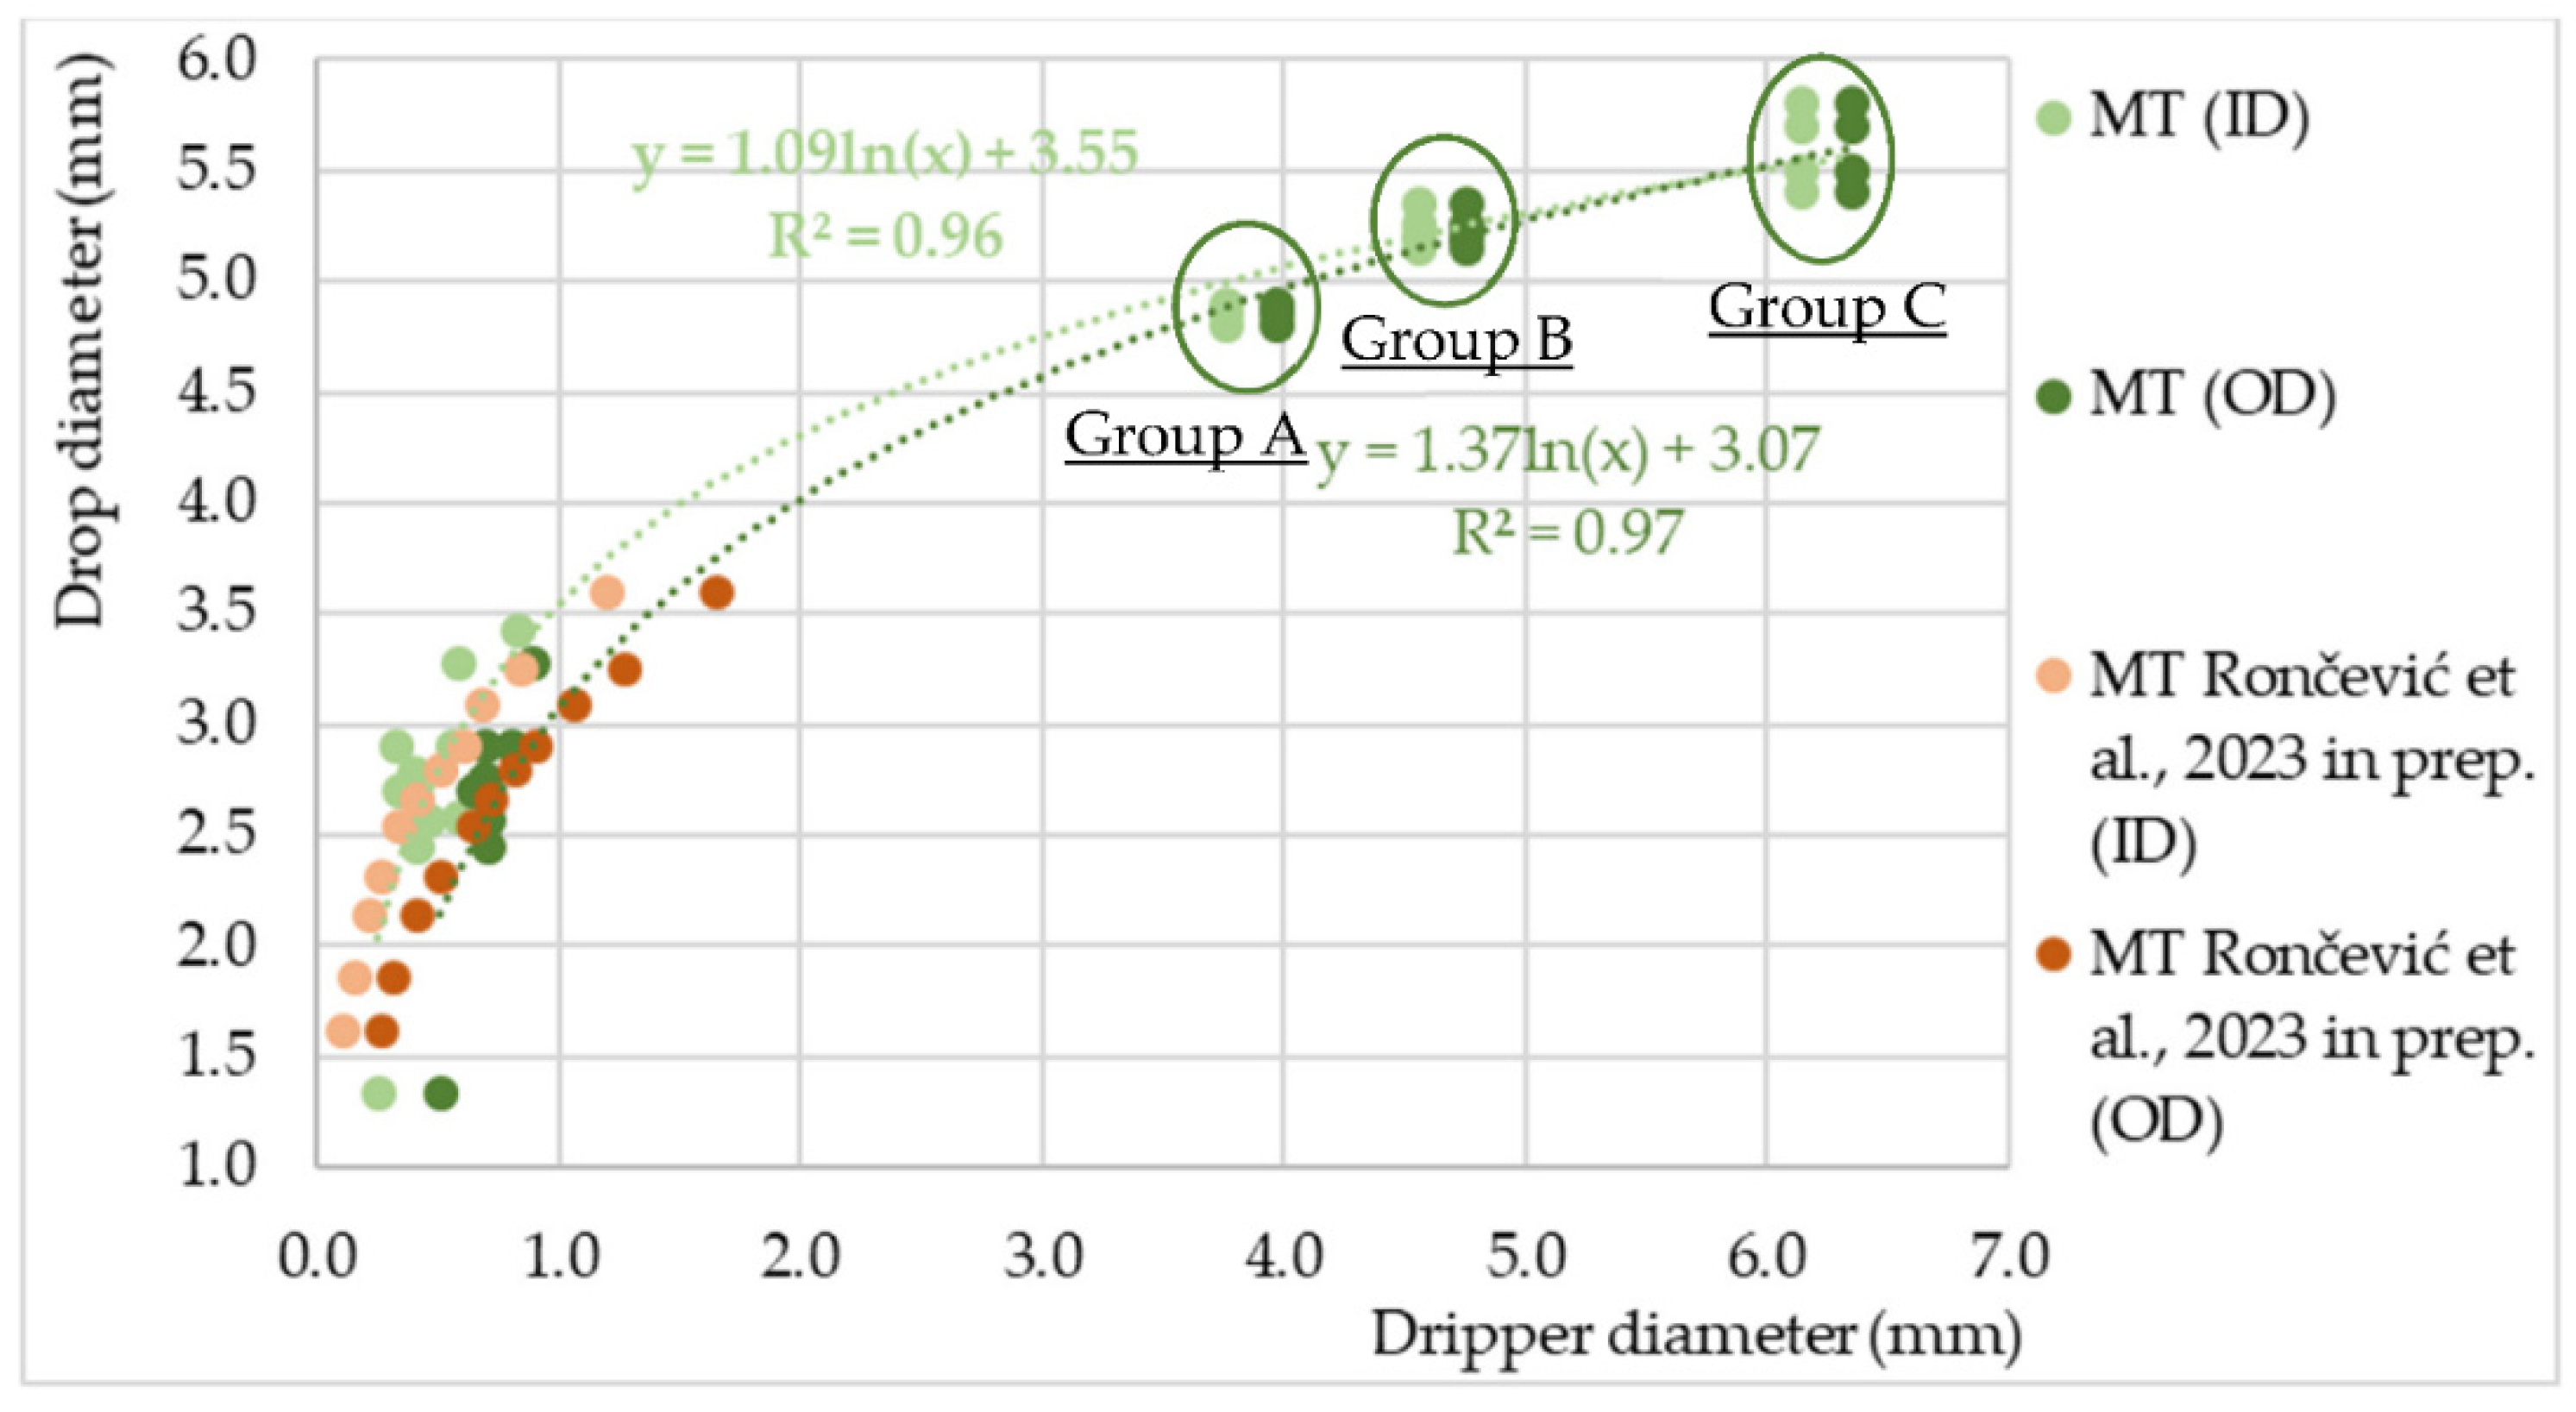
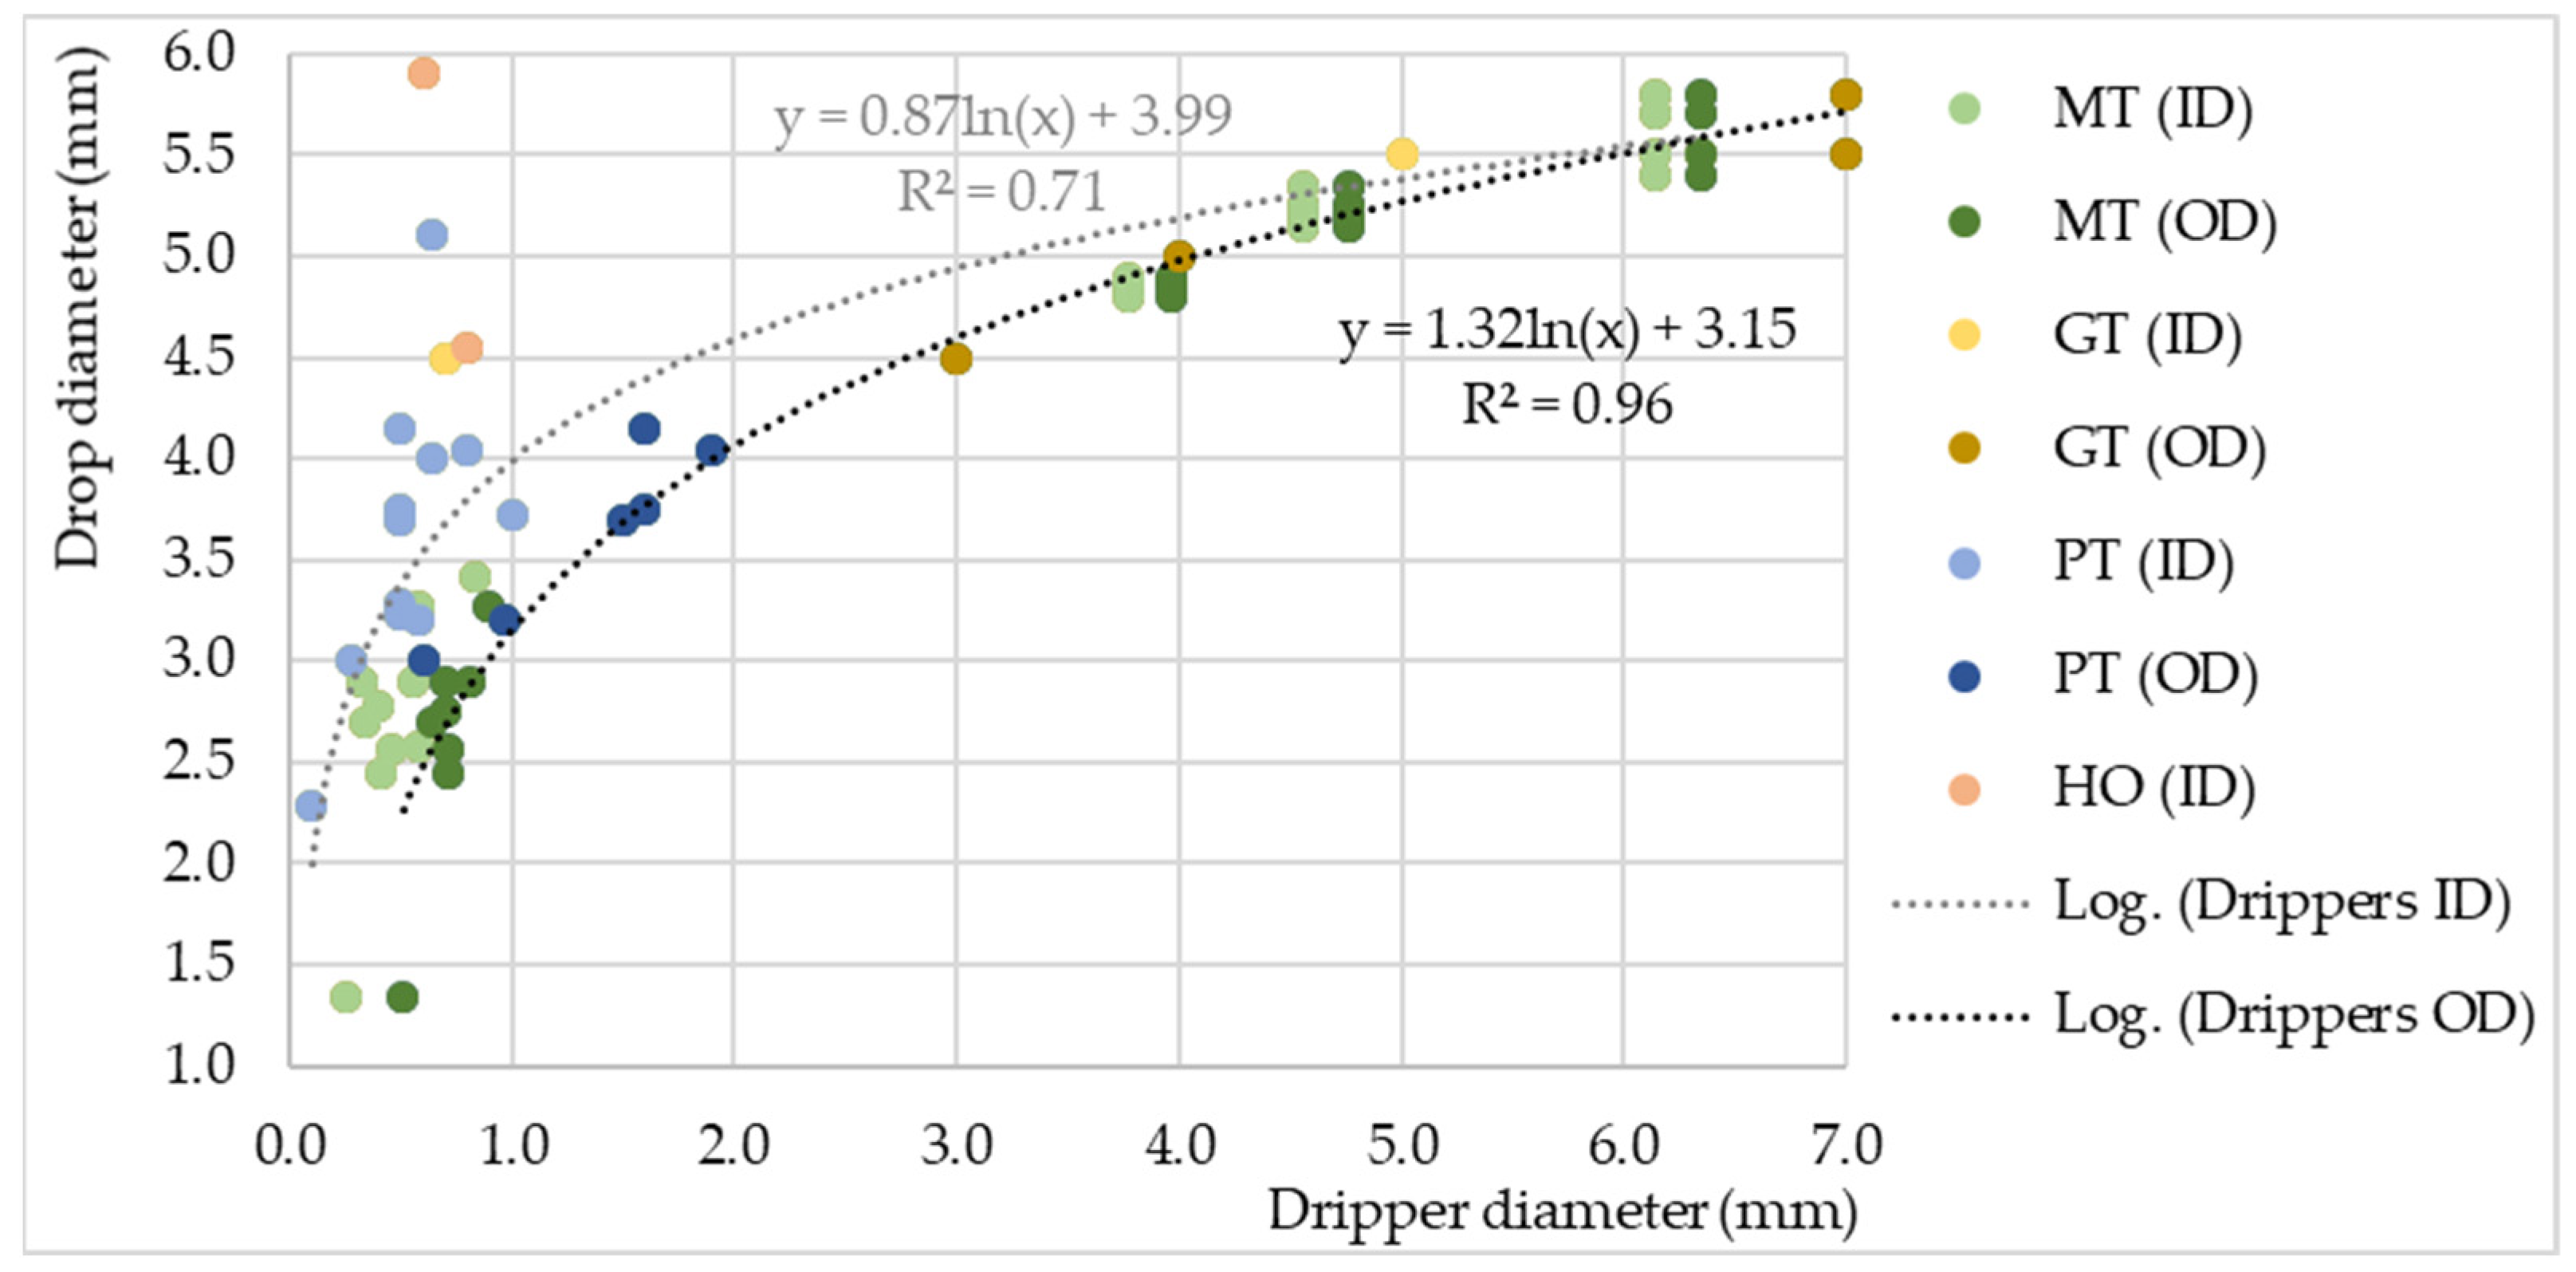
It is obvious that with the increase in the ID of the plastic tubes, the relation deviates from the logarithmic curve that represents all drippers together. Additionally, there are HO drippers whose values deviate from the logarithmic curve too, but they are specific because they have an almost infinite outer diameter (Figure 3). It is suggested that a possible reason for such a deviation could be the dripper material. However, based on the research of [68–72], drippers made from different materials such as glass, brass, stainless steel, Teflon, all show no significant difference in drop size. The material type rather determines the thickness of the tube wall. Therefore, when describing the relation between the dripper diameter and drop size, the assumption is that metal tube drippers have a different logarithmic distribution than plastic or glass tubes, because of their thinner wall (Figures 1a,b and 3), regardless of whether they are sharp or blunt.
However, drop size is not exclusively correlated with dripper diameter, surface tension or dripper tip geometry. The size of the drop depends on numerous other factors; among them are dripping intensity, dripping tip position and geometry, length-to-diameter ratio, water temperature and environmental atmosphere condition [67,72,76][52][53][54]. In addition to the dripper diameter and type, the dripping speed is also a factor that was taken into account for soil research using rainfall simulators. [25]. With the rise in the dripping speed, the drop size of the MT drippers rises too, until it starts to decline at some point [65][50].
2.3. Rainfall Intensity and Duration
The rainfall intensity of DRS is regulated by regulating the pressure or water flow in the hydraulic system of the simulator [32,107,108,109,110][32][71][72][73][74]. The most common values of simulated rainfall intensities range up to 50 mm/h, and then their number gradually decreases for the ranges of 50–100 mm/h, 100–150 mm/h and over 150 mm/h, with a maximum value of over 1600 mm/h (Figure 5).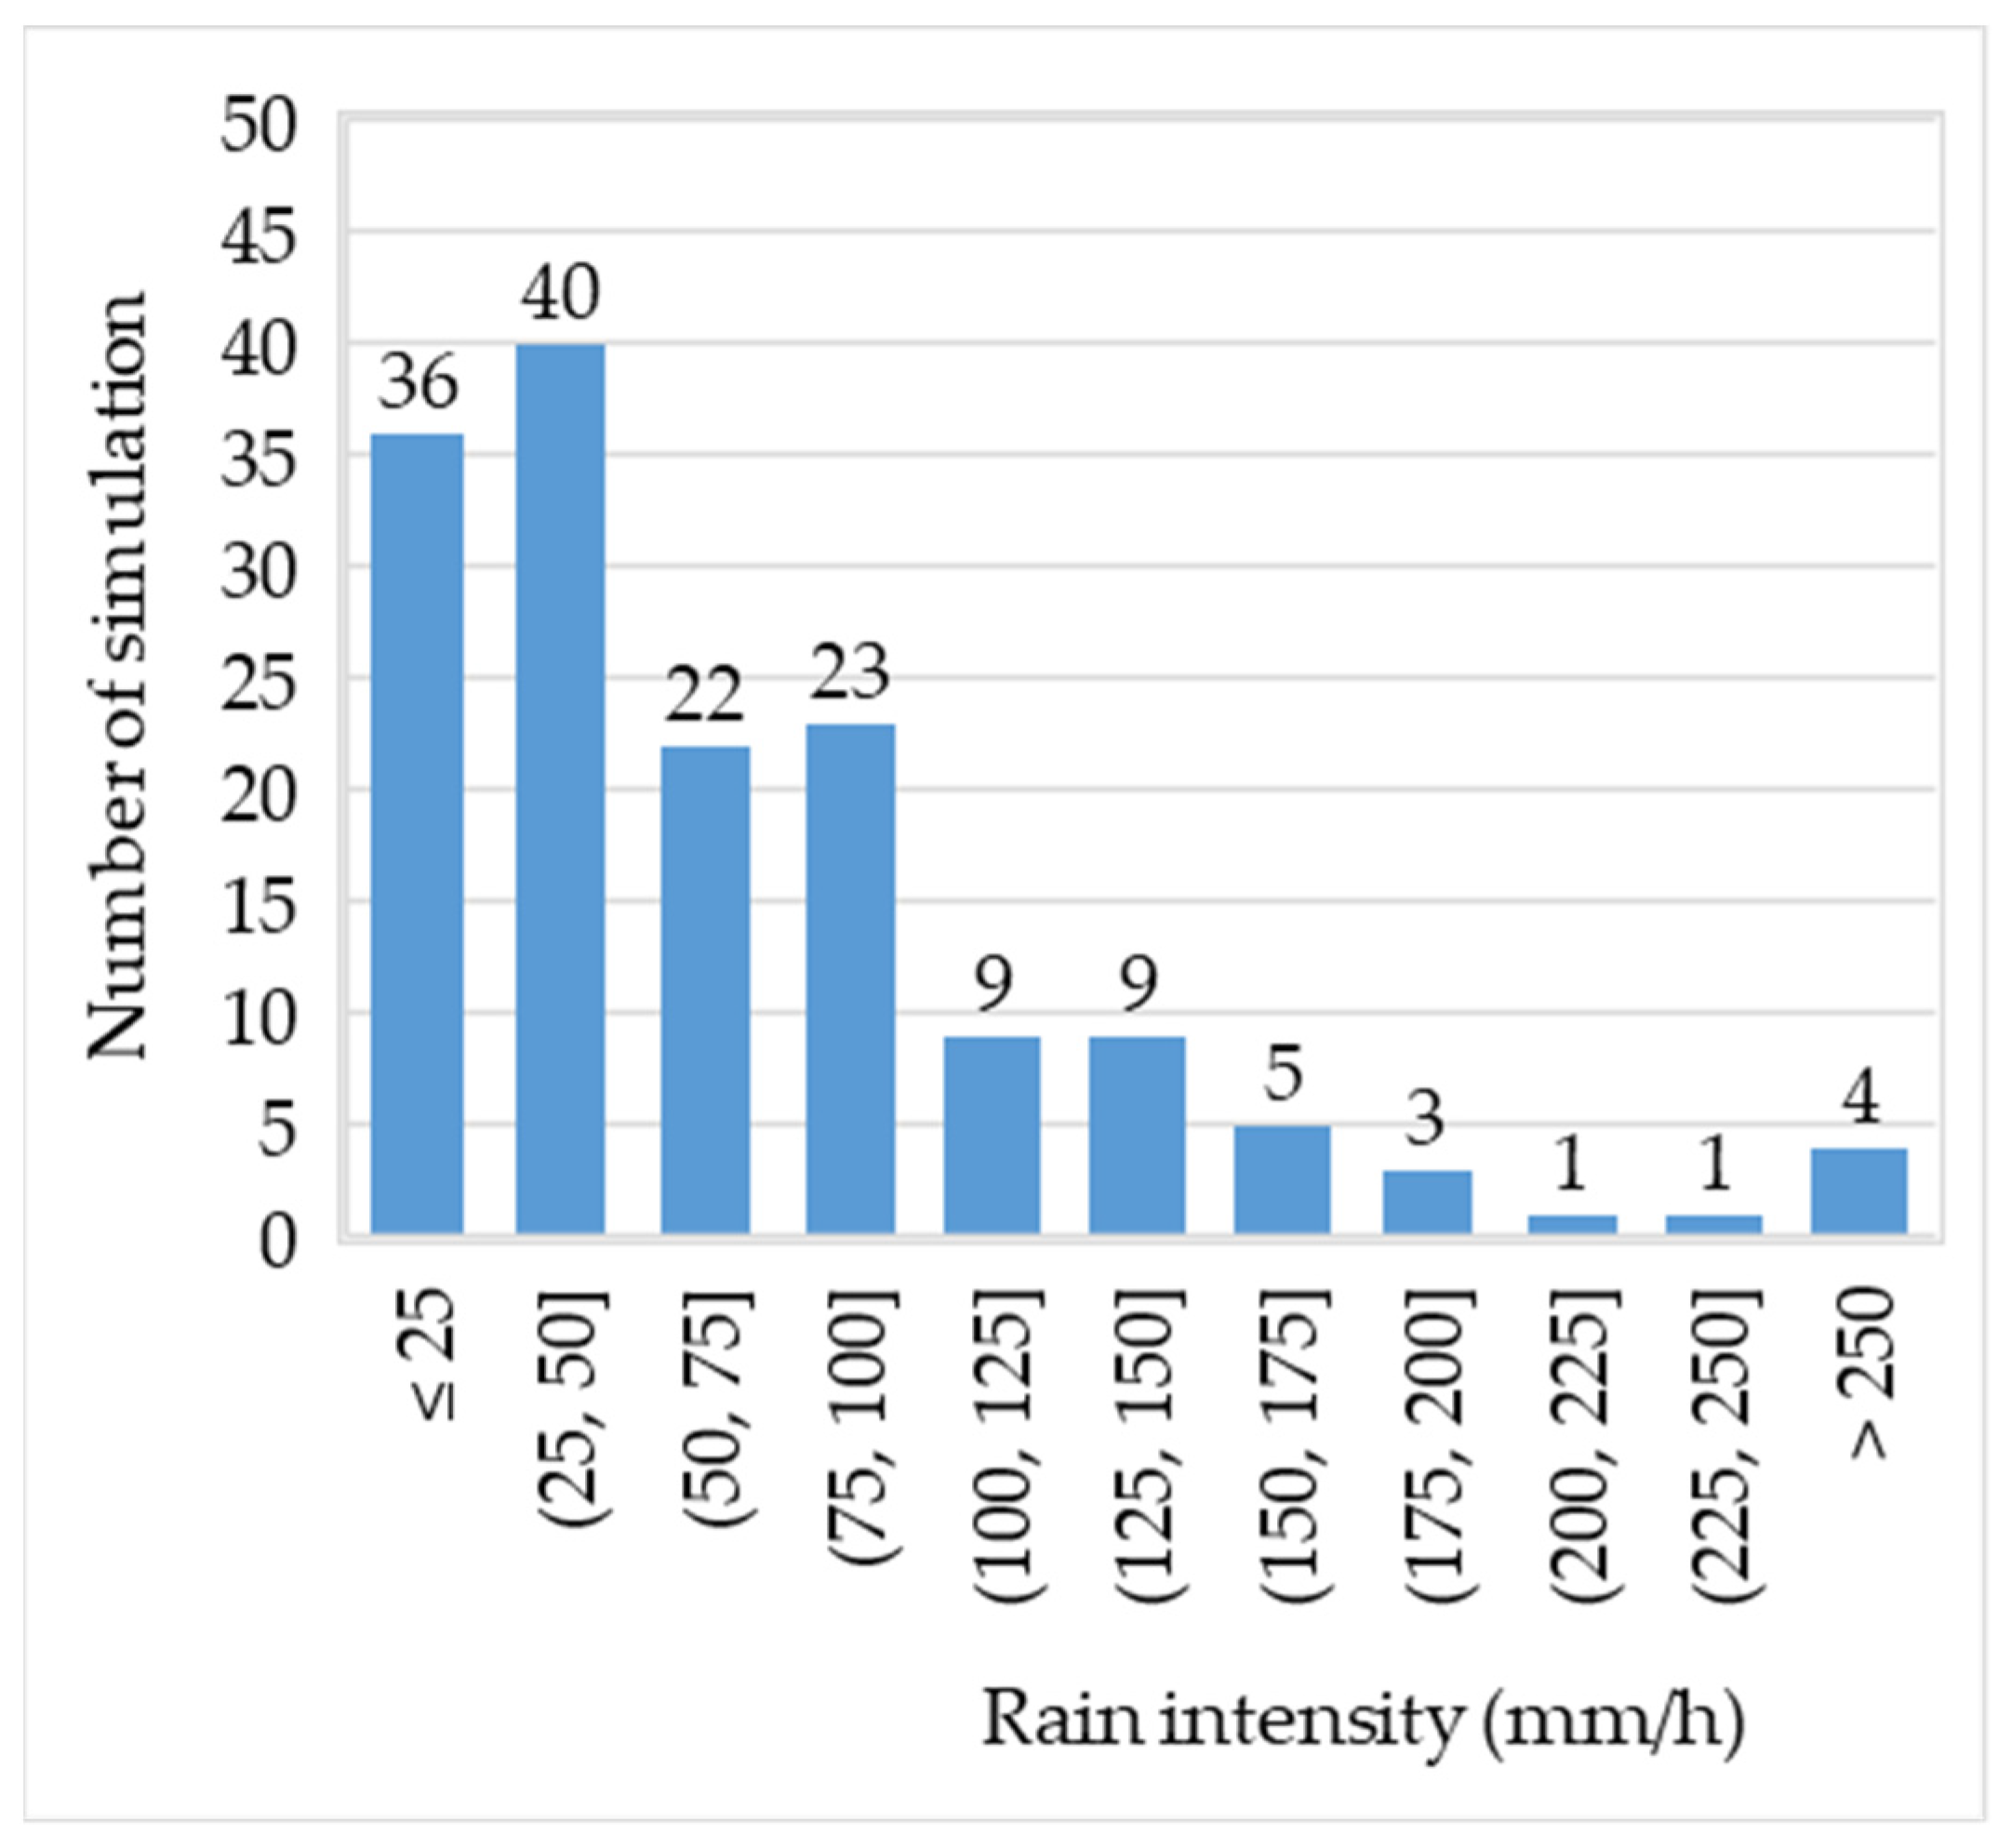
In addition to the D0, rainfall intensity is also correlated with rainfall duration. The simulated and natural precipitation intensity for the return period of 1–5 years for different geographical areas mostly coincides (Figure 7).
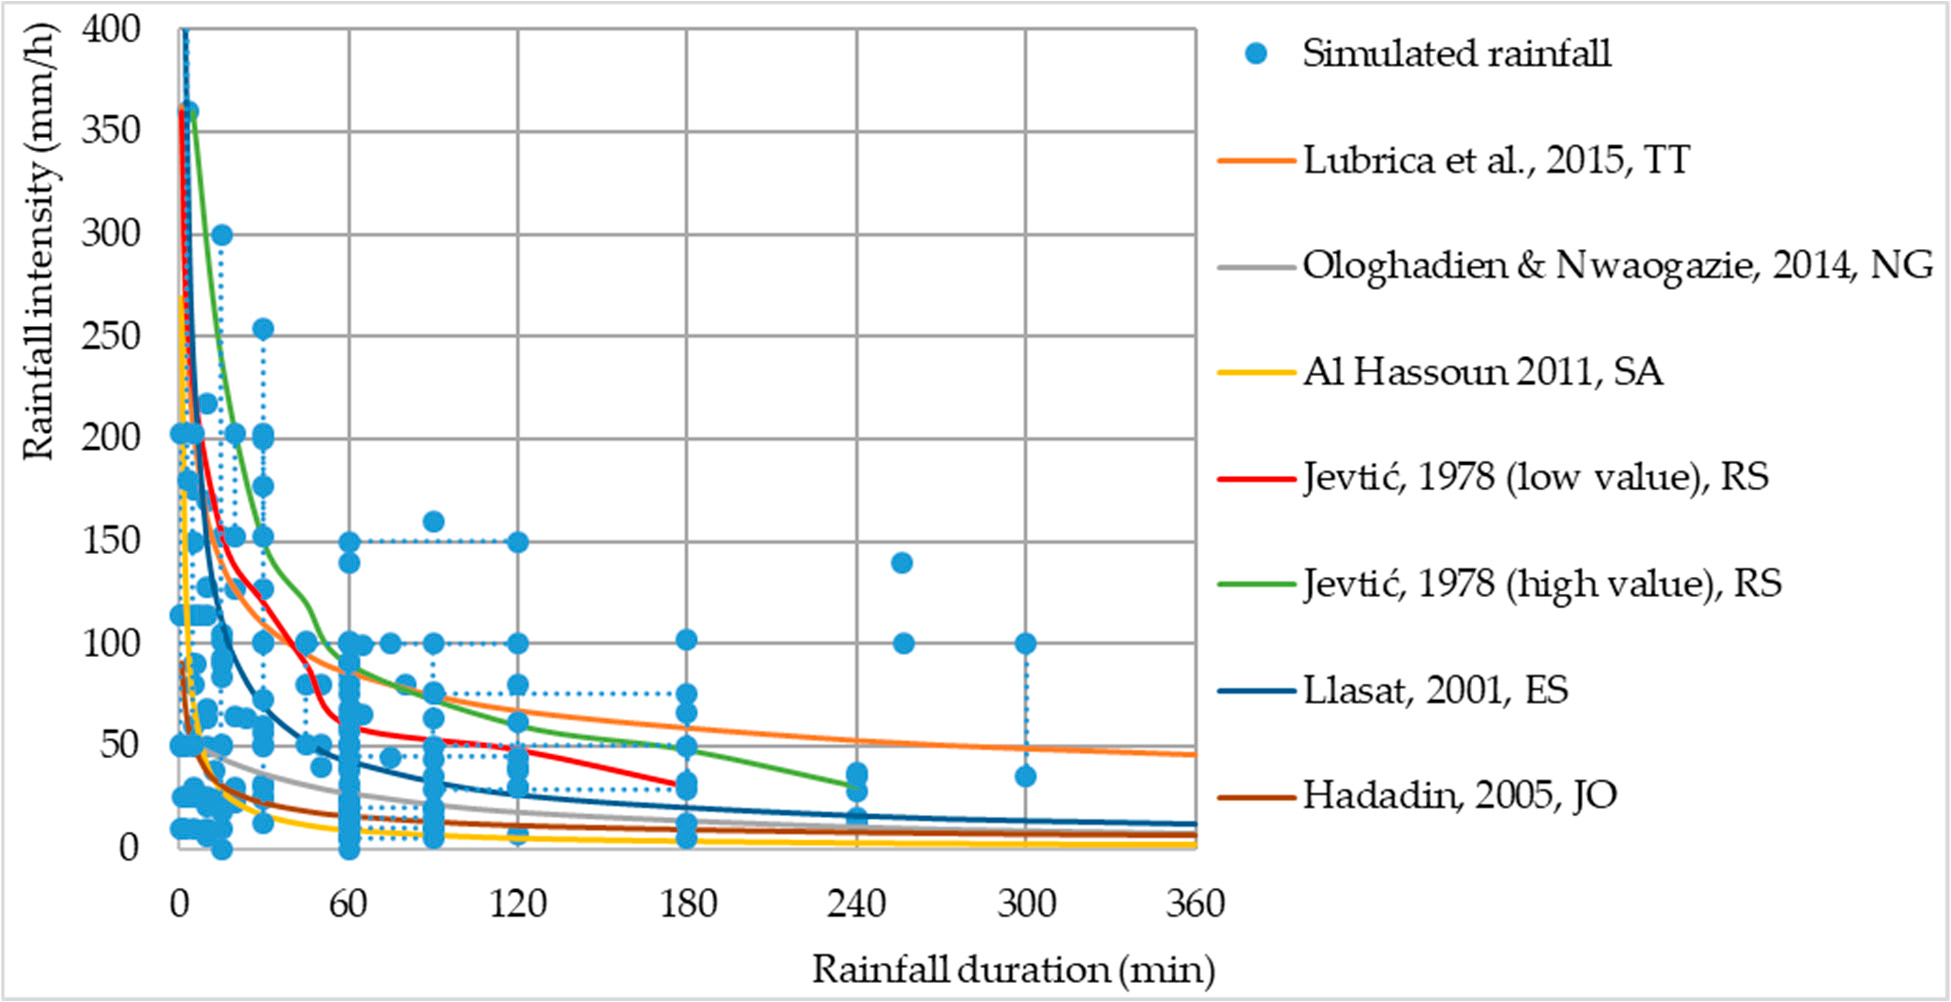
Figure 7. Rainfall intensity as a function of the duration of natural and simulated rainfalls. Note:
two capital letters after reference represent the ISO Alpha-2 country code that designates countries in which measurements have been conducted [23,129–133]. Note: dotted lines represent simulated rainfall duration and rainfall intensity values that are given in a range.
2.4. Kinetic Energy (KE)
2.4. Kinetic Energy (KE)
The KE of rainfall is determined by the size distribution of raindrops and their falling speed. Since the diameter of the drop and the height of the fall are known for DRS>1, it is possible to calculate the KE of such precipitation. There are several works that determined the terminal velocity of drops of different diameters under given conditions [57,104,134,135,136][100][101][102][103][104] however, during simulations, due to the insufficient height at which the drops were placed, terminal velocities were often not reached. Given that the change in drop velocity does not occur linearly with the change in drop height and is different for drops of different diameters, there is no single equation that could represent this relationship [57][100]. For the purposes of the research, a mathematical model by [57][100] for determining the terminal and achieving the speed of drops of different diameters at different heights of drops was applied for the determination of the achieved speed, i.e., the KE of drops in the previous simulations (Figure 8).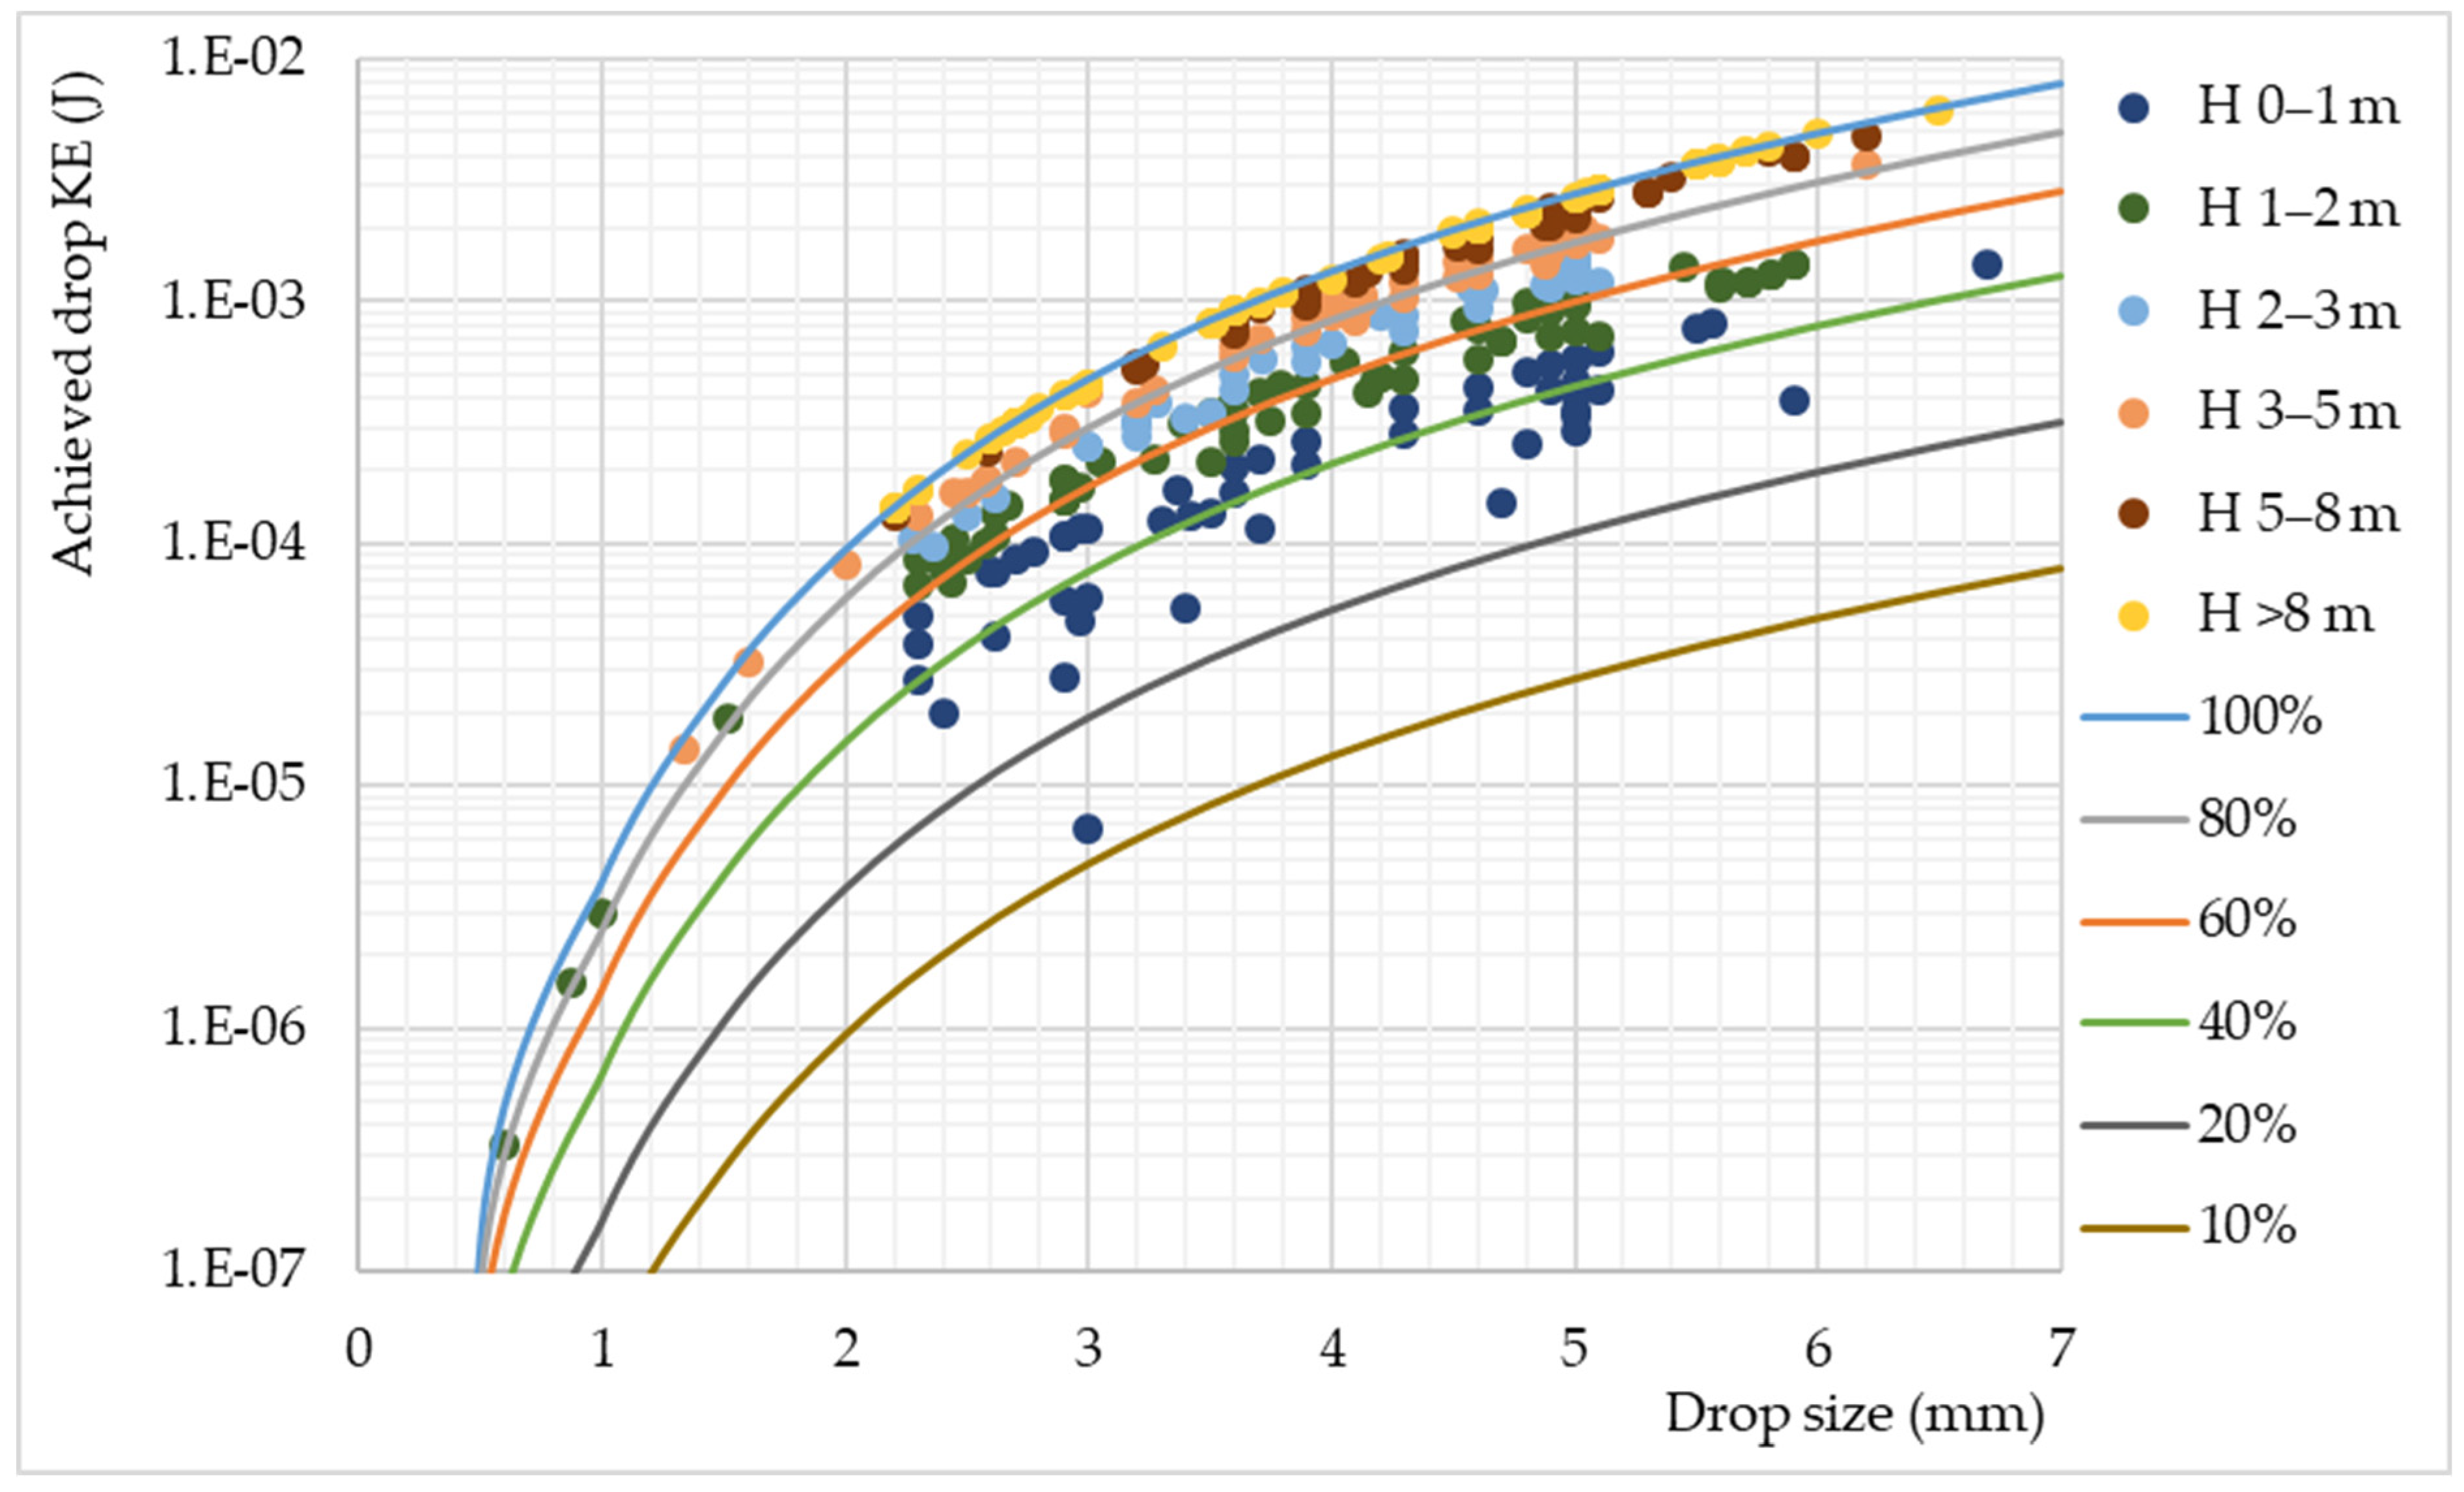
drops of different diameters. Note: data whose values of drop diameter or fall height are given in
ranges are not included in the analysis.
3. Conclusions
References
- Bryan, R.B. An Improved Rainfall Simulator for Use in Erosion Research. Can. J. Earth Sci. 1970, 7, 1552–1561.
- Ogunye, F.O.; Boussabaine, H. Development of a Rainfall Test Rig as an Aid in Soil Block Weathering Assessment. Constr. Build. Mater. 2002, 16, 173–180.
- Alves Sobrinho, T.; Gómez-Macpherson, H.; Gómez, J.A. A Portable Integrated Rainfall and Overland Flow Simulator. Soil Use Manag. 2008, 24, 163–170.
- Gabrić, O. Eksperimentalno Istraživanje Procesa Na Slivu: Padavine, Oticaj I Erozija Tla; University of Novi Sad: Subotica, Serbia, 2014.
- Živanović, N.; Rončević, V.; Spasić, M.; Ćorluka, S.; Polovina, S. Construction and Calibration of a Portable Rain Simulator Designed for the in Situ Research of Soil Resistance to Erosion. Soil Water Res. 2022, 17, 158–169.
- Te Chow, V.; Harbaugh, T.E. Raindrop Production for Laboratory Watershed Experimentation. J. Geophys. Res. 1965, 70, 6111–6119.
- Meeuwig, R.O. Infiltration and Water Repellency in Granitic Soils. In Intermountain Forest & Range Experiment Station; US Department of Agriculture, Forest Service: Ogden, UT, USA, 1971; volume 111.
- Battany, M.C.; Grismer, M.E. Development of a Portable Field Rainfall Simulator for Use in Hillside Vineyard Runoff and Erosion Studies. Hydrol. Process. 2000, 14, 1119–1129.
- Naves, J.; Anta, J.; Suárez, J.; Puertas, J. Hydraulic, Wash-off and Sediment Transport Experiments in a Full-Scale Urban Drainage Physical Model. Sci. Data 2020, 7, 44.
- De Ploey, J.; Moeyersons, J. Runoff Creep of Coarse Debris: Experimental Data and Some Field Observations. Catena 1975, 2, 275–288.
- Imeson, A.C. A Simple Field-Portable Rainfall Simulator for Difficult Terrain. Earth Surf. Process. 1977, 2, 431–436.
- Bowyer-Bower, T.A.S.; Burt, T.P. Rainfall Simulators for Investigating Soil Response to Rainfall. Soil Technol. 1989, 2, 1–16.
- Wan, Y.; El-Swaify, S.A. Characterizing Interrill Sediment Size by Partitioning Splash and Wash Processes. Soil Sci. Soc. Am. J. 1998, 62, 430–437.
- Watanabe, H.; Grismer, M.E. Diazinon Transport through Inter-Row Vegetative Filter Strips: Micro-Ecosystem Modeling. J. Hydrol. 2001, 247, 183–199.
- Böker, J.; Zanzinger, H.; Bastian, M.; Németh, E.; Eppel, J. Surface Erosion Control Investigations for a Test Field on a Steep Embankment of German Autobahn A3. In Proceedings of the EuroGeo5, Valencia, Spain, 16–19 September 2012.
- Flanagan, D.C.; Foster, G.R.; Moldenhauer, W.C. Storm pattern effect on infiltration, runoff, and erosion. Trans. ASAE 1988, 31, 414–420.
- Römkens, M.J.; Helming, K.; Prasad, S.N. Soil erosion under different rainfall intensities, surface roughness, and soil water regimes. Catena 2002, 46, 103–123.
- Ran, Q.; Su, D.; Li, P.; He, Z. Experimental Study of the Impact of Rainfall Characteristics on Runoff Generation and Soil Erosion. J. Hydrol. 2012, 424–425, 99–111.
- Mohamadi, M.A.; Kavian, A. Effects of rainfall patterns on runoff and soil erosion in field plots. Int. Soil Water Conserv. Res. 2015, 3, 273–281.
- Caracciolo, C.; Napoli, M.; Porcù, F.; Prodi, F.; Dietrich, S.; Zanchi, C.; Orlandini, S. Raindrop size distribution and soil erosion. J. Irrig. Drain. Eng. 2012, 138, 461–469.
- Carollo, F.G.; Ferro, V.; Serio, M.A. Estimating Rainfall Erosivity by Aggregated Drop Size Distributions. Hydrol. Process. 2016, 30, 2119–2128.
- Yakubu, M.L.; Yusop, Z.; Fulazzaky, M.A. The Influence of Rain Intensity on Raindrop Diameter and the Kinetics of Tropical Rainfall: Case Study of Skudai, Malaysia. Hydrol. Sci. J. 2016, 61, 944–951.
- Jevtić, L.J. Hidrologija Bujičnih Tokova; Šumarski Fakultet Univerziteta u Beogradu: Belgrade, Serbia, 1978.
- Bisal, F. The Effect of Raindrop Size and Impact Velocity on Sand-Splash. Can. J. Soil Sci. 1960, 40, 242–245.
- Bubenzer, G.D.; Jones, B.A. Drop Size and Impact Velocity Effects on the Detachment of Soils Under Simulated Rainfall. Trans. ASAE 1971, 14, 625–628.
- Helming, K. Wind speed effects on rain erosivity. In Proceedings of the Sustaining the global farm-Selected papers from the 10th International Soil Conservation Organization Meeting, West Lafayette, IN, USA, 24–29 May 1999; pp. 771–776.
- Erpul, G.; Norton, L.D.; Gabriels, D. The effect of wind on raindrop impact and rainsplash detachment. Trans. ASAE 2003, 46, 51.
- Mineo, C.; Ridolfi, E.; Moccia, B.; Russo, F.; Napolitano, F. Assessment of rainfall kinetic-energy-intensity relationships. Water 2019, 11, 1994.
- Sanchez-Moreno, J.F.; Mannaerts, C.M.; Jetten, V.; Löffler-Mang, M. Rainfall kinetic energy-intensity and rainfall momentum-intensity relationships for Cape Verde. J. Hydrol. 2012, 454–455, 131–140.
- Akinola, A.I.; Wynn-Thompson, T.; Olgun, C.G.; Mostaghimi, S.; Eick, M.J. Fluvial erosion rate of cohesive streambanks is directly related to the difference in soil and water temperatures. J. Environ. Qual. 2019, 48, 1741–1748.
- Forti, M.C.; Melfi, A.J.; Astolfo, R.; Fostier, A.H. Rainfall chemistry composition in two ecosystems in the northeastern Brazilian Amazon (Amapá State). J. Geophys. Res. Atmos. 2000, 105, 28895–28905.
- Rončević, V.; Živanović, N.; Ristić, R.; van Boxel, J.H.; Kašanin-Grubin, M. Dripping Rainfall Simulators for Soil Research—Design Review. Water 2022, 14, 3309.
- Ries, J.B.; Iserloh, T. Rainfall Simulation: Methods, Research Questions and Challenges. In Proceedings of the EGU General Assembly, Vienna, Austria, 22–27 April 2012; p. 13866.
- Yakubu, M.L.; Yusop, Z. Adaptability of Rainfall Simulators as a Research Tool on Urban Sealed Surfaces—A Review. Hydrol. Sci. J. 2017, 62, 996–1012.
- Meyer, L.D.; Harmon, W.C. Multiple-Intensity Rainfall Simulator for Erosion Research on Row Sideslopes. Trans. ASAE 1979, 22, 0100–0103.
- Dunkerley, D.L. Intra-Storm Evaporation as a Component of Canopy Interception Loss in Dryland Shrubs: Observations from Fowlers Gap, Australia. Hydrol. Process. 2008, 22, 1985–1995.
- McCalla, T.M. Water-Drop Method of Determining Stability of Soil Structure. Soil Sci. 1944, 58, 117–122.
- Gunn, R.; Kinzer, G.D. The Terminal Velocity of Fall for Water Droplets in Stagnant Air. J. Meteorol. 1949, 6, 243–248.
- Bruce-Okine, E.; Lal, R. Soil Erodibility as Determined by Raindrop Technique. Soil Sci. 1975, 119, 149–157.
- Cousen, S.M.; Farres, P.J. The Role of Moisture Content in the Stability of Soil Aggregates from a Temperate Silty Soil to Raindrop Impact. Catena 1984, 11, 313–320.
- Sharma, P.P.; Gupta, S.C. Sand Detachment by Single Raindrops of Varying Kinetic Energy and Momentum. Soil Sci. Soc. Am. J. 1989, 53, 1005–1010.
- Mouzai, L.; Bouhadef, M. Water Drop Erosivity: Effects on Soil Splash. J. Hydraul. Res. 2003, 41, 61–68.
- Malekuti, A.; Gifford, G.F. Natural Vegetation as a Source of Diffuse Salt within the Colorado River Basin. J. Am. Water Resour. Assoc. 1978, 14, 195–205.
- Kamphorst, A. A Small Rainfall Simulator for the Determination of Soil Erodibility. Neth. J. Agric. Sci. 1987, 35, 407–415.
- Harden, C.P.; Mathews, L. Rainfall Response of Degraded Soil Following Reforestation in the Copper Basin, Tennessee, USA. Environ. Manag. 2000, 26, 163–174.
- Iserloh, T.; Pegoraro, D.; Schlösser, A.; Thesing, H.; Seeger, M.; Ries, J.B. Rainfall Simulation Experiments: Influence of Water Temperature, Water Quality and Plot Design on Soil Erosion and Runoff. In Proceedings of the EGU General Assembly, Vienna, Austria, 12–17 April 2015.
- Green, T.; Houk, D.F. The Mixing of Rain with Near-Surface Water. J. Fluid Mech. 1979, 90, 569.
- Agassi, M.; Bloem, D.; Ben-Hur, M. Effect of Drop Energy and Soil and Water Chemistry on Infiltration and Erosion. Water Resour. Res. 1994, 30, 1187–1193.
- Xiao, H.; Liu, G.; Abd-Elbasit, M.A.M.; Zhang, X.C.; Liu, P.L.; Zheng, F.L.; Zhang, J.Q.; Hu, F.N. Effects of Slaking and Mechanical Breakdown on Disaggregation and Splash Erosion: Effects of Splash Erosion on Aggregate Breakdown. Eur. J. Soil Sci. 2017, 68, 797–805.
- Rončević, V.; Živanović, N.; Boxel, J.H.V.; Iserloh, T.; Antić, N. Measuring the Size of Pendant Water Drop Generated by Hypodermic Needles for Construction of Rainfall Simulator for Soil Research. Water 2023. manuscript in preparation.
- Boucher, E.A.; Evans, M.J.B. Pendent Drop Profiles and Related Capillary Phenomena. Proc. R. Soc. London. A. Math. Phys. Sci. 1975, 346, 349–374.
- Mutchler, C.K.; Moldenhauer, W.C. Applicator for Laboratory Rainfall Simulator. Trans. ASAE 1963, 6, 0220–0222.
- Lee, B.-B.; Ravindra, P.; Chan, E.-S. A Critical Review: Surface and Interfacial Tension Measurement by the Drop Weight Method. Chem. Eng. Commun. 2008, 195, 889–924.
- Portuguez, E.; Alzina, A.; Michaud, P.; Oudjedi, M.; Smith, A. Evolution of a Water Pendant Droplet: Effect of Temperature and Relative Humidity. Nat. Sci. 2017, 9, 1–20.
- Barry, P.V.; Turco, R.F.; Stott, D.E.; Bradford, J.M. Organic Polymers’ Effect on Soil Shear Strength and Detachment by Single Raindrops. Soil Sci. Soc. Am. J. 1991, 55, 799–804.
- Bissonnais, Y.L.; Singer, M.J. Crusting, Runoff, and Erosion Response to Soil Water Content and Successive Rainfalls. Soil Sci. Soc. Am. J. 1992, 56, 1898–1903.
- Black, P.E. Runoff from Watershed Models. Water Resour. Res. 1970, 6, 465–477.
- Houk, D.; Green, T. A Note on Surface Waves Due to Rain. J. Geophys. Res. 1976, 81, 4482–4484.
- Moss, A.J.; Green, T.W. Erosive Effects of the Large Water Drops (Gravity Drops) That Fall from Plants. Soil Res. 1987, 25, 9.
- Robinson, D.A.; Naghizadeh, R. The Impact of Cultivation Practice and Wheelings on Runoff Generation and Soil Erosion on the South Downs: Some Experimental Results Using Simulated Rainfall. Soil Use Manag. 1992, 8, 151–156.
- Ao, C.; Yang, P.; Zeng, W.; Chen, W.; Xu, Y.; Xu, H.; Zha, Y.; Wu, J.; Huang, J. Impact of Raindrop Diameter and Polyacrylamide Application on Runoff, Soil and Nitrogen Loss via Raindrop Splashing. Geoderma 2019, 353, 372–381.
- Wang, L.; Fang, N.F.; Yue, Z.J.; Shi, Z.H.; Hua, L. Raindrop Size and Flow Depth Control Sediment Sorting in Shallow Flows on Steep Slopes. Water Resour. Res. 2018, 54, 9978–9995.
- Magarvey, R.H.; Taylor, B.W. Apparatus for the Production of Large Water Drops. Rev. Sci. Instrum. 1956, 27, 944–947.
- Brakensiek, D.L.; Rawls, W.J.; Hamon, W.R. Application of an Infiltrometer System for Describing Infiltration into Soils. Trans. ASAE 1979, 22, 320–325.
- McQueen, I.S. Development of a Hand Portable Rainfall-Simulator Infiltrometer. Geological Survey; United States Department of the Interior: Washington, DC, USA, 1963; Volume 482.
- Bhardwaj, A.; Singh, R. Development of a Portable Rainfall Simulator Infiltrometer for Infiltration, Runoff and Erosion Studies. Agric. Water Manag. 1992, 22, 235–248.
- Cerdà, A.; Ibáñez, S.; Calvo, A. Design and Operation of a Small and Portable Rainfall Simulator for Rugged Terrain. Soil Technol. 1997, 11, 163–170.
- Ristić, R.; Malošević, D. Hidrologija Bujičnih Tokova; Univerzitet u Beogradu, Šumarski Fakultet: Belgrade Serbia, 2011.
- Pruppacher, H.R.; Klett, J.D. Microphysics of Clouds and Precipitation. Nature 2012, 284, 88.
- Blanchard, D.C. The Behavior of Water Drops at Terminal Velocity in Air. Trans. Am. Geophys. Union 1950, 31, 836.
- Rose, C.W. Soil Detachment Caused by Rainfall. Soil Sci. 1960, 89, 28–35.
- Roth, C.H.; Meyer, B.; Frede, H.-G. A Portable Rainfall Simulator for Studying Factors Affecting Runoff, Infiltration and Soil Loss. Catena 1985, 12, 79–85.
- Thompson, A.L.; James, L.G. Water Droplet Impact and Its Effect on Infiltration. Trans. ASAE 1985, 28, 1506–1510.
- Regmi, T.P.; Thompson, A.L. Rainfall Simulator for Laboratory Studies. Appl. Eng. Agric. 2000, 16, 641–647.
- Brandt, C.J. Simulation of the Size Distribution and Erosivity of Raindrops and Throughfall Drops. Earth Surf. Process. Landf. 1990, 15, 687–698.
- Carollo, F.G.; Ferro, V.; Serio, M.A. Predicting Rainfall Erosivity by Momentum and Kinetic Energy in Mediterranean Environment. J. Hydrol. 2018, 560, 173–183.
- Nyssen, J.; Vandenreyken, H.; Poesen, J.; Moeyersons, J.; Deckers, J.; Haile, M.; Salles, C.; Govers, G. Rainfall Erosivity and Variability in the Northern Ethiopian Highlands. J. Hydrol. 2005, 311, 172–187.
- Laws, J.O.; Parsons, D.A. The Relation of Raindrop-Size to Intensity. Trans. Am. Geophys. Union 1943, 24, 452.
- Atlas, D. OPTICAL EXTINCTION by RAINFALL. J. Meteorol. 1953, 10, 486–488.
- Zanchi, C.; Torri, D. Evaluation of Rainfall Energy in Central Italy. Assessment of Erosion; John Wiley and Sons Ltd.: Hoboken, NJ, USA, 1980; pp. 133–142.
- Jayawardena, A.W.; Rezaur, R.B. Drop Size Distribution and Kinetic Energy Load of Rainstorms in Hong Kong. Hydrol. Process. 2000, 14, 1069–1082.
- Hudson, N.W. Soil Conservation; Scientific Publishers: New Delhi, India, 2015.
- Carter, C.E.; Greer, J.D.; Braud, H.J.; Floyd, J.M. Raindrop Characteristics in South Central United States. Trans. ASAE 1974, 17, 1033–1037.
- Kinnell, P.I.A. Rainfall Intensity-Kinetic Energy Relationships for Soil Loss Prediction1. Soil Sci. Soc. Am. J. 1981, 45, 153.
- Rosewell, C.J. Rainfall Kinetic Energy in Eastern Australia. J. Clim. Appl. Meteorol. 1986, 25, 1695–1701.
- Brown, L.C.; Foster, G.R. Storm Erosivity Using Idealized Intensity Distributions. Trans. ASAE 1987, 30, 0379–0386.
- Carollo, F.G.; Ferro, V.; Serio, M.A. Reliability of Rainfall Kinetic Power-Intensity Relationships. Hydrol. Process. 2017, 31, 1293–1300.
- Hudson, N.W. The Influence of Rainfall on the Mechanics of Soil Erosion: With Particular Reference to Southern Rhodesia; University of Cape Town: Cape Town, South Africa, 1965.
- Assouline, S.; Mualem, Y. The Similarity of Regional Rainfall: A Dimensionless Model of Drop Size Distribution. Trans. ASAE 1989, 32, 1216–1222.
- Van Dijk, A.I.J.M.; Bruijnzeel, L.A.; Rosewell, C.J. Rainfall Intensity-Kinetic Energy Relationships: A Critical Literature Appraisal. J. Hydrol. 2002, 261, 1–23.
- Cerdá, A. Rainfall Drop Size Distribution in the Western Mediterranean Basin, València, Spain. CATENA 1997, 30, 169–182.
- Brandt, C.J. The Size Distribution of Throughfall Drops under Vegetation Canopies. CATENA 1989, 16, 507–524.
- Coutinho, M.A.; Tomás, P.P. Characterization of Raindrop Size Distributions at the Vale Formoso Experimental Erosion Center. CATENA 1995, 25, 187–197.
- Meshesha, D.T.; Tsunekawa, A.; Haregeweyn, N. Influence of Raindrop Size on Rainfall Intensity, Kinetic Energy, and Erosivity in a Sub-Humid Tropical Area: A Case Study in the Northern Highlands of Ethiopia. Theor. Appl. Climatol. 2019, 136, 1221–1231.
- Mueller, E.A.; Sims, A.L. Raindrop Distributions at Island Beach, New Jersey; Atmospheric Sciences Laboratory, US Army Electronics Command: Fort Monmouth, NJ, USA, 1967.
- Mueller, E.A.; Sims, A.L. Raindrop Distributions at Corvallis, Oregon; US Army Electronics Command: Fort Monmouth, NJ, USA, 1968.
- Mason, B.J.; Andrews, J.B. Drop-Size Distributions from Various Types of Rain. Q. J. R. Meteorol. Soc. 1960, 86, 346–353.
- Sauvageot, H.; Lacaux, J.-P. The Shape of Averaged Drop Size Distributions. J. Atmos. Sci. 1995, 52, 1070–1083.
- McCool, D.K.; Williams, J.D.; Morse, J.R. Raindrop Characteristics in the Pacific Northwest. In Proceedings of the ASABE Annual International Meeting, Reno, NV, USA, 21–14 June 2009.
- Van Boxel, J.H. Numerical Model for the Fall Speed of Rain Drops in a Rain Fall Simulator. In Proceedings of the Workshop on Wind and Water Erosion, Ghent, Belgium, 17–18 November 1997; pp. 77–85.
- Laws, J.O. Measurements of the Fall-Velocity of Water -Drops and Raindrops. Trans. Am. Geophys. Union 1941, 22, 709.
- Best, A.C. The Size Distribution of Raindrops. Q. J. R. Meteorol. Soc. 1950, 76, 16–36.
- Beard, K.V.; Pruppacher, H.R. A Determination of the Terminal Velocity and Drag of Small Water Drops by Means of a Wind Tunnel. J. Atmos. Sci. 1969, 26, 1066–1072.
- Uplinger, W.G. A New Formula for Raindrop Terminal Velocity. In Proceedings of the 20th Conference on Radar Meteorology, Boston, MA, USA, 30 November–3 December 1981; pp. 389–391.