 +1 credit
| Version | Summary | Created by | Modification | Content Size | Created at | Operation |
|---|---|---|---|---|---|---|
| 1 | Manfred Kunz | + 5264 word(s) | 5264 | 2021-02-08 10:33:28 | | | |
| 2 | Vivi Li | + 9 word(s) | 5273 | 2021-02-25 10:39:09 | | |
Video Upload Options
Cellular heterogeneity is regarded as a major factor for treatment response and resistance in a variety of malignant tumors, including malignant melanoma. More recent developments of single-cell sequencing technology provided deeper insights into this phenomenon. Single-cell data were used to identify prognostic subtypes of melanoma tumors, with a special emphasis on immune cells and fibroblasts in the tumor microenvironment. Moreover, treatment resistance to checkpoint inhibitor therapy has been shown to be associated with a set of differentially expressed immune cell signatures unraveling new targetable intracellular signaling pathways. Characterization of T cell states under checkpoint inhibitor treatment showed that exhausted CD8+ T cell types in melanoma lesions still have a high proliferative index. Other studies identified treatment resistance mechanisms to targeted treatment against the mutated BRAF serine/threonine protein kinase including repression of the melanoma differentiation gene microphthalmia-associated transcription factor (MITF) and induction of AXL receptor tyrosine kinase. Interestingly, treatment resistance mechanisms not only included selection processes of pre-existing subclones but also transition between different states of gene expression. Taken together, single-cell technology has provided deeper insights into melanoma biology and has put forward our understanding of the role of tumor heterogeneity and transcriptional plasticity, which may impact on innovative clinical trial designs and experimental approaches.
1. Melanoma Biology, Clinics and Treatment
Melanoma is a highly aggressive cutaneous neoplasia, which has been intensively analyzed by molecular techniques in the past few years [1][2]. Indeed, a number of mutational analyses have been performed and identified key driver mutations among which mutant BRAFV600 is the most prevalent, affecting almost 50% of all melanoma patients [3][4][5]. Mutant BRAFV600 leads to an activation of the classical mitogen-activated protein kinase (MAPK) pathway with downstream targets being mitogen-activated extracellular signal-regulated kinases (MEK) 1/2 and extracellular-signal regulated kinases (ERK) 1/2. Promising treatment responses were obtained by targeting this pathway on the level of BRAF kinase and MEK1/2, which has been a mainstay of melanoma therapy in recent years [1][2][6]. BRAF-targeted treatment includes small molecule inhibitors vemurafenib, dabrafenib, and encorafenib, directed against activated (mutated) BRAF kinase, which has significantly improved the survival rate of affected patients. Overall treatment success is hampered by the fact that a significant number of patients show primary resistance (~20%) and also secondary resistance, which occurs in the vast majority of patients. The currently used treatment options mainly consist of combination treatments of BRAF inhibition combined with MEK1/2 inhibition, which is not only more effective but also reduces side effects such as the development of epidermal neoplasias and exanthemas [7]. Cobimetinib, trametinib, and binimetinib are currently used as MEK1/2 inhibitors in combination therapy. The 5-year overall survival rate of combination therapy has reached 50%, which may be regarded as a major breakthrough for this highly aggressive tumor [7]. Still, the majority of patients develop a secondary resistance [8]. More recently, adjuvant treatment after complete tumor eradication in stage III (lymph node metastasis) has been approved using this combination of treatment, and neo-adjuvant (pre-operation) treatment studies are under way [9][10].
The mechanisms underlying primary and secondary resistance to targeted treatment have been an area of intensive investigations in recent years [11][12][13][14][15][16][17][18][19][20][21][22]. Among the most prominent cellular mechanisms are switches to NRAS mutations [14][16][22], aberrant BRAF splicing [13][14], BRAF amplifications [11][12][14][15][16], MAP2K1 (MEK1) mutations [12][16], PTEN and PIK3CA mutations [16], and COT overexpression [20].
Principally, mechanisms of treatment resistance are heterogeneous but show many overlapping patterns in different studies. An earlier study found NRAS and PDGFR overexpression in a number of melanoma cell lines after development of treatment resistance to BRAF inhibitor PLX4032 in vitro [22]. In one of the most comprehensive subsequent studies, 45 patients were analyzed by whole-exome sequencing before BRAF inhibitor (vemurafenib or dabrafenib) treatment, after early (less than 12 weeks) and late development of resistance [16]. Top resistance variants were NRAS mutations, BRAF amplifications, MEK1 and MEK2 mutations, and PTEN mutations/amplifications. MEK1 and PTEN mutations were partly already present before treatment.
Studies on transcriptional mechanisms of primary resistance to targeted treatment revealed a MITF-low/NF-κB-high transcriptional phenotype which could be linked to specific gene expression profiles in cell lines and patient biopsies, and a MITF-low/AXL-high phenotype [19][21]. In vitro, combined treatment of cell lines with BRAF inhibition and an AXL inhibitor significantly reduced melanoma cell viability of MITF-low/AXL-high cells, supporting the functional relevance of these findings [19]. In a large-scale study using RNA-sequencing of metastatic melanoma samples, transcriptomic patterns of 48 single-drug or double-drug disease progressors were compared with patient-matched baseline melanoma tissues [17]. Transcriptomic patterns of treatment resistance involved differential gene expression of tumor and stromal genes. Among up-regulated genes in resistant lesions were c-MET, IL-8, c-FOS, macrophage marker CD163, chemokine CCL8, and NFKBIA.
However, these transcriptional mechanisms are incompletely understood as the underlying data mostly originates from bulk sequencing studies; thus, they do not reflect clonal structures and are only partly recapitulating selection processes. Overall, primary and secondary resistance mechanisms to targeted therapy may be either due to genetic changes (mutations, amplifications) or changes in gene expression of specific pathways [23].
Major progress was made in the field of immunotherapies in melanoma. Immunotherapies, in particular immunecheckpoint inhibition (ICI), targeting the cytotoxic T lymphocyte antigen 4 (CTLA-4), programmed cell death protein 1 (PD-1), and programmed cell death protein ligand 1 (PD-L1) have been approved in recent years in a number of different cancers including malignant melanoma [24]. However, a larger number of patients did not respond to these treatments (60% in case of PD-1 inhibition, 80% for CTLA-4 inhibition) as a primary resistance. Treatment response rates could slightly be enhanced by a combination of anti-PD1 and anti-CTLA4 treatment [25].
The underlying mechanisms for primary and secondary treatment resistance to immunotherapies have been studied in recent years and include a number of different mechanisms [26]. In one of the earliest studies addressing this issue, immune markers of anti-CTLA4 treatment response of melanoma patients were analyzed [27]. Pre-treatment tumors of overall 110 patients were analyzed by whole-exome sequencing. Transcriptome data were generated for 40 patients. Mutational load, neoantigen load, and transcriptomes of cytolytic activity were associated with treatment response. Enhanced expression of granzyme A (GRZMA) and perforin 1 (PRF1) were associated with responses, as were CTLA-4 and PD-L2 expression. In a parallel study of another group, melanoma exomes from 64 patients treated with CTLA-4-blocking antibodies were analyzed by whole-exome sequencing [28]. Mutational load alone was not sufficient to predict treatment benefit. Neoepitope analysis identified neoantigen landscapes with a strong treatment response. Further, the predicted neoantigens were able to activate T cells from patients treated with anti-CTLA4 antibodies in in vitro experiments.
Hugo and co-workers performed a large-scale study on 28 metastatic melanoma lesions, 27 of which were pre-treatment lesions, and analyzed gene expression patterns of responding versus non-responding lesions [29]. Overall, the mutational load of tumors correlated with patient survival (but not with tumor response). Among the genes that were upregulated in non-responding lesions were mesenchymal transition genes such as AXL, WNT5A, and TWIST, as well as immunosuppressive genes such as IL10, VEGFA, and VEGFC. Resistant lesions showed a gene expression signature called IPRES (innate anti-PD1 resistance), which is comprised of 26 transcriptomic signatures including mesenchymal transition, wound healing, and angiogenesis.
In a first study on secondary treatment resistance, samples from paired baseline and relapsing lesions in four patients were analyzed [30]. By use of whole-exome sequencing it was shown that resistant lesions in two patients carried mutations in interferon-receptor-associated Janus kinase 1 (JAK1) or Janus kinase 2 (JAK2) genes, associated with the deletion of the wild-type allele. A third patient showed a truncating mutation in the beta-2-microglobulin (B2M) gene, which is part of the MHC-I complex.
In a later large-scale analysis of treatment resistance, 54 samples with CTLA4- blockade followed by anti-PD1 treatment were analyzed by a 12-marker immunohistochemistry panel and NanoString® technology (of 795 immune-related genes) (nanoString, Seattle, WA, USA) [31]. This study showed that individual protein markers and gene expression patterns in early on-treatment biopsies were predictive of responses for the checkpoint blockage. Among markers for treatment response to anti-PD1 treatment were CD8, CD4, CD3, PD-1, PD-L1, and LAG3 protein expression in responders versus non-responders in early on-treatment samples. In the NanoString® analyses of response to anti-PD1 treatment, up-regulation of HLA-molecules, IFN-γ pathway effectors, and different chemokines were observed.
In a subsequent study, 68 patients with advanced melanoma were investigated before and after anti-PD-1 treatment by whole-exome and transcriptome analysis [32]. Responders under treatment experienced a so-called mutation contraction, which means that the number of clonal and subclonal variants decreased on therapy in these patients. Transcriptomic analyses showed an increase in gene expressions patterns of CD8+ T cells, NK cells, and M1 macrophages in responders as compared to non-responders.
Recently, pre-treatment tumors taken from 144 metastatic melanoma patient were analyzed by whole-exome and whole-transcriptome sequencing, and mutational and transcriptomic features were assessed for correlation with response to anti-PD1 treatment [33]. Interestingly, there was no significant association of specific gene mutations to response or resistance to treatment. Regarding gene expression, 4 of the 13 MHC-II associated HLA genes were significantly upregulated in responders. Significantly enriched pathways in responders were IFN-γ response, allograft rejection, complement, inflammatory response, and interleukin (IL6)-JAK-STAT3 signaling. Signatures for T cells, B cells, macrophages, CD8+ cytotoxic, and exhausted CD4+ T cells were also enriched. Interestingly, there were differences between patients with previous exposure to anti-CTLA4 treatment and those who were naïve to this treatment with a higher expression of immune-related pathways in in responders of the anti-CTLA4 pre-treated group. Among prominent immune genes were CXCL9, CXCL10, and CXCR3, among prominent immune markers were CD20, CD163, CD4, FOXP3, and CTLA-4.
2. Clonal Heterogeneity in Melanoma
Clonal heterogeneity is currently regarded as one of the most relevant factors for treatment resistance and recurrence of malignant tumors [34]. The model of a clonal evolution of tumors with many molecularly heterogeneous subclones had been suggested in earlier reports, at a time when the molecular basis of tumor heterogeneity could not be analyzed in more detail [35]. Based on current knowledge, many of the recurrences and treatment failures of metastatic tumors derive at least in part from this clonal heterogeneity in tumor lesions consisting of different molecular subclones [36][37].
In melanoma, intra-tumor heterogeneity has been described for the presence or absence of BRAF mutations, but more detailed analyses on mutational patterns were still lacking at that time [38].
The molecular heterogeneity in melanoma lesions has been analyzed recently in more detail by use of whole-genome sequencing of distinct macrodissected tumor areas of primary melanomas and metastases [39]. In this study, 8 melanoma samples of primary melanomas and lymph node metastases were analyzed with multiregion sequencing of 41 regions. On average, 489 non-synonymous mutations were observed of which 13% were heterogeneously distributed. MAPK pathway genes (BRAF, NRAS, and NF1) were frequently mutated throughout all tumor regions (truncal mutations). Mutational tumor heterogeneity was associated with patient survival, with higher heterogeneity leading to shorter overall survival in this limited cohort of patients. Phylogenetic trees showed that 88% of driver mutations as derived from the catalogue of somatic mutations in cancer (Cosmic) database were truncal mutations, supporting their role in melanoma biology. Further analyses with larger sample sets and consecutive biopsies may help to understand the biological and clinical impact of this intra-tumor heterogeneity. Heterogeneously distributed mutations were found in subclones for PIK3CA, PIK3R1, PTEN, MSN, JAK2, JAK3, NOTCH2, and IDH1, with little overlap between the different samples.
In a subsequent study, authors compared mutational patterns of melanomas with signs of chronic sun damage (CSD melanomas) with high and low sun damage [40]. Ultra-deep sequencing was performed for 72 in situ and invasive melanomas for 40 cancer-associated genes. One sample set of an individual patient was analyzed in more detail regarding 5 regions in the primary tumor and 7 in in-transit metastases. There were no significant differences regarding the transcriptomes as determined by RNA-seq. Whole-exome sequencing showed that the vast majority of all mutation (96%) were found in all lesions and were regarded as truncal mutations, which comprised KIT and CTNN1 mutations. In total, 60 genes were carrying non-truncal mutations, only four (COL3A1, CTNNB1, FOXO3, and SRC1) belonged to the Cancer Gene Census (https://cancer.sanger.ac.uk/census), and the majority was thus regarded as passenger mutations. Interestingly, phylogenetic trees showed that mutations in primary lesions did not appear earlier than in in-transit metastases.
In a recent paper on melanoma, tumor heterogeneity has been simulated in vivo by an admixture of 0.05% of A375 BRAF inhibitor-resistant melanoma cells to 99.95% of A375 BRAF inhibitor-sensitive melanoma cells [41]. This mixture was subcutaneously injected into mice. After treatment with the BRAF inhibitor vemurafenib, the number of resistant cells significantly increased in the overall regressing tumors, basically laying the foundations for relapse and secondary resistance of these tumors [41]. This phenomenon is in agreement with clinical findings for metastatic melanomas. However, based on current knowledge, selection of subclonal populations during treatment response are not the only mechanisms that support treatment resistance. Resistance may also derive from drug-induced re-programming [42].
The prognostic relevance of intra-tumor heterogeneity has recently been emphasized, as higher heterogeneity was associated with worse outcomes [43]. Authors used a clonal heterogeneity analysis tool (CHAT) to estimate intra-tumor heterogeneity, and CIBERSORT to analyze the immune cell composition from a cohort of 402 melanoma patients of TCGA [43][44]. More heterogeneous tumors were associated with gene patterns indicating less CD8+ T cells, T follicular cells, and M1 macrophages, while gene patterns of tumor-promoting M2 macrophages were enhanced. Highly heterogeneous tumors also had lower PD1 and PD-L1 expression and a lower expression of genes of cytotoxic pathways. These data were confirmed by others, showing that indeed intra-tumor heterogeneity plays an important role in patient survival, a finding that was further validated in a murine melanoma model with B16 melanoma cells [45].
Taken together, the mentioned studies have provided strong evidence for a prognostically relevant genetic heterogeneity in melanoma, either in primary lesions or in metastases. A deeper understanding of this heterogeneity may be achieved by recently developed single-cell technologies.
3. Single-Cell Analyses in Melanoma
3.1. Primary Melanomas, Lymph Node Metastases and Cell Lines
scRNA-seq has been applied in a significant number of studies on malignant melanoma (Table 1; Figure 2). The first major scRNA-seq study analyzing melanoma tissues investigated 19 samples of primary melanomas and metastatic lesions [46]. A significant inter-tumor heterogeneity was observed for melanoma cells in these tissues, while the immune cells in these analyses showed a relative homogeneous gene expression pattern [46]. Major subgroups of transcriptional heterogeneity were associated with cell cycle, spatial context of cells, and a drug-resistance program (MITF-low/AXL-high signature). Authors used single-cell signatures of T cell, B cells, fibroblasts, macrophages, and endothelial cells derived from this study and mapped them onto gene patterns of bulk sequences of 471 melanoma samples present in the Cancer Genome Atlas (TCGA). They then searched for genes expressed by cells of one type that may influence or reflect the proportion of cells of a different cell type in the tumor. By this means they showed that the abundance of cancer-associated fibroblasts (CAF) is predictive of the phenotype, and that fibroblast signatures influence the presence of specific immune cell signatures. Moreover, they identified single cells with an AXL-high/MITF-low signature in an AXL-low/MITF-high population, which would have been missed in bulk sequencing and may give rise to treatment resistance. The AXL/MITF dichotomy has been supported by a later study re-analyzing these data by a new software called Cyclum to identify latent periodic developmental processes [47].
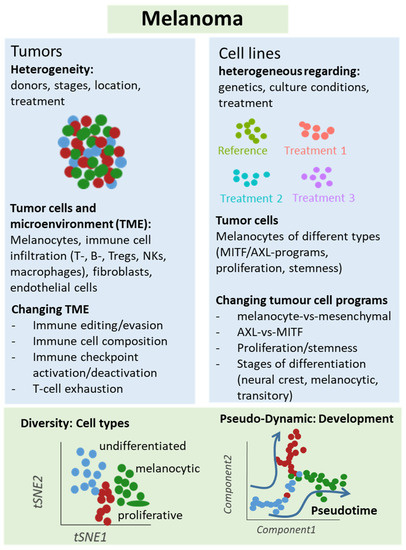
Figure 2. Schematic representation of single-cell analyses in melanoma samples. Either melanoma tumors or cell lines underwent single-cell sequencing analyses, which unraveled different types of cells and levels of heterogeneity in melanoma lesions and mechanisms of treatment resistance, e.g., mediated by T cell exclusion or T cell exhaustion programs under immune checkpoint therapy. Changes in cellular programs in tumor cells were also identified in cell culture studies supporting a role of the dichotomy of the AXL and MITF programs for treatment response and resistance.
Table 1. Summary of single-cell melanoma transcriptomics and proteomics studies and main outcome.
| No | Melanoma Samples | Experimental or Clinical Set-Up | Characteristics of Clonal Structure | Main Findings | References |
|---|---|---|---|---|---|
| 1. | Primary melanomas and metastases (n = 19) |
Untreated | Clonal signatures of cell cycle, spatial context, drug-resistance programs | Presence of AXL-high/MITF-low population in a AXL-low/ MITF-high cluster; single-cell signatures with prognostic relevance | [46] |
| 2. | Melanoma cell lines representing different stages of differentiation (n = 8) |
Untreated | Cell clones with SOX9 and SOX10 high expression and transitional cells, knockdown of SOX10 affects clonal structure | Transition between gene networks instead of selection of individual clones (transcriptional plasticity) | [48] |
| 3. | Melanoma short-term cultures (BRAF and/or NRAS mutant) (n = 3) |
Untreated | Clonal structure of cell cycle, stromal, OxPhos, pigmentation genes | Four different clonal structures with additional subclonal structures and stem cell-like subclones | [49] |
| 4. | Samples from 32 metastatic melanoma patients (n = 48) |
Anti-PD1 inhibitor treatment of patients, either alone or in combination with anti-CTLA4 treatment | CD8+ T cells clones consisted of memory/survival (TCF7+) and exhaustion (CD38+) clones, respectively | TCF7+/CD8+ T cells are crucial for treatment response | [50] |
| 5. | Human melanoma samples (n = 33) |
Clinical samples under anti-CTLA4 treatment | Clonal immune exclusion program: CDK4/CDK6 expression, JAK-STAT3 signaling, TNF pathway, senescence-associated programs, Myc targets | CDK4/CDK6 inhibitor treatment of resistant clones improved survival of mice in a murine melanoma model | [51] |
| 6. | Human melanoma samples (n = 25) |
Anti-PD-1 inhibitor treatment of patients, either alone or in combination with anti-CTLA4 treatment | CD4+/CD8+ T cells with clusters of resting, transitional and exhausted T cells | Dysfunctional (exhausted) CD8+ T cells are still proliferative and showed tumor reactivity ex vivo | [52] |
| 7. | Tumor tissue of melanoma cell line mouse xenografts (minimal residual disease) (n = 3) |
Murine xenograft model, BRAFi treatment | Minimal residual disease with 4 different transcriptional subpopulations (pigmented, SMC, NCSC, invasive cells) | Enrichment of neuronal stem cells population after BRAFi treatment; successful treatment with retinoid receptor inhibitor | [53] |
| 8. | A375 and 451Lu melanoma cell lines (n = 2) |
BRAFi treatment | Patterns of resistance are present in parental cells and vice versa | Identification of a pre-resistant state at the tip of the parental population | [64] |
| 9. | Melanoma cell line A375 (n = 1) |
BRAFi treatment after CRISPR/Cas interference with MAPK pathway | Clonal selection of treatment resistant clones | Resistance-mediating positions in MAPK genes were mostly located around MEK1E203K or KRASQ61 | [54] |
| 10. | BRAF-mutant melanoma cell lines (n = 3) |
BRAFi treatment; testing of 13 different proteomic markers with single-cell barcode chip technology | Increased clonal heterogeneity under treatment | Activation of MEK/ERK and NF-κB p65 signaling in resitant clones; NF-κB inhibitor increased sensitivity of cells | [55] |
| 11. | BRAF-mutant melanoma cell line (n = 1) |
BRAFi treatment; testing of 19 different proteomic markers with single-cell barcode chip technology | Drug-induced clonal cell states changes with NGFR/AXL or MITF, MART1 patterns | Two different trajectories of treatment resistance of MITF-high and MITF- low cells | [56] |
Abbreviations: BRAFi, BRAF inhibitor; SMC, starved-like melanoma cells, NCSC, neural crest stem cells; MAPK, mitogen-activated protein kinases; NGFR, nerve growth factor receptor; MITF, microphthalmia-associated transcription factor.
Our group has analyzed the transcriptomes of 92 single cells cultured from a patient biopsy of a BRAF wild type/NRAS wild type melanoma metastasis by scRNA-seq [49]. We used self-organizing maps (SOM) to identify sub-clones and found gene patterns of proliferation, oxidative phosphorylation, pigmentation, and cellular stroma [49]. These categories could be further refined, especially regarding cell cycle genes referring to different stages of cell cycle such as G1, S, and G2/M phase. In principle, every cell showed an individual gene pattern. Interestingly, gene expression patterns overlapped with those of clinical gene expression studies with associated patient survival data, further emphasizing the clinical relevance of these single-cell analyses [48]. Cellular heterogeneity was less pronounced in BRAF mutant/NRAS wild type and BRAF wild type/NRAS mutant cultures. In order to identify new treatment options based on gene expression patterns, kinome expression patterns across sub-populations were analyzed. Cell cycle kinases CDK4 and CDK2 were consistently highly expressed in a majority of cells, suggesting that both might be interesting targets. Indeed, treatment of melanoma cell cultures cells with CDK4 inhibitor palbociclib reduced cell proliferation to a similar extent as MAPK inhibitors. Finally, a low abundant subclone with high expression of an ABC transporter module, surface markers CD271 and CD133, and multiple aldehyde dehydrogenases (ALDHs), was identified. These findings support a role of cancer stem cells in melanoma biology, which has been described for other tumor entities [57][58]. Thus, single-cell gene expression patterns may provide new treatment targets above BRAF/MAPK inhibitor treatment.
3.2. Treatment Resistance Under Immune Checkpoint Inhibition
Analysis of treatment resistance and response has been a focus area of a number of single-cell studies [50][51][52][55]. In one of the earlier studies, scRNA-seq analyses were performed for 33 human melanoma tumors, and a T cell signature was identified that allowed to classify hundreds of bulk-sequenced tumors as tumors harboring a seed (T-cell)-exclusion program [51]. This exclusion program was then mapped onto ipilimumab and anti-PD1 treated samples analyzed by scRNA-seq to identify co-expressed genes in individual cells. The T cell exclusion program included transcriptional patterns of apoptosis, JAK-STAT3 signaling, TNF pathway, senescence-association, Myc targets, and p53 binding. Indeed, melanoma lesions expressed features of this program as determined by multicolor immunofluorescence. Among the genes tested were TP53 (up), JUN (down), MYC (up), and HLA-A (down). The presence of the treatment resistance program also correlated with checkpoint inhibitor response in melanoma patients in an independent sample set. Finally, blockage of CDK4/CDK6 kinases, which were part of the resistance program, inhibited melanoma cells growth in vitro and in vivo in a melanoma mouse model. Taken together, single-cell analyses allowed the identification of a malignant cell program that is associated with T cell exclusion and is predictive for checkpoint inhibitor resistance that maybe targeted by CDK4/CDK6 inhibition.
In another study, single-cell transcriptomes were generated via 48 tumor samples from 32 metastatic melanoma patients using a Smart-seq2 protocol [50]. Biopsies were taken at baseline and under anti-PD1 inhibitor treatment, either alone or in combination with anti-CTLA4 treatment, including two patients with anti-CTLA4 treatment alone. CD45+ cells were used to define an 11-cluster transcriptomic pattern. Two clusters were more prominent in responder lesions and in non-responder lesions. Treatment resistant clusters were enriched for genes linked T cell exhaustion (LAG3, PDCD1, HAVCR2, TIGIT, CD38) and cell cycle genes (CDK1, CCNB1, MKI67, and CDK4). Individual markers of responders were LTB, TCF7, and CCR7, and of non-responders were CCL3, CD38, and HAVCR2. Authors then focused their analyses on CD8+ T cells, which consisted of two clonal states, memory/survival state, and exhaustion state, called CD8_G and CD8_B cells, respectively. Prominent populations of response were TCF7+/CD8+ T cells (TCF7 is part of Wnt signaling and crucial for differentiation and self-renewal). Further analysis via cell-sorting showed that CD39/TIM3 discriminated exhausted from memory/effector cells, which was verified in a B16-F10 murine melanoma model. T cell receptor (TCR) analysis showed that enriched TCRs were more common in exhausted clusters. Together, this study may help to select patients for anti-PD1 therapy based on subclonal T cell states, which may be of relevance for clinical trials.
A more recent study focused on dysfunctional T cells in melanoma lesions under immune checkpoint therapy [52]. In this study, 25 melanoma samples were analyzed by scRNA-seq with a focus on CD4+ and CD8 T+ cells in patients with prior treatment against CTLA-4 or PD-1, or a combination of both. Immune cell subtypes were widely shared across patients, but their relative abundance differed considerably between patients, even when disease stage and treatment background were matched. In particular, CD8+ T cells partly transitioned into a dysfunctional T cell pool characterized by the expression of PDCD1, LAG3, and molecules shared with CD4+ Treg (e.g., CSF1, ZBED2). Interestingly, however, single-cell TCR sequencing and expression of cell cycle genes showed that these so-called dysfunctional T cells had the highest levels of clonal expansion. Ex vivo cultured tumor-infiltrating lymphocytes (TIL) from melanoma patients showed that tumor reactivity correlated with a CD8+ T cell dysfunctional state. Collectively, these data suggests that the dysfunctional CD8+ T cells are dynamically differentiating and are an active cell compartment with tumor reactivity in patients. Models of regulation of this T cell compartment should help to create innovative treatment approaches.
These data were partly re-analyzed (8 non-treated melanoma patients) in a subsequent study [59]. Here, authors addressed the question of a spatiotemporal activity of IFN-γ as a major mediator of tumor immunity. First, a Myc-driven B cell lymphoma and a B16F10 murine tumor model were used. When injecting OVA antigen-positive and negative B16F10 melanoma cells into mice, mosaic tumors were generated. By co-injection of CD8+ OVA-specific T cells, a homogenous expression of MHC class I, and PD-L1 upregulation on tumor cells was induced, irrespective of a close proximity of T cells and melanoma cells, supporting the notion of a distant activity of immune cells. As mentioned, by reanalysis of the abovementioned clinical single-cell data, it was shown that CD8+ T cells are indeed the major source of IFN-γ, and interferon-signatures were found in different cell populations such as macrophages and neutrophils (melanoma cells were sparse in these samples). These findings suggest that tumor cells in human melanomas might also be targeted by distant immune cells in the microenvironment.
3.3. Treatment Resistance under Targeted Treatment
To identify markers of resistance against BRAF inhibitor (BRAFi) treatment, a new analysis software was developed that outperformed existing platforms regarding large complex substructures and large numbers of sampled cells [60]. The software was termed SAKE, which stands for scRNA-seq analysis and klustering evaluation. To further test this software, melanoma cell lines 451Lu and A375 were analyzed either as parental or BRAF inhibitor (vemurafenib)-resistant cells. t-SNE analysis showed that four populations may be separated, but individual cell clones with gene patterns of parental cells existed in resistant cells and vice versa (without obvious enrichment). By use of differential gene expression analysis the major differentially expressed gene with upregulation in resistant cells was shown to be DCT (dopachrome tautomerase). Sorting of cells from parental cells revealed that DCT-enriched cells were more resistant to BRAF inhibition than the whole culture. In a final set of experiments, authors observed a transitional population characterized by ENT5A, AXL, GFR, PDGFRB, and JUN expression, which was localized at the tip of the parental population proximal to the resistant population, indicating a pre-resistant state as described earlier by others [42]. Without prior knowledge, SAKE identified this intermediate population, characterized by AXL, JUN, NGFR, WNT5A, FGFR1, and NRG1 expression. By testing of copy number variations in single cells as a surrogate marker for genetic heterogeneity, it was found that this transitional (pre-resistant) population was derived from several unrelated clonal lineages and most likely reflects a transient stage rather than a particular clone. Taken together, DCT was identified as a marker for individual resistant clones in untreated populations and together with mechanisms of transient gene regulation towards resistance may be an interesting therapeutic target.
In another report, CRISPR RNA-guided deaminase technology was combined with CROP-seq (CRISPR droplet sequencing) technology to introduce mutations in 3 genes of the MAPK pathway in A375 melanoma cells, namely NRAS, KRAS and MAP2K1 (MEK1) [54]. Overall, 420 sgRNAs were introduced into the melanoma cells. Subsequent drug response was tested against BRAF inhibitor vemurafenib. Enrichment of individual sgRNAs under treatment indicated treatment resistance. Most positive findings referred to sgRNAs targeting MEK1 in the E203 codon region, which is a well-known resistance region. Apart from this, the most significant results were observed for mutations induced in the vicinity of Q61 in the KRAS gene, which has already been shown in other studies. Further transcriptomic analysis of resistant clones showed enhanced expression for CD74, HLA-DRA, SLC26A2, HLA-DRB1, FOS, and HLA-DPA1 for MEK1E203K-related clones and CXCL1, IL-8, CXCL2, SOD2, and CCL2 for KRASQ61-related clones. Taken together, this study established a new platform that may be extended to other target genes and tumor entities to uncover mechanisms of resistance to targeted treatment.
In a recent report, an experimental setting is described recapitulating minimal residual disease after targeted treatment. In this study, subcutaneously injected mice with BRAFV600E mutant melanoma cells were treated with BRAF inhibitor dabrafenib [53]. Single-cell analyses were performed for minimal residual disease after transplanted tumors regressed under treatment. In the subclonal structure of minimal residual disease, for 4 different cell states were enriched such as NCSC (neural crest stem cells), invasive cells, SMC (starved-like melanoma cells), and pigmented cells, among which SMC showed the most significant enrichment under treatment. Single cell trajectories as derived from pseudotime analyses showed that an early proliferative state developed via two different developmental trajectories into NCSC and SMC cells. By use of multiplexed immunohistochemistry (IHC) of melanoma lesions, it was demonstrated that murine melanoma xenografts showed a specific spatial pattern for the different cell states marked by different discriminative markers. In further in vitro experiments, the transition into the NCSC state was cell-autonomous and reversible, tested by drug exposure and subsequent drug removal. Finally, computational analysis of gene regulatory networks showed that another component of the gene regulatory network of minimal residual disease is the retinoid X receptor-γ. Consequently, inhibition of this receptor by the small molecule inhibitor HX531 led to significantly longer survival of mice under dabrafenib treatment, with a significant percentage (20%) of mice being tumor-free even after 4 months of treatment. Together, treatment resistance appears to develop along different developmental trajectories identified by single-cell transcriptomics, a finding which may be exploited for new treatment approaches.
In a study on BRAFi treatment of different melanoma cell lines, RNA-seq data of 18 melanoma cell lines were included [55]. Nine cell lines were used to define different levels of BRAFi sensitivity. Drug resistant cells showed a low melanocytic cell signature, and elevated levels of neural crest and mesenchymal genes as well as genes of activated JNK and NF-κB pathways. Based on the analysis of different NGFR and MRT-1 expression, a cluster of highly plastic cell lines under BRAFi treatment of brief (3d) or prolonged (71–90 d) inhibition was defined. These cells developed signatures of NCSC and epithelial-to-mesenchymal transition genes and genes of elevated invasiveness and migration. Using a Markov model for prediction, authors showed that the clusters underwent both cell state interconversion and drug selection. In a subsequent single-cell analysis, single-cell barcode chip technology (SNBC) was used to analyze 13 different proteomic markers (including NGFR, TNFR, MART-1, JNK, pERK, and pNF-κB p65). It was demonstrated for one of these cell lines that BRAFi treatment increased cellular heterogeneity at day 3 and 6 of treatment, which was reminiscent of cell state transitions in other systems [61]. There was a negative correlation between NGFR and MITF/MART-1 expression at day 3. At day 6, an activation of MEK/ERK and NF-κB p65 signaling was observed, suggestive for a role of both pathways for an adaptive cell state transition. Indeed, by use of specific inhibitors (trametinib, MEK inhibitor; and JSH23, NF-κB p65 translocation inhibitor), an additional growth arrest was found in these cells under BRAFi treatment. However, a combination of vemurafenib and trametinib did not halt the neural crest transition, and resistance emerged after prolonged treatment. Only the triple combination of vemurafenib, trametinib, and the JSH23 inhibitor kept the cells in a drug-sensitive state, which argues for the strong role of NF-κB p65 in treatment resistance.
These experiments were further extended in a more recent study of the same group, analyzing a larger number of parameters in single cells by use of the same microchamber technology [56]. Among these parameters were MITF, pERK1, p-NF-κB, KI67, NGFR, HIF1α, LDH, and glucose. A BRAF-mutant melanoma cell line was treated with BRAFi, and analyses were made at different time points (days/D0, D1, D3, and D5). Trajectories of BRAFi resistance were measured. Two different trajectories (upper and lower) were observed, characterized by either Ki67 and NGFR/AXL expression or MITF, MART-1 expression. Authors then isolated MITF-high and MITF-low cells from this cell culture and treated cells with BRAFi. Both cell types again used different trajectories for treatment resistance. Together, these results suggest that, upon drug treatment, MITF-high and low cells use distinct trajectories of treatment resistance. Finally, critical point analysis was performed. Here, “critical point” stands for a point of irreversible development. Two different cell clusters were identified that characterized the regions near such tipping points of both trajectories. One cluster showed high network connectivity in a pathway that included MITF, PFK, p-LKB, PKM-2, and LDH-2, while in the other cluster, TNFR, N-cadherin, and p-NF-κB were dominant. Consequently, inhibition of PKM2 and NF-κB with specific inhibitors showed different sensitivities in both cell types, and a combination of both inhibitors with BRAFi was more effective than double combinations. Taken together, the different heterogeneous drug-response trajectories improved our understanding of resistance development, which may have an impact on effective therapy combinations in future.
References
- Bai, X.; Flaherty, K.T. Targeted and immunotherapies in BRAF mutant melanoma: Where we stand and what to expect. Br. J. Dermatol. 2020.
- Schadendorf, D.; Van Akkooi, A.C.J.; Berking, C.; Griewank, K.G.; Gutzmer, R.; Hauschild, A.; Stang, A.; Roesch, A.; Ugurel, S. Melanoma. Lancet 2018, 392, 971–984.
- Cancer Genome Atlas Network. Genomic Classification of Cutaneous Melanoma. Cell 2015, 161, 1681–1696.
- Hodis, E.; Watson, I.R.; Kryukov, G.V.; Arold, S.T.; Imielinski, M.; Theurillat, J.-P.; Nickerson, E.; Auclair, D.; Li, L.; Place, C.; et al. A landscape of driver mutations in melanoma. Cell 2012, 150, 251–263.
- Krauthammer, M.; Kong, Y.; Bacchiocchi, A.; Evans, P.; Pornputtapong, N.; Wu, C.; McCusker, J.P.; Ma, S.; Cheng, E.; Straub, R.; et al. Exome sequencing identifies recurrent mutations in NF1 and RASopathy genes in sun-exposed melanomas. Nat. Genet. 2015, 47, 996–1002.
- Davies, M.A.; Flaherty, K.T. Melanoma in 2017: Moving treatments earlier to move further forwards. Nat. Rev. Clin. Oncol. 2018, 15, 75–76.
- Robert, C.; Grob, J.J.; Stroyakovskiy, D.; Karaszewska, B.; Hauschild, A.; Levchenko, E.; Chiarion Sileni, V.; Schachter, J.; Garbe, C.; Bondarenko, I.; et al. Five-Year Outcomes with Dabrafenib plus Trametinib in Metastatic Melanoma. N. Engl. J. Med. 2019, 381, 626–636.
- Menzies, A.M.; Long, G.V. Systemic treatment for BRAF-mutant melanoma: Where do we go next? Lancet Oncol. 2014, 15, e371–e381.
- Dummer, R.; Brase, J.C.; Garrett, J.; Campbell, C.D.; Gasal, E.; Squires, M.; Gusenleitner, D.; Santinami, M.; Atkinson, V.; Mandalà, M.; et al. Adjuvant dabrafenib plus trametinib versus placebo in patients with resected, BRAFV600-mutant, stage III melanoma (COMBI-AD): Exploratory biomarker analyses from a randomised, phase 3 trial. Lancet Oncol. 2020, 21, 358–372.
- Amaria, R.N.; Menzies, A.M.; Burton, E.M.; Scolyer, R.A.; Tetzlaff, M.T.; Antdbacka, R.; Ariyan, C.; Bassett, R.; Carter, B.; Daud, A.; et al. Neoadjuvant systemic therapy in melanoma: Recommendations of the International Neoadjuvant Melanoma Consortium. Lancet Oncol. 2019, 20, e378–e389.
- Moriceau, G.; Hugo, W.; Hong, A.; Shi, H.; Kong, X.; Yu, C.C.; Koya, R.C.; Samatar, A.A.; Khanlou, N.; Braun, J.; et al. Tunable-combinatorial Mechanisms of Acquired Resistance Limit the Efficacy of BRAF/MEK Co-targeting but Result in Melanoma Drug Addiction. Cancer Cell 2015, 27, 240–256.
- Long, G.V.; Fung, C.; Menzies, A.M.; Pupo, G.M.; Carlino, M.S.; Hyman, J.; Shahheydari, H.; Tembe, V.; Thompson, J.F.; Saw, R.P.; et al. Increased MAPK reactivation in early resistance to dabrafenib/trametinib combination therapy of BRAF-mutant metastatic melanoma. Nat. Commun. 2014, 5, 5694.
- Wagle, N.; Van Allen, E.M.; Treacy, D.J.; Frederick, D.T.; Cooper, Z.A.; Taylor-Weiner, A.; Rosenberg, M.; Goetz, E.M.; Sullivan, R.J.; Farlow, D.N.; et al. MAP kinase pathway alterations in BRAF-mutant melanoma patients with acquired resistance to combined RAF/MEK inhibition. Cancer Discov. 2014, 4, 61–68.
- Rizos, H.; Menzies, A.M.; Pupo, G.M.; Carlino, M.S.; Fung, C.; Hyman, J.; Haydu, L.E.; Mijatov, B.; Becker, T.M.; Boyd, S.C.; et al. BRAF inhibitor resistance mechanisms in metastatic melanoma: Spectrum and clinical impact. Clin. Cancer Res. 2014, 20, 1965–1977.
- Shi, H.; Hugo, W.; Kong, X.; Hong, A.; Koya, R.C.; Moriceau, G.; Chodon, T.; Guo, R.; Johnson, D.B.; Dahlman, K.B.; et al. Acquired resistance and clonal evolution in melanoma during BRAF inhibitor therapy. Cancer Discov. 2014, 4, 80–93.
- Van Allen, E.M.; Wagle, N.; Sucker, A.; Treacy, D.J.; Johannessen, C.M.; Goetz, E.M.; Place, C.S.; Taylor-Weiner, A.; Whittaker, S.; Kryukov, G.V.; et al. The genetic landscape of clinical resistance to RAF inhibition in metastatic melanoma. Cancer Discov. 2014, 4, 94–109.
- Hugo, W.; Shi, H.; Sun, L.; Piva, M.; Song, C.; Kong, X.; Moriceau, G.; Hong, A.; Dahlman, K.B.; Johnson, D.B.; et al. Non-genomic and Immune Evolution of Melanoma Acquiring MAPKi Resistance. Cell 2015, 162, 1271–1285.
- Sun, C.; Wang, L.; Huang, S.; Heynen, G.J.J.E.; Prahallad, A.; Robert, C.; Haanen, J.; Blank, C.; Wesseling, J.; Willems, S.M.; et al. Reversible and adaptive resistance to BRAF(V600E) inhibition in melanoma. Nature 2014, 508, 118–122.
- Müller, J.; Krijgsman, O.; Tsoi, J.; Robert, L.; Hugo, W.; Song, C.; Kong, X.; Possik, P.A.; Cornelissen-Steijger, P.D.M.; Geukes Foppen, M.H.; et al. Low MITF/AXL ratio predicts early resistance to multiple targeted drugs in melanoma. Nat. Commun. 2014, 5, 5712.
- Johannessen, C.M.; Boehm, J.S.; Kim, S.Y.; Thomas, S.R.; Wardwell, L.; Johnson, L.A.; Emery, C.M.; Stransky, N.; Cogdill, A.P.; Barretina, J.; et al. COT drives resistance to RAF inhibition through MAP kinase pathway reactivation. Nature 2010, 468, 968–972.
- Konieczkowski, D.J.; Johannessen, C.M.; Abudayyeh, O.; Kim, J.W.; Cooper, Z.A.; Piris, A.; Frederick, D.T.; Barzily-Rokni, M.; Straussman, R.; Haq, R.; et al. A melanoma cell state distinction influences sensitivity to MAPK pathway inhibitors. Cancer Discov. 2014, 4, 816–827.
- Nazarian, R.; Shi, H.; Wang, Q.; Kong, X.; Koya, R.C.; Lee, H.; Chen, Z.; Lee, M.-K.; Attar, N.; Sazegar, H.; et al. Melanomas acquire resistance to B-RAF(V600E) inhibition by RTK or N-RAS upregulation. Nature 2010, 468, 973–977.
- Kunz, M.; Hölzel, M. The impact of melanoma genetics on treatment response and resistance in clinical and experimental studies. Cancer Metastasis Rev. 2017, 36, 53–75.
- Hirsch, L.; Zitvogel, L.; Eggermont, A.; Marabelle, A. PD-Loma: A cancer entity with a shared sensitivity to the PD-1/PD-L1 pathway blockade. Br. J. Cancer 2019, 120, 3–5.
- Larkin, J.; Chiarion-Sileni, V.; Gonzalez, R.; Grob, J.-J.; Rutkowski, P.; Lao, C.D.; Cowey, C.L.; Schadendorf, D.; Wagstaff, J.; Dummer, R.; et al. Five-Year Survival with Combined Nivolumab and Ipilimumab in Advanced Melanoma. N. Engl. J. Med. 2019, 381, 1535–1546.
- Bagchi, S.; Yuan, R.; Engleman, E.G. Immune Checkpoint Inhibitors for the Treatment of Cancer: Clinical Impact and Mechanisms of Response and Resistance. Annu. Rev. Pathol. 2020.
- Van Allen, E.M.; Miao, D.; Schilling, B.; Shukla, S.A.; Blank, C.; Zimmer, L.; Sucker, A.; Hillen, U.; Foppen, M.H.G.; Goldinger, S.M.; et al. Genomic correlates of response to CTLA-4 blockade in metastatic melanoma. Science 2015, 350, 207–211.
- Snyder, A.; Wolchok, J.D.; Chan, T.A. Genetic basis for clinical response to CTLA-4 blockade. N. Engl. J. Med. 2015, 372, 783.
- Hugo, W.; Zaretsky, J.M.; Sun, L.; Song, C.; Moreno, B.H.; Hu-Lieskovan, S.; Berent-Maoz, B.; Pang, J.; Chmielowski, B.; Cherry, G.; et al. Genomic and Transcriptomic Features of Response to Anti-PD-1 Therapy in Metastatic Melanoma. Cell 2016, 165, 35–44.
- Zaretsky, J.M.; Garcia-Diaz, A.; Shin, D.S.; Escuin-Ordinas, H.; Hugo, W.; Hu-Lieskovan, S.; Torrejon, D.Y.; Abril-Rodriguez, G.; Sandoval, S.; Barthly, L.; et al. Mutations Associated with Acquired Resistance to PD-1 Blockade in Melanoma. N. Engl. J. Med. 2016, 375, 819–829.
- Chen, P.-L.; Roh, W.; Reuben, A.; Cooper, Z.A.; Spencer, C.N.; Prieto, P.A.; Miller, J.P.; Bassett, R.L.; Gopalakrishnan, V.; Wani, K.; et al. Analysis of Immune Signatures in Longitudinal Tumor Samples Yields Insight into Biomarkers of Response and Mechanisms of Resistance to Immune Checkpoint Blockade. Cancer Discov. 2016, 6, 827–837.
- Riaz, N.; Havel, J.J.; Makarov, V.; Desrichard, A.; Urba, W.J.; Sims, J.S.; Hodi, F.S.; Martín-Algarra, S.; Mandal, R.; Sharfman, W.H.; et al. Tumor and Microenvironment Evolution during Immunotherapy with Nivolumab. Cell 2017, 171, 934–949.e16.
- Liu, D.; Schilling, B.; Liu, D.; Sucker, A.; Livingstone, E.; Jerby-Arnon, L.; Zimmer, L.; Gutzmer, R.; Satzger, I.; Loquai, C.; et al. Integrative molecular and clinical modeling of clinical outcomes to PD1 blockade in patients with metastatic melanoma. Nat. Med. 2019, 25, 1916–1927.
- Dagogo-Jack, I.; Shaw, A.T. Tumour heterogeneity and resistance to cancer therapies. Nat. Rev. Clin. Oncol. 2018, 15, 81–94.
- Nowell, P.C. The clonal evolution of tumor cell populations. Science 1976, 194, 23–28.
- Barrett, M.T.; Lenkiewicz, E.; Evers, L.; Holley, T.; Ruiz, C.; Bubendorf, L.; Sekulic, A.; Ramanathan, R.K.; Von Hoff, D.D. Clonal evolution and therapeutic resistance in solid tumors. Front. Pharmacol. 2013, 4, 2.
- Aparicio, S.; Caldas, C. The implications of clonal genome evolution for cancer medicine. N. Engl. J. Med. 2013, 368, 842–851.
- Yancovitz, M.; Litterman, A.; Yoon, J.; Ng, E.; Shapiro, R.L.; Berman, R.S.; Pavlick, A.C.; Darvishian, F.; Christos, P.; Mazumdar, M.; et al. Intra- and inter-tumor heterogeneity of BRAF(V600E))mutations in primary and metastatic melanoma. PLoS ONE 2012, 7, e29336.
- Harbst, K.; Lauss, M.; Cirenajwis, H.; Isaksson, K.; Rosengren, F.; Törngren, T.; Kvist, A.; Johansson, M.C.; Vallon-Christersson, J.; Baldetorp, B.; et al. Multiregion Whole-Exome Sequencing Uncovers the Genetic Evolution and Mutational Heterogeneity of Early-Stage Metastatic Melanoma. Cancer Res. 2016, 76, 4765–4774.
- Sanna, A.; Harbst, K.; Johansson, I.; Christensen, G.; Lauss, M.; Mitra, S.; Rosengren, F.; Häkkinen, J.; Vallon-Christersson, J.; Olsson, H.; et al. Tumor genetic heterogeneity analysis of chronic sun-damaged melanoma. Pigment Cell Melanoma Res. 2020, 33, 480–489.
- Obenauf, A.C.; Zou, Y.; Ji, A.L.; Vanharanta, S.; Shu, W.; Shi, H.; Kong, X.; Bosenberg, M.C.; Wiesner, T.; Rosen, N.; et al. Therapy-induced tumour secretomes promote resistance and tumour progression. Nature 2015, 520, 368–372.
- Shaffer, S.M.; Emert, B.L.; Reyes Hueros, R.A.; Cote, C.; Harmange, G.; Schaff, D.L.; Sizemore, A.E.; Gupte, R.; Torre, E.; Singh, A.; et al. Memory Sequencing Reveals Heritable Single-Cell Gene Expression Programs Associated with Distinct Cellular Behaviors. Cell 2020, 182, 947–959.e17.
- Lin, Z.; Meng, X.; Wen, J.; Corral, J.M.; Andreev, D.; Kachler, K.; Schett, G.; Chen, X.; Bozec, A. Intratumor Heterogeneity Correlates With Reduced Immune Activity and Worse Survival in Melanoma Patients. Front. Oncol. 2020, 10.
- Newman, A.M.; Liu, C.L.; Green, M.R.; Gentles, A.J.; Feng, W.; Xu, Y.; Hoang, C.D.; Diehn, M.; Alizadeh, A.A. Robust enumeration of cell subsets from tissue expression profiles. Nat. Methods 2015, 12, 453–457.
- Wolf, Y.; Bartok, O.; Patkar, S.; Eli, G.B.; Cohen, S.; Litchfield, K.; Levy, R.; Jiménez-Sánchez, A.; Trabish, S.; Lee, J.S.; et al. UVB-Induced Tumor Heterogeneity Diminishes Immune Response in Melanoma. Cell 2019, 179, 219–235.e21.
- Tirosh, I.; Izar, B.; Prakadan, S.M.; Wadsworth, M.H.; Treacy, D.; Trombetta, J.J.; Rotem, A.; Rodman, C.; Lian, C.; Murphy, G.; et al. Dissecting the multicellular ecosystem of metastatic melanoma by single-cell RNA-seq. Science 2016, 352, 189–196.
- Liang, S.; Wang, F.; Han, J.; Chen, K. Latent periodic process inference from single-cell RNA-seq data. Nat. Commun. 2020, 11, 1441.
- Wouters, J.; Kalender-Atak, Z.; Minnoye, L.; Spanier, K.I.; De Waegeneer, M.; Bravo González-Blas, C.; Mauduit, D.; Davie, K.; Hulselmans, G.; Najem, A.; et al. Robust gene expression programs underlie recurrent cell states and phenotype switching in melanoma. Nat. Cell Biol. 2020, 22, 986–998.
- Gerber, T.; Willscher, E.; Loeffler-Wirth, H.; Hopp, L.; Schadendorf, D.; Schartl, M.; Anderegg, U.; Camp, G.; Treutlein, B.; Binder, H.; et al. Mapping heterogeneity in patient-derived melanoma cultures by single-cell RNA-seq. Oncotarget 2017, 8, 846–862.
- Sade-Feldman, M.; Yizhak, K.; Bjorgaard, S.L.; Ray, J.P.; De Boer, C.G.; Jenkins, R.W.; Lieb, D.J.; Chen, J.H.; Frederick, D.T.; Barzily-Rokni, M.; et al. Defining T Cell States Associated with Response to Checkpoint Immunotherapy in Melanoma. Cell 2018, 175, 998–1013.e20.
- Jerby-Arnon, L.; Shah, P.; Cuoco, M.S.; Rodman, C.; Su, M.-J.; Melms, J.C.; Leeson, R.; Kanodia, A.; Mei, S.; Lin, J.-R.; et al. A Cancer Cell Program Promotes T Cell Exclusion and Resistance to Checkpoint Blockade. Cell 2018, 175, 984–997.e24.
- Li, H.; Van der Leun, A.M.; Yofe, I.; Lubling, Y.; Gelbard-Solodkin, D.; Van Akkooi, A.C.J.; Van den Braber, M.; Rozeman, E.A.; Haanen, J.B.A.G.; Blank, C.U.; et al. Dysfunctional CD8 T Cells Form a Proliferative, Dynamically Regulated Compartment within Human Melanoma. Cell 2019, 176, 775–789.e18.
- Rambow, F.; Rogiers, A.; Marin-Bejar, O.; Aibar, S.; Femel, J.; Dewaele, M.; Karras, P.; Brown, D.; Chang, Y.H.; Debiec-Rychter, M.; et al. Toward Minimal Residual Disease-Directed Therapy in Melanoma. Cell 2018, 174, 843–855.e19.
- Jun, S.; Lim, H.; Chun, H.; Lee, J.H.; Bang, D. Single-cell analysis of a mutant library generated using CRISPR-guided deaminase in human melanoma cells. Commun. Biol. 2020, 3, 154.
- Su, Y.; Wei, W.; Robert, L.; Xue, M.; Tsoi, J.; Garcia-Diaz, A.; Homet Moreno, B.; Kim, J.; Ng, R.H.; Lee, J.W.; et al. Single-cell analysis resolves the cell state transition and signaling dynamics associated with melanoma drug-induced resistance. Proc. Natl. Acad. Sci. USA. 2017, 114, 13679–13684.
- Su, Y.; Ko, M.E.; Cheng, H.; Zhu, R.; Xue, M.; Wang, J.; Lee, J.W.; Frankiw, L.; Xu, A.; Wong, S.; et al. Multi-omic single-cell snapshots reveal multiple independent trajectories to drug tolerance in a melanoma cell line. Nat. Commun. 2020, 11, 2345.
- Cojoc, M.; Mäbert, K.; Muders, M.H.; Dubrovska, A. A role for cancer stem cells in therapy resistance: Cellular and molecular mechanisms. Semin. Cancer Biol. 2015, 31, 16–27.
- Lawson, D.A.; Bhakta, N.R.; Kessenbrock, K.; Prummel, K.D.; Yu, Y.; Takai, K.; Zhou, A.; Eyob, H.; Balakrishnan, S.; Wang, C.-Y.; et al. Single-cell analysis reveals a stem-cell program in human metastatic breast cancer cells. Nature 2015, 526, 131–135.
- Thibaut, R.; Bost, P.; Milo, I.; Cazaux, M.; Lemaître, F.; Garcia, Z.; Amit, I.; Breart, B.; Cornuot, C.; Schwikowski, B.; et al. Bystander IFN-γ activity promotes widespread and sustained cytokine signaling altering the tumor microenvironment. Nat. Cancer 2020, 1, 302–314.
- Ho, Y.-J.; Anaparthy, N.; Molik, D.; Mathew, G.; Aicher, T.; Patel, A.; Hicks, J.; Hammell, M.G. Single-cell RNA-seq analysis identifies markers of resistance to targeted BRAF inhibitors in melanoma cell populations. Genome Res. 2018, 28, 1353–1363.
- Mojtahedi, M.; Skupin, A.; Zhou, J.; Castaño, I.G.; Leong-Quong, R.Y.Y.; Chang, H.; Trachana, K.; Giuliani, A.; Huang, S. Cell Fate Decision as High-Dimensional Critical State Transition. PLoS Biol. 2016, 14, e2000640.


