 +1 credit
| Version | Summary | Created by | Modification | Content Size | Created at | Operation |
|---|---|---|---|---|---|---|
| 1 | Anna Di Mauro | + 3796 word(s) | 3796 | 2021-01-15 08:03:09 | | | |
| 2 | Lily Guo | + 102 word(s) | 3898 | 2021-03-19 05:25:36 | | |
Video Upload Options
Urban water (here referred as urban water consumption) is defined by European Environmental Agency as the water abstracted for urban purposes which include domestic uses (households), small industries, municipal services, and public gardening [EEA].
Over the last three decades, the increasing development of smart water meter trials and the rise of demand management has fostered the collection of water demand data at increasingly higher spatial and temporal resolutions, especially for the domestic sector (i.e., household water use). Counting these new datasets and more traditional aggregate water demand data, the literature is rich with heterogeneous urban water consumption datasets. They are characterized by heterogeneous spatial scales—from urban districts, to households or individual water fixtures—and temporal sampling frequencies—from seasonal/monthly up to sub-daily (minutes or seconds). This entry is based on the review paper "Urban Water Consumption at Multiple Spatial and Temporal Scales. A Review of Existing Datasets" by Di Mauro et al. 2021 The review analyzes 92 water demand datasets and 120 related peer-review publications compiled in the last 45 years. The reviewed datasets are classified and analyzed according to the following criteria: spatial scale, temporal scale, and dataset accessibility. This research effort builds an updated catalog of the existing water demand datasets to facilitate future research efforts end encourage the publication of open-access datasets in water demand modelling and management research.
1. Introduction
Population growth, urbanization, and climate change are expected to increase the stress on freshwater resources and the burden over urban water systems [1][2][3]. Adaptive planning and management strategies are thus needed to address seasonal or prolonged water scarcity in drought-prone areas and meet water demands with reduced operational expenditure, overall increasing the resilience of critical urban water network infrastructure systems [4].
In the last decades, demand-side management has increasingly emerged as a key approach to complement traditional water supply operations [5]. Different water demand management strategies (WDMS) have been proposed in the literature to foster water conservation and more efficient water demands [6][7]. These include technological, financial, legislative, maintenance, and educational interventions [8]. The rise of demand-side water management has motivated the development of more and more sophisticated technologies and mathematical models to monitor, characterize, and predict water demands at different spatial and temporal scales, and capture the existing relationships between water demand and its potential climatic and socio-demographic determinants [9][10][11].
At the coarser urban and suburban scales, the state-of-the-art literature is rich with studies focused on improving the efficiency of water distribution network (WDN) operations (e.g., [12][13][14]). In these studies, water demands are often considered as a stationary or seasonal input to the hydraulic model of the WDN, with a spatial level of aggregation referred to the city or the district scale. Such spatial scales are typically relevant for infrastructure planning, WDN design, and WDN partitioning. More recently, various techniques for water demand forecasting have also been proposed in the literature. They include regression analysis, time series analysis, and techniques based on black box models, including different Artificial Neural Network architectures (e.g., [15]). Demand prediction models have been developed at different spatial and temporal scales, with the majority of the studies focusing on urban and suburban scales, and temporal resolutions spanning from hourly to monthly intervals (e.g., [16][17][18]). A disruptive phase in the development of water demand studies is represented by the advent of smart metering technologies [8][19]. The development of smart meters allowed gathering water demand data with an unprecedented level of spatiotemporal detail. Water demand data became potentially available at the spatial scale of individual households and data logging intervals of a few seconds [20]. While understanding the full range of potential benefits of smart meters for water utilities and customers is still a topic for active discussion [21], the variety of studies in the literature based upon smart meter data demonstrates the diversity of data-driven opportunities that high-resolution smart meter data opened up in the context of water demand modelling and management. These include, e.g., water demand profiling and customer segmentation [22], post meter leak detection and water loss management [23], end use studies for fixture-level water demand breakdown and detailed demand forecasting [24], and behavioral studies [25].
The continuously increasing amount of smart meter trials and demand modelling and management studies since the middle of the 1990s [8] suggests that several high-resolution water demand datasets have been recently compiled. The availability of high-resolution datasets opens up several opportunities for advanced applications, including the development of water end use disaggregation algorithms and machine learning techniques for user profiling. Such applications could benefit from open datasets to enhance comparative applications, benchmarking, and facilitate the development of general algorithms trained on combined datasets with water consumption data from different sources and locations. High-resolution datasets, considered in combination with the more traditional water demand datasets gathered at coarser spatial and temporal resolutions would represent a valuable resource for researchers and scientific efforts targeting the development and validation of mathematical models of water demand at different spatial and temporal scales, or the development of advanced smart metering analytics.
Yet, information and metadata on individual water demand datasets are scattered in the literature, and to the authors’ knowledge, a comprehensive review of the existing datasets is still missing. Existing data are frequently difficult to access or use, and existing literature reviews on urban water consumption focus on demand modelling or other data-driven applications, rather than on analyzing the heterogeneity of existing datasets, their spatial and temporal scales, and accessibility. Motivated by the recent development and availability of datasets gathered with increasingly high spatial and temporal resolution, the aim of this paper is to gather information on the datasets to identify current trends and gaps and help future data-driven research, along with research benchmarking and reproducibility.
2. Overview of Dataset Search Outcomes
Depending on the spatial scale of interest, authors identified four scales of interest for urban water consumption monitoring and analysis, from the coarser to the finer:
• City. It refers to a city as an urban centre with its own government and administration. The city scale can be composed of multiple districts and it includes the whole water distribution network.
• District. A district is a component of an urban center. The district spatial scale refers to a group of residential buildings in one or more municipalities. In many cases, districts coincide with the water network district meter areas (DMAs), i.e., sub-regions of a water network delimited by closing boundary valves. In the case of small cities or villages, the district and city scale can coincide.
• Household. The household scale implies a single dwelling, or a single-family residential building connected to an individual water meter. This category also includes
multi-family homes, when connected to one water meter. Depending on the type of household, its water consumption can be attributed to indoor usage only or both
indoor and outdoor usage.
• End use. The end use scale refers to an individual water fixture within a single apartment/ household. End uses can refer to indoor (e.g., shower, dishwasher, toilet, etc.)
or outdoor uses (e.g., garden, swimming pool, etc.).
This review keeps into account the spatial scale dependencies of the reviewed datasets and classify them according to the three suburban scales included in the city level: District, Household, and End Use.
Beside the spatial dimension, it has been also explored how datasets differ in terms of temporal scale (or time sampling frequency). Previous literature has shown that water demand data gathered at monthly or quarterly resolution is mainly used to inform strategic regional planning and to calculate water bills [11], while a number of additional applications, including post-meter leak detection and water end use disaggregation can be enabled by sub-daily data (e.g., recorded with a time sampling frequency of 1 h or a few minutes/seconds)[26]. Here, the authors characterize the datasets collected at the district, household, and end use scales according to their time sampling resolution, with primary focus on daily and sub-daily frequencies. Authors consider datasets to have a low resolution when they include data with a daily or lower time sampling frequencies (e.g., monthly). In turn, it has been considered as high resolution datasets those gathered with a sub-daily frequency (e.g., hourly, 1 min, 10 s).
As an outcome of the dataset search, the authors retrieved information on 92 unique datasets referenced in 120 scientific works, which in the last 45 years contributed to the literature on water demand modelling and management. The complete catalogue of the datasets and publications reviewed in this study is publicly available at [27]. The catalogue has been also stored in a public GitHub repository where pull requests can be submitted, so that the dataset collection can be collaboratively updated as more datasets become available (the repository is accessible at https://github.com/AnnaDiMauro/WDDreview).
A general overview of the reviewed datasets (Figure 1) suggests that, first, the majority of the reviewed datasets contain water consumption data at high spatial resolutions (i.e., end use and household). Second, the temporal distribution of the reviewed publications (Figure 2) is skewed to the right, with a major increase of household and end use studies after 2010. This is likely due to the increasing development of smart meter technologies during the period 2011–2015 [8], following the pioneering studies and prototypes that first appeared in the 1990s (the first end use study reviewed dates back to the 1991–1995 interval in Figure 2).
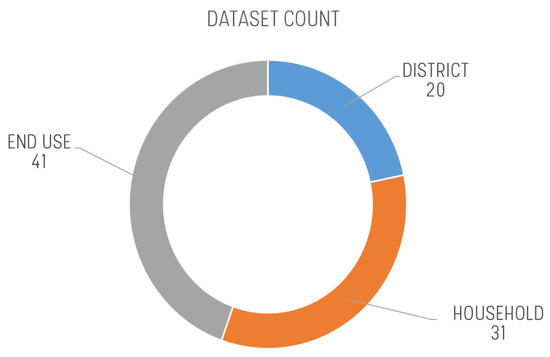
Figure 1. Distribution of the 92 reviewed datasets across three spatial scales, i.e., district, household, and end use.
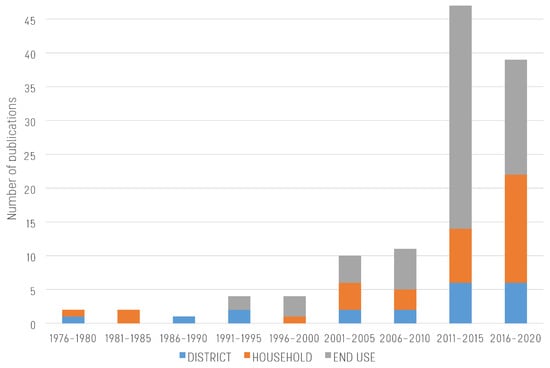
Figure 2. Five–year count of the 120 scientific publications reviewed in this study and referencing the 92 reviewed datasets.
Finally the worldwide geographical distribution of the reviewed publications (Figure 3) shows an uneven spatial distribution, with more than 50% of the reviewed studies located either in the USA or Europe: 28% USA, 25% EU, 17% Australia and New Zealand, 13% United Kingdom, 9% Asia, 6% Canada, 2% Africa.
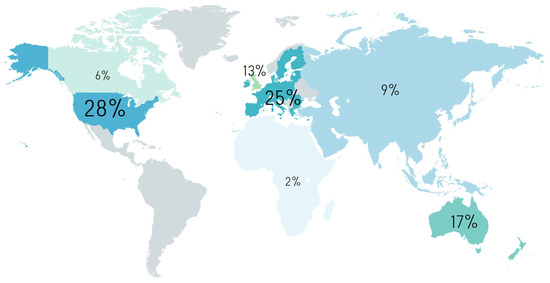
Figure 3. Geographical distribution of the 120 publications reviewed in this study.
A more detailed analysis on the distribution of the reviewed datasets across spatial and temporal scales, along with a critical analysis on their accessibility, are presented in the next sections.
3. Dataset Spatial Scales
To answer the first research question reported in Figure 1, we here investigate the distribution of the 92 reviewed datasets across different spatial resolutions, along with their implications for demand modeling and management.
As already reported in Figure 2, we identify only 20 datasets at the district scale. Water demand data collected at this scale relate to specific areas of a water distribution network. They are primarily used to monitor aggregate water demand patterns in the network, or to provide input information to simulation models of water distribution systems. Among these datasets, it is worth highlighting the presence of comprehensive, multi-network datasets, such as the WDSRD database for research applications [28]. This dataset includes data for over 40 different distribution networks, collected by the ASCE Task Committee on Research Databases for Water Distribution Systems for the water distribution system community to develop and test new algorithms for network design, analysis, and operations. A typical problem that requires such type of data is the optimal sensor placement in a partitioned water distribution network [29]. This problem, consisting of finding the optimal sensor location that minimizes the economic costs, while maximizing the amount of information required for network operations and diagnosis, still represents an open challenge for utilities and researchers [30][31]. The datasets classified in the district spatial scale are generally gathered by water utilities for ad hoc analysis on specific case studies within their controlled water network facilities. As the data ownership belongs to water utilities, such data is generally not released to the public, but only released to researchers under non-disclosing agreements. If demand data come from individual household-scale water meters, privacy-protection schemes, e.g., data anonymization, are usually required before data are actually shared.
The majority of the reviewed datasets was collected at the household (31 datasets) or end use (41 datasets) scale. Datasets as such high spatial resolutions have been emerging in the literature in the last 20–30 years, driven by the increasing scientific interest towards smart water metering technology. Smart meters can be defined as digital sensors able to measure, store, and transmit water use data at the household level and with a sub-daily temporal sampling resolution, down to a few seconds [26][32]. Mining smart meter information with advanced data analytics is enabling new opportunities also for developing automatic tools to estimate the water consumption of individual fixtures in a household [33][34], quantify the impact of individual and collective human behaviors on residential water consumption and water conservation [35], and acquire a better understanding on which socio-demographic determinants primarily drive residential water consumption in different geographical contexts [36][37]. Water data at the household/end use scale are of great interest for behavioral studies and provide key information for fostering water conservation, designing water tariffs, promoting more sustainable uses of resource, characterizing water demand during peak hours, and improving demand forecasting and management capabilities [38]. These topics have been already extensively reviewed in the literature, and several comprehensive reviews analyzed the usage and benefits of smart metering for data collection and detailed water demand modelling and management [8][21][39][40].
4. Dataset Temporal Scales
In this section, we address Q2 (see Figure 1) by analyzing the temporal scale of the 92 reviewed WDDs, i.e., we investigate which time sampling resolutions characterize the datasets spatially gathered at the district, household, and end use scales.
As defined in Section 2, water demand data can be recorded with a low resolution characterized by daily or monthly time sampling frequency, or with high resolution, when sub-daily measurements are recorded. The sampling represents a limiting factor for the type of analysis that can be performed [26][41]. Considering the 92 WDDs included in this review, the datasets gathered at the district scale mainly include data collected with a low temporal resolution. These data, recorded with a daily, and more often, monthly, or coarser temporal resolution, consist of measures obtained from billing reports, or periodic meter observations. This is consistent with the main needs of the studies using such datasets for, e.g., the estimation of aggregate water demand for water network design, the resolution of optimal sensor placement problems, and the optimization of water network operations. Only some exceptions include data with a time sampling resolution of 15 min (e.g., [42][43][44]). In turn, the household and end use datasets include data gathered with higher time sampling resolution. The classification of these datasets based on their time sampling resolution (Figure 4) reveals that the majority of the end use-scale datasets contain data gathered with a sub-minute resolution, while most of the household-scale datasets contain data recorded with a time frequency of 15 min to 1 day.
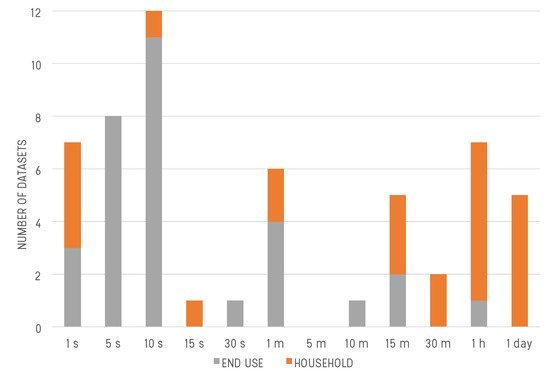
Figure 4. Dataset count for different time sampling frequencies. Only the reviewed datasets gathered at the household (gray) and end use scale (orange) are included.
The distribution of the end use datasets in Figure 4 is an empirical validation of the findings of a previous study by Cominola et al. [26], which demonstrated that only data gathered with time sampling resolutions of a few seconds or, at most, 1 min, can be used to accurately estimate the contribution, peak, and time of use of individual water fixtures, especially when multiple end uses are active. Besides facilitating accurate end use disaggregation [45][46][47][48][49][50], such high resolution data also allow a detailed characterization of consumer behaviors [51][52][53][54], and the design of customized water demand strategies [55][56][57][58][59].
Conversely, the distribution of the household-scale datasets in Figure 4 confirms that data sampled with lower frequency suffice for water demand pattern analysis at the household level, i.e., with no detailed end-use analysis. Sub-daily resolution still allow extracting water use patterns and recurring routines [26][60][61], identify anomalies [62], and forecast water demand [63][64].
Cross-correlating information on the time sampling resolution with the metadata previously described in Table 2 and Table 3, a trade-off between the time sampling resolution and the size of a dataset emerges.
5. Data Accessibility
Open and free access to scientific datasets can provide valuable support to more reproducible and reusable research [65]. The availability of benchmark datasets accessible by different researchers worldwide would, for instance, help minimize redundant experiments, facilitate benchmarked numerical results on common datasets, and foster reproducibility and incremental research—which in turn drive innovation [66][67]. Yet, data accessibility presents significant challenges in many research fields, due to data ownership, sharing limitations, privacy concerns, technical data management, and security risks [68]. Furthermore, currently available data often lack a standardized format or organized database structure [68][69], or they might not be explicitly referenced in scientific publications, and thus, can be hard to track. Considering the literature on urban water demand modelling and management, WDDs are usually collected as part of large-scale scientific projects carried out by research groups or water utilities at the national and international level [51][70][71][72], or from spatially-constrained experimental settings deployed with the main purpose of creating open-access datasets to be shared for research activities [24][73][74][75].
Here, we aim to answer to Q4 (see Figure 1) and distinguish three main categories of data accessibility to categorize the revised water consumption datasets, namely open, restricted, and not available:
-
Restricted datasets are those WDDs that are available online either only for purchase, or by privately contacting authors/water utilities that own/have direct access to the data.
-
Not available WDDs are those used and/or cited in the literature (primarily in papers published in the 1970s/80s/90s), but with no information on how to access them.
For the datasets reviewed in this paper, a trade-off emerges between dataset creation and data availability. While there is an increasing amount of water demand data collected at different spatial and temporal scales and related publications (see Figure 3), we found that data sets accessibility is mostly restricted. The datasets we reviewed at the district scale are usually provided by water utilities for specific projects or case studies. As they are owned by water utilities and only released to scientists with non-disclosure agreements for the duration of the relative project, their accessibility is usually restricted or not available. Conversely, the datasets reviewed at the household and end use scales include at least some open and many accessible, but restricted, datasets. Data anonymization, access restriction, or access control filters are usually implemented to protect water consumers privacy [76]. While for many years synthetic household and end use data generation methods have been developed because of limited data availability (e.g., [77][78]), there is an increasing trend of open and restricted household/end use datasets, visible from the number of datasets and access type over time in Figure 5 and Figure 6. The sample of datasets and studies suggests that digital technologies and experimental research are two factors that can foster data availability. Indeed, the majority of the datasets that we classified with Restricted or Open access, have been collected as part of experimental smart meter trials. In such a context, data are often collected from a sample of volunteer households and are made available by design as part of the research, thus they are not prevented from further usage by utility regulations or ownership rights. Figure 5 and Figure 6 are discussed in detail in the following sections.
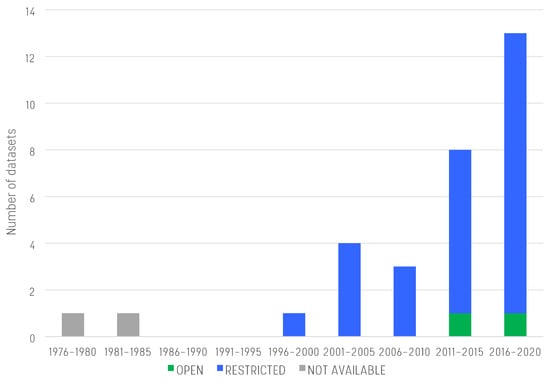
Figure 5. Household scale dataset count and accessibility over time.
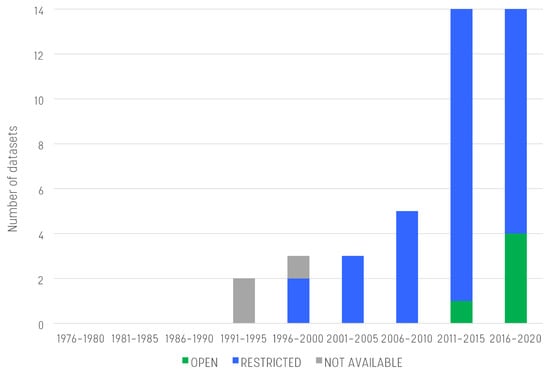
Figure 6. End use scale dataset count and accessibility over time.
5.1. Household-Scale Datasets Accessibility
At the household scale (see Figure 5), there is a more than linear increase in dataset creation. While the few datasets gathered between 1975 and 1995 are not available, almost all those created between 1996 and the time of this review are accessible with restrictions. This may be motivated by the utilities’ and researchers’ need to protect sensitive customer data, even if they are usually anonymized, or by the interest to control the access to a potentially high-value asset constituted by a limited resource (household/smart meter data, in this case). Only a few datasets gathered in the last 10 years are openly accessible to the scientific community and the public. We found that this limited set of data is usually composed of datasets delivered as outputs of specific research projects in the European area, e.g., the EU-funded SmartH2O project [51] and the studies in London and the Thames Valley [63][79].
5.2. End Use-Scale Dataset Accessibility
Consistently with the household-scale datasets, the majority of end use-scale datasets has restricted access. Yet, some open end use datasets exist since the end of the 1990s. As reported in Figure 6, it also seems that the last 5 years have witnessed an increase of open-access datasets, compared to the total amount of end use datasets. While datasets collected at the household scale are usually owned by utilities, end use datasets are usually collected by researchers as part of experimental research efforts and smart meter/end use studies. This is one of the reasons why more end use-scale datasets are open access, compared with household-scale datasets. According to the experience of the authors, even those datasets declared open are not often easy to access (e.g., download link is broken, website is not updated), but some encouraging preliminary publications, e.g., ([24][75]) suggest that further detailed high-resolution open datasets, collected in controlled environments and provided with groud truth end use labels, will be soon available for research.
All the 41 end use-scale datasets reviewed in this paper have been referenced in at least one peer-reviewed publication on water demand analysis or end use disaggregation. However, a detailed analysis of the usage frequency of the different end use datasets (see Figure 7) reveals that, after excluding those datasets with no identification name and used only for ad hoc individual case studies and trial applications (“no name ” datasets in Figure 7), only two datasets were used in more than 5 publications, namely the SEQ and the GOLD COAST datasets. The SEQ dataset has been dominating the scientific scene of the last years and contains the largest collection of sub-minute resolution data estimated for different water end uses. It is the output of a residential end-use study carried out in Australia, i.e., the South East Queensland Residential End Use Study (SEQREUS) [73]. The SEQREUS project aimed to quantify and characterise the main water end uses in a sample of 250 single homes. The SEQ dataset contains water demand with a resolution of 5 sec obtained through the installation of smart meters at the household level. Moreover, end use water demand estimations were achieved using a mixed disaggregation method combining information on the smart metering equipment, household stock inventory surveys, and flow trace analysis [80][81]. Three separate water end use analysis occurred during the SEQREUS project. The first reading campaigns were conducted in the winter (14–28 June 2010); the second one was carried out in the summer (1 December 2010–21 February 2011); the third one in winter 2011 (1–15 June). The SEQ dataset has been so far used in the scientific community to investigate pattern recognition of water usage [82], assess the impact of user awarness on water conservation [83], develop end use disaggregation algorithms [84], and develop demand side management programs [85]. Similarly, the GOLD COAST dataset includes data from the Gold Coast Watersaver End Use Project that was conducted in winter 2008 [86]. It includes data for 151 homes located in the Gold Coast, Australia. The project aimed to explore the degree of influence of household socioeconomic features on end uses. The GOLD COAST dataset contains water demand with a time sampling resolution of 10 seconds, obtained with high-resolution water meters and data loggers to enable the identification of heterogeneous water end uses.
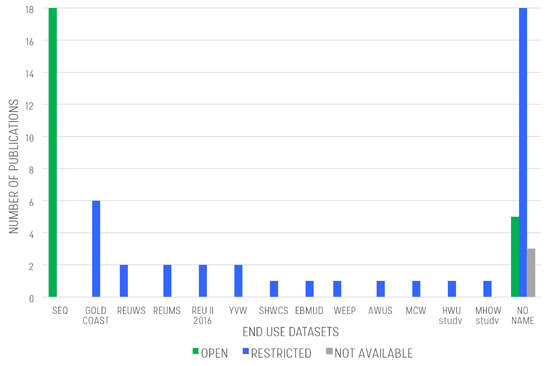
Figure 7. Usage frequency of different reviewed end use datasets. Each dataset is labelled with its name. The “no name” category includes datasets with no identification name and used only for ad hoc individual case studies and trial applications.
References
- Hernandez, E.; Hoagland, S.; Ormsbee, L.E. WDSRD: A Database for Research Applications. University of Kentucky Libraries. 2016. Available online: (accessed on 10 December 2020).
- Di Nardo, A.; Di Natale, M.; Di Mauro, A.; Martínez Díaz, E.; Blázquez Garcia, J.A.; Santonastaso, G.F.; Tuccinardi, F.P. An advanced software to design automatically permanent partitioning of a water distribution network. Urban Water J. 2020, 17, 259–265.
- Aral, M.M.; Guan, J.; Maslia, M.L.; Grayman, W.M. Optimization model and algorithms for design of water sensor placement in water distribution systems. In Proceedings of the 8th Annual Water Distribution Systems Analysis Symposium 2006, Cincinnati, OH, USA, 27–30 August 2006.
- Casillas, M.V.; Puig, V.; Garza-Castañón, L.E.; Rosich, A. Optimal sensor placement for leak location in water distribution networks using genetic algorithms. Sensors 2013, 13, 14984–15005.
- Cominola, A.; Giuliani, M.; Castelletti, A.; Rosenberg, D.E.; Abdallah, A.M. Implications of data sampling resolution on water use simulation, end-use disaggregation, and demand management. Environ. Model. Softw. 2018, 102, 199–212.
- Mayer, P.W.; Deoreo, W.B.; Opitz, E.M.; Kiefer, J.C.; Davis, W.Y.; Dziegielewski, B.; Nelson, J.O. Residential End Uses of Water; Aquacraft, Inc. Water Engineering and Management: Boulder, CO, USA, 1999.
- Gilbertson, M.; Hurlimann, A.; Dolnicar, S. Does water context influence behaviour and attitudes to water conservation? Australas. J. Environ. Manag. 2011, 18.
- Parker, J.M.; Wilby, R.L. Quantifying Household Water Demand: A Review of Theory and Practice in the UK. Water Resour. Manag. 2013, 27, 981–1011.
- Jorgensen, B.; Graymore, M.; O’Toole, K. Household water use behavior: An integrated model. J. Environ. Manag. 2009, 91, 227–236.
- Fielding, K.S.; Russell, S.; Spinks, A.; Mankad, A. Determinants of household water conservation: The role of demographic, infrastructure, behavior, and psychosocial variables. Water Resour. Res. 2012, 48.
- Russell, S.V.; Knoeri, C. Exploring the psychosocial and behavioural determinants of household water conservation and intention. Int. J. Water Resour. Dev. 2019, 36, 940–955.
- Willis, R.M.; Stewart, R.A.; Giurco, D.P.; Talebpour, M.R.; Mousavinejad, A. End use water consumption in households: Impact of socio-demographic factors and efficient devices. J. Clean. Prod. 2013, 60, 107–115.
- Cominola, A.; Giuliani, M.; Piga, D.; Castelletti, A.; Rizzoli, A.E. Benefits and challenges of using smart meters for advancing residential water demand modeling and management: A review. Environ. Model. Softw. 2015, 72, 198–214.
- Monks, I.; Stewart, R.A.; Sahin, O.; Keller, R. Revealing unreported benefits of digital water metering: Literature review and expert opinions. Water 2019, 11, 838.
- Liu, A.; Mukheibir, P. Digital metering feedback and changes in water consumption—A review. Resour. Conserv. Recycl. 2018, 134, 136–148.
- Rahim, M.S.; Nguyen, K.A.; Stewart, R.A.; Giurco, D.; Blumenstein, M. Machine learning and data analytic techniques in digitalwater metering: A review. Water 2020, 12, 294.
- Magini, R.; Pallavicini, I.; Guercio, R. Spatial and temporal scaling properties of water demand. J. Water Resour. Plan. Manag. 2008, 134, 276–284.
- Alvisi, S.; Franchini, M.; Marinelli, A. A stochastic model for representing drinking water demand at residential level. Water Resour. Manag. 2003, 17, 197–222.
- Boracchi, G.; Roveri, M. Exploiting self-similarity for change detection. In Proceedings of the International Joint Conference on Neural Networks, Beijing, China, 6–11 July 2014; Institute of Electrical and Electronics Engineers Inc.: Piscataway, NJ, USA, 2014; pp. 3339–3346.
- Smolak, K.; Kasieczka, B.; Fialkiewicz, W.; Rohm, W.; Siła-Nowicka, K.; Kopańczyk, K. Applying human mobility and water consumption data for short-term water demand forecasting using classical and machine learning models. Urban Water J. 2020, 17, 32–42.
- Srinivasan, V.; Stankovic, J.; Whitehouse, K. WaterSense: Water Flow Disaggregation Using Motion Sensors. In Proceedings of the Third ACM Workshop on Embedded Sensing Systems for Energy-Efficiency in Buildings, Seattle, WA, USA, 1–4 November 2011.
- Kozlovskiy, I.; Schöb, S.; Sodenkamp, M. Non-intrusive disaggregation of water consumption data in a residential household. In Lecture Notes in Informatics (LNI), Proceedings—Series of the Gesellschaft fur Informatik (GI); Gesellschaft fur Informatik (GI): Bremen, Germany, 2016; Volume P-259, pp. 1381–1387.
- Vitter, J.S.; Webber, M. Water Event Categorization Using Sub-Metered Water and Coincident Electricity Data. Water 2018, 10, 714.
- Nguyen, K.A.; Stewart, R.A.; Zhang, H. An autonomous and intelligent expert system for residential water end-use classification. Expert Syst. Appl. 2014, 41, 342–356.
- Makki, A.A.; Stewart, R.A.; Beal, C.D.; Panuwatwanich, K. Novel bottom-up urban water demand forecasting model: Revealing the determinants, drivers and predictors of residential indoor end-use consumption. Resour. Conserv. Recycl. 2015, 95, 15–37.
- Pastor-Jabaloyes, L.; Arregui, F.J.; Cobacho, R. Water end use disaggregation based on soft computing techniques. Water 2018, 10, 46.
- Rizzoli, A.E.; Castelletti, A.; Cominola, A.; Fraternali, P.; Diniz Dos Santos, A.; Storni, B.; Wissmann-Alves, R.; Bertocchi, M.; Novak, J.; Micheel, I. The SmartH2O project and the role of social computing in promoting efficient residential water use: A first analysis. In Proceedings of the 7th International Congress on Environmental Modelling and Software: Bold Visions for Environmental Modeling, iEMSs 2014, San Diego, CA, USA, 15–19 June 2014; Volume 3, pp. 1559–1567.
- Di Mauro, A.; Di Nardo, A.; Santonastaso, G.F.; Venticinque, S. Development of an IoT System for the Generation of a Database of Residential Water End-Use Consumption Time Series. Environ. Sci. Proc. 2020, 2, 2020.
- Godoy, D.; Amandi, A. A conceptual clustering approach for user profiling in personal information agents. AI Commun. 2006, 19, 207–227.
- Cominola, A.; Nguyen, K.; Giuliani, M.; Stewart, R.A.; Maier, H.R.; Castelletti, A. Data Mining to Uncover Heterogeneous Water Use Behaviors From Smart Meter Data. Water Resour. Res. 2019, 55, 9315–9333.
- Gato-Trinidad, S.; Jayasuriya, N.; Roberts, P. Understanding urban residential end uses of water. Water Sci. Technol. 2011, 64, 36–42.
- Randall, T.; Koech, R. Smart water metering technology for water management in urban areas. Water e-J. 2019, 4, 1–14.
- Gurung, T.R.; Stewart, R.A.; Beal, C.D.; Sharma, A.K. Smart meter enabled water end-use demand data: Platform for the enhanced infrastructure planning of contemporary urban water supply networks. J. Clean. Prod. 2015, 87, 642–654.
- Cufoglu, A. User Profiling—A Short Review. Int. J. Comput. Appl. 2014, 108, 1–9.
- Kanoje, S.; Girase, S.; Mukhopadhyay, D. User Profiling Trends, Techniques and Applications. Int. J. Adv. Found. Res. Comput. 2014, 1, 2348–4853.
- Duerr, I.; Merrill, H.R.; Wang, C.; Bai, R.; Boyer, M.; Dukes, M.D.; Bliznyuk, N. Forecasting urban household water demand with statistical and machine learning methods using large space-time data: A Comparative study. Environ. Model. Softw. 2018, 102, 29–38.
- Lee, J. Residential water demand analysis of a Low-Income Rate Assistance Program in California, United States. Water Environ. J. 2016, 30, 49–61.
- Beckel, C.; Sadamori, L.; Staake, T.; Santini, S. Revealing household characteristics from smart meter data. Energy 2014, 78, 397–410.
- Rees, P.; Clark, S.; Nawaz, R. Household Forecasts for the Planning of Long-Term Domestic Water Demand: Application to London and the Thames Valley. Popul. Space Place 2020, 26, e2288.
- Leyli-Abadi, M.; Samé, A.; Oukhellou, L.; Cheifetz, N.; Mandel, P.; Féliers, C.; Chesneau, O. Predictive classification of water consumption time series using non-homogeneous markov models. In Proceedings of the 2017 International Conference on Data Science and Advanced Analytics, DSAA 2017, Tokyo, Japan, 19–21 October 2017; Institute of Electrical and Electronics Engineers Inc.: Piscataway, NJ, USA, 2017; Volume 2018-January, pp. 323–331.
- Stagge, J.H.; Rosenberg, D.E.; Abdallah, A.M.; Akbar, H.; Attallah, N.A.; James, R. Assessing data availability and research reproducibility in hydrology and water resources. Sci. Data 2019, 6, 190030.
- Trabucchi, D.; Buganza, T. Data-driven innovation: Switching the perspective on Big Data. Eur. J. Innov. Manag. 2019, 22, 23–40.
- Adamala, S. An Overview of Big Data Applications in Water Resources Engineering. Mach. Learn. Res. 2017, 2, 10–18.
- Van Tuyl, S.; Whitmire, A.L. Water, water, everywhere: Defining and assessing data sharing in Academia. PLoS ONE 2016, 11, e0147942.
- Zipper, S.C.; Stack Whitney, K.; Deines, J.M.; Befus, K.M.; Bhatia, U.; Albers, S.J.; Beecher, J.; Brelsford, C.; Garcia, M.; Gleeson, T.; et al. Balancing Open Science and Data Privacy in the Water Sciences. Water Resour. Res. 2019, 55, 5202–5211.
- Heinrich, M. Water End-Use and Efficiency Project (Weep)—A Case Study. In Proceedings of the SB07 Transforming Our Built Environment, Auckland, New Zealand, 14–16 November 2007; Volume 136, p. 8.
- Jolly, M.D.; Lothes, A.D.; Bryson, L.S.; Ormsbee, L. Research database of water distribution system models. J. Water Resour. Plan. Manag. 2014, 140, 410–416.
- Fernandes, F.; Morais, H.; Faria, P.; Vale, Z.; Ramos, C. SCADA house intelligent management for energy efficiency analysis in domestic consumers. In Proceedings of the 2013 IEEE PES Conference on Innovative Smart Grid Technologies, ISGT LA 2013, Washington, DC, USA, 24–27 February 2013.
- Di Mauro, A.; Di Nardo, A.; Santonastaso, G.F.; Venticinque, S. An IoT system for monitoring and data collection of residential water end-use consumption. In Proceedings of the International Conference on Computer Communications and Networks, ICCCN, Valencia, Spain, 29 July–1 August 2019.
- Beal, C.D.; Stewart, R.A.; Huang, T.; Rey, E. SEQ residential end use study. In Smart Water Systems & Metering; Urban Water Security Research Alliance: Brisbane, Australia, 2011.
- Makonin, S.; Ellert, B.; Bajić, I.V.; Popowich, F. Electricity, water, and natural gas consumption of a residential house in Canada from 2012 to 2014. Sci. Data 2016, 3, 160037.
- Cominola, A.; Ghetti, A.; Castelletti, A. Building an open high-resolution residential water end-use dataset with non-intrusive metering, intrusive metering, and water use diaries. In Proceedings of the Geophysical Research Abstracts, EGU General Assembly, Vienna, Austria, 8–13 April 2018.
- Giurco, D.P.; White, S.B.; Stewart, R.A. Smart metering and water end-use data: Conservation benefits and privacy risks. Water 2010, 2, 461–467.
- Blokker, E.J.; Vreeburg, J.H.; van Dijk, J.C. Simulating residential water demand with a stochastic end-use model. J. Water Resour. Plan. Manag. 2010, 136, 19–26.
- Cominola, A.; Giuliani, M.; Castelletti, A.; Abdallah, A.M.; Rosenberg, D.E. Developing a stochastic simulation model for the generation of residential water end-use demand time series. In Proceedings of the 8th International Congress on Environmental Modelling and Software, Toulouse, France, 10–14 July 2016.
- Mostafavi, N.; Gándara, F.; Hoque, S. Predicting water consumption from energy data: Modeling the residential energy and water nexus in the integrated urban metabolism analysis tool (IUMAT). Energy Build. 2018, 158, 1683–1693.
- DeOreo, W.B.; Heaney, J.P.; Mayer, P.W. Flow trace analysis to access water use. J.—Am. Water Work. Assoc. 1996, 88, 79–90.
- Nguyen, K.A.; Stewart, R.A.; Zhang, H.; Jones, C. Intelligent autonomous system for residential water end use classification: Autoflow. Appl. Soft Comput. J. 2015, 31, 118–131.
- Yang, A.; Zhang, H.; Stewart, R.A.; Nguyen, K.A. Water end use clustering using hybrid pattern recognition techniques—Artificial Bee Colony, Dynamic Time Warping and K-Medoids clustering. Int. J. Mach. Learn. Comput. 2018, 8, 483–487.
- Walton, A.; Hume, M. Creating positive habits in water conservation: The case of the Queensland Water Commission and the Target 140 campaign. Int. J. Nonprofit Volunt. Sect. Mark. 2011, 16, 215–224.
- Nguyen, K.; Zhang, H.; Stewart, R.A. Development of an intelligent model to categorise residential water end use events. J. Hydro-Environ. Res. 2013, 7.
- Bennett, C.; Stewart, R.A.; Beal, C.D. ANN-based residential water end-use demand forecasting model. Expert Syst. Appl. 2013, 40, 1014–1023.
- Willis, R.; Stewart, R.A.; Panuwatwanich, K.; Capati, B.; Giurco, D. Gold coast domestic water end use study. Water 2009, 36, 84–90.

