 +1 credit
| Version | Summary | Created by | Modification | Content Size | Created at | Operation |
|---|---|---|---|---|---|---|
| 1 | Giovanni Targher | + 2927 word(s) | 2927 | 2021-01-08 09:53:35 | | | |
| 2 | Rita Xu | -1240 word(s) | 1687 | 2021-01-11 05:26:42 | | |
Video Upload Options
Recent randomized controlled trials (RCTs) tested the efficacy of sodium-glucose cotransporter-2 (SGLT-2) inhibitors to specifically treat nonalcoholic fatty liver disease (NAFLD). We systematically searched three large electronic databases (up to 31 October 2020) for identifying placebo-controlled or active-controlled RCTs that used different SGLT-2 inhibitors (dapagliflozin, empagliflozin, ipragliflozin or canagliflozin) for treatment of NAFLD.
1. Introduction
Nonalcoholic fatty liver disease (NAFLD) has reached epidemic proportions in many parts of the world, and is estimated to affect up to ~70–80% of people with type 2 diabetes mellitus (T2DM) [1][2]. Substantial evidence shows that the coexistence of T2DM and NAFLD synergistically increases the risk of developing not only the more severe histologic forms of NAFLD (nonalcoholic steatohepatitis (NASH), cirrhosis and hepatocellular carcinoma), but also the risk of developing cardiovascular disease and other chronic complications of diabetes [3][4][5]. Therefore, early recognition of NAFLD and monitoring for NASH with advanced fibrosis in people with T2DM are crucial. The coexistence of NASH in a subject with T2DM should call for taking advantage of glucose-lowering agents with proven efficacy to improve cardiometabolic health and prevent liver disease progression [6].
To date, there are currently no approved drugs to treat NAFLD or NASH. Of all glucose-lowering drugs, pioglitazone is the best-studied pharmacological drug in NASH. Although there is evidence that long-term use of pioglitazone in individuals with biopsy-proven NASH has beneficial effects on serum liver enzyme levels, liver fat and histological resolution of NASH amongst individuals with and without T2DM, this drug may have some side-effects, such as moderate weight gain, fluid retention and risk of distal bone fractures (mostly in post-menopausal women) [7][8]. Promising results on liver fat and histological resolution of NASH have recently been reported also in some phase-2 RCTs using glucagon-like peptide-1 receptor agonists, such as liraglutide and semaglutide [9][10].
Sodium-glucose cotransporter-2 (SGLT-2) inhibitors are a novel class of oral glucose-lowering drugs approved for treatment of T2DM. By reducing the renal capacity to reabsorb filtered glucose, SGLT-2 inhibitors increase renal glycosuria and osmotic diuresis, thereby improving glucose control and exerting additional positive effects, such as weight loss and the lowering of blood pressure [11]. Recent large randomized controlled trials (RCTs) on SGLT-2 inhibitors have consistently shown that these glucose-lowering drugs also exert favorable long-term effects on risk of major cardiovascular events, including worsening of heart failure and deterioration of nephropathy, in people with T2DM [12][13][14][15][16].
As SGLT-2 inhibitors improve not only glycemic control, but also body weight and blood pressure, a number of observational cohort studies and RCTs have recently examined the possible beneficial effects of this novel class of glucose-lowering medications in individuals with T2DM and NAFLD [7][17][18].
2. Results
Supplementary Figure S1 summarizes the results of the literature research and study selection. We initially found 14 potentially eligible RCTs from three large electronic databases prior to 31 October 2020 [19][20][21][22][23][24][25][26][27][28][29][30][31][32]. After examining the full text of these publications, we excluded two studies [31][32] for reasons mainly due to unsatisfactory study design (as specified in Supplementary Table S1). Therefore, a total of twelve RCTs (seven placebo-controlled studies [19][21][23][24][25][26][28] and five head-to-head studies [20][22][27][29][30]) were considered eligible for inclusion in the meta-analysis and were assessed for quality.
The main characteristics of the included RCTs are summarized in Supplementary Table S2. In total, there were 850 middle-aged overweight or obese individuals with NAFLD (59% men; mean (±SD) age 57 ± 6 years; mean body mass index 31 ± 2 kg/m2; mean alanine aminotransferase (ALT) 41 ± 11 IU/L; mean aspartate aminotransferase (AST) 31 ± 7 IU/L; mean gamma-glutamyltransferase (GGT) 59 ± 17 IU/L), who were followed-up for a median period of 24 weeks (interquartile range: 21–25 weeks). Among these individuals, 414 were randomly assigned to either placebo or reference therapy, whereas 436 were randomly assigned to active treatment with dapagliflozin (n = 6 RCTs [19][22][24][25][27][30]), empagliflozin (n = 3 RCTs [21][26][28]), ipragliflozin (n = 2 RCTs [20][29]) or canagliflozin (n = 1 RCT [23]) in order to specifically treat NAFLD. As shown in Supplementary Table S2, the vast majority of the eligible RCTs (n = 11 studies [19][20][21][22][23][24][25][26][27][29][30]) included patients with NAFLD and T2DM (n = 760, 90% of total participants), whereas only one RCT [28], involving 90 individuals, was conducted in patients without T2DM. Two RCTs [19][27] included international cohorts of patients with NAFLD, six RCTs [20][21][25][28][29][30] were carried out in Asia (Japan, South Korea, India and Iran), three RCTs [22][24][26] were carried out in Europe (Germany and Sweden) and one RCT was carried out in the United States [23]. In all eligible RCTs, the diagnosis of NAFLD was based on imaging techniques, such as Fibroscan® with associated with controlled attenuation parameter (CAP) [25][28][29], computed tomography [20][30], magnetic resonance imaging-proton density fat fraction (MRI-PDFF) or magnetic resonance spectroscopy (MRS) [19][21][22][23][24][26][27]. No published RCTs with paired liver biopsy data were currently available for the meta-analysis. In all eligible RCTs, SGLT-2 inhibitors were usually well tolerated and had a comparable adverse event profile to placebo or reference therapy, except for a higher frequency of genitourinary infections. In Supplementary Table S3, the risk of bias for each eligible RCT assessed by the Cochrane Collaboration’s tool is summarized, which includes seven potential sources of bias. For each domain, we categorized each RCT into three categories: low, unclear, or high risk of bias.
As shown in Figure 1, when compared to placebo/reference therapy, treatment with SGLT-2 inhibitors significantly decreased the levels of serum ALT (panel A: n = 9 RCTs; pooled weighted mean differences (WMD): −10.0 IU/L, 95%CI −12.2 to −7.79 IU/L; I2 = 10.5%) and serum GGT (panel C: n = 6 RCTs; pooled WMD: −14.49 IU/L, 95%CI −19.35 to −9.63 IU/L; I2 = 38.7%). Serum AST levels did not differ between the two arms of treatment (panel B: n = 9 RCTs; pooled WMD: −1.87 IU/L, 95%CI −5.88 to 2.14 IU/L; I2 = 78.9%).
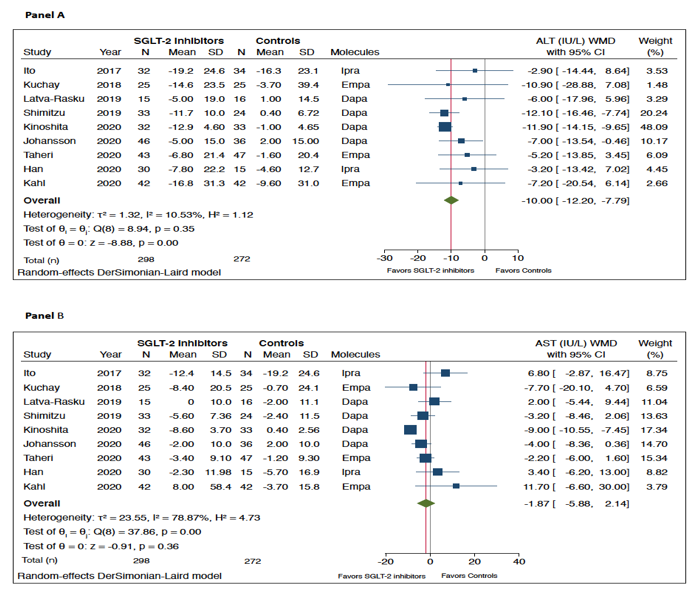
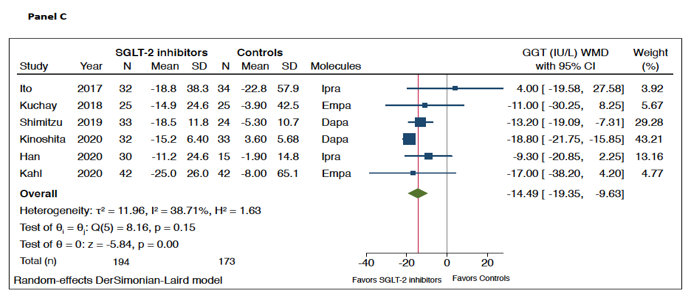
Figure 1. Forest plot of the effect of SGLT-2 inhibitors on serum liver enzyme levels (i.e., serum alanine aminotransferase (ALT) (n = 9 randomized controlled trials (RCTs), panel A), aspartate aminotransferase (AST) (n = 9 RCTs, panel B), and gamma-glutamyltransferase (GGT) (n = 6 RCTs, panel C)) as compared with placebo or reference therapy. The effect size was expressed as weighted mean difference (WMD) and 95% confidence intervals for all RCTs included. Note: If not available, the SDs of the weighted mean difference were estimated using a specific formula (as reported in the Methods section).
Figure 2 shows the forest plots and pooled estimates of the effect of different SGLT-2 inhibitors on liver fat content assessed by magnetic resonance-based techniques. Overall, in the seven RCTs included in this analysis, the pooled mean relative percent changes of liver fat content in those treated with SGLT-2 inhibitors and those treated with placebo/reference therapy at the end of the trials were −29% vs. −5.8%, respectively. As shown in the figure, when compared to placebo or reference therapy, treatment with SGLT-2 inhibitors was associated with a significant improvement in the absolute percentage of liver fat content assessed by MRI-PDFF or MRS (n = 7 RCTs; pooled WMD: −2.05%, 95%CI −2.61 to −1.48%; I2 = 0%; Z-test for overall effect = −7.07, p < 0.0001).
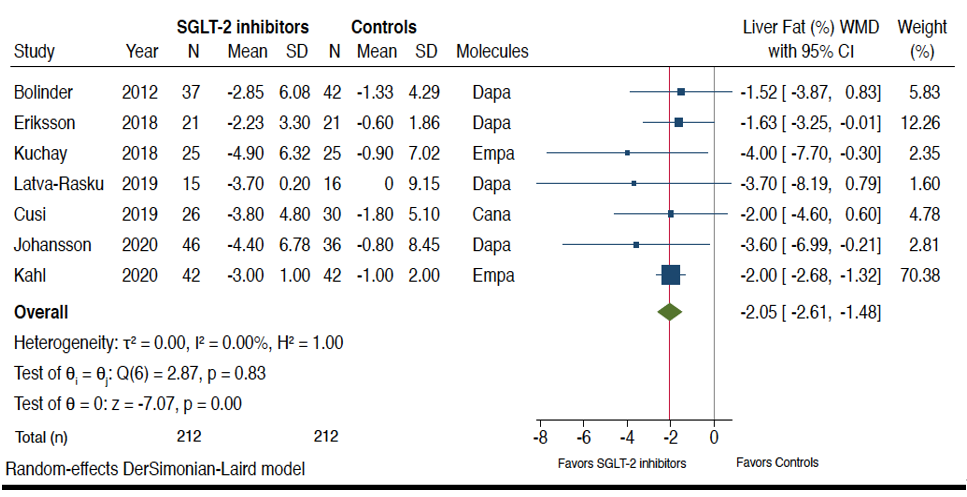
Figure 2. Forest plot of the effect of SGLT-2 inhibitors on the absolute percentage of liver fat content assessed by magnetic resonance-based techniques (n = 7 RCTs using either magnetic resonance imaging-proton density fat fraction (MRI-PDFF) or magnetic resonance spectroscopy (MRS)). The effect size was expressed as weighted mean difference (WMD) and 95% confidence intervals for all RCTs included. Note: If not available, the SDs of the weighted mean difference were estimated using a specific formula (as reported in the Methods section). In the study of Bolinder et al. [19], the investigators reported only the placebo-corrected difference in mean percent MRI-PDFF with dapagliflozin.
Table 1 summarizes the pooled estimates of the effect of SGLT-2 inhibitors on liver fat content (not only detected by magnetic resonance imaging—as also previously reported in Figure 2—but also by either CAP on Fibroscan® or computed tomography), as well as on liver stiffness measurement (LSM) assessed with vibration-controlled transient elastography (Fibroscan®). In line with the results already reported in Figure 2 where seven RCTs were available for the pooled primary analysis, treatment with SGLT-2 inhibitors also showed a small improvement in liver fat content when assessed either by CAP on Fibroscan® (n = 3 RCTs; WMD: −13.9 dB/m, 95%CI −30.1 to +2.20 dB/m; I2 = 43.7%; Z-test for overall effect = 1.69, p = 0.089) or by the liver-to-spleen attenuation ratio on computed tomography (n = 2 RCTs). It is known that the Hounsfield Unit attenuation of liver on computed tomography scans is usually higher than the spleen; when this ratio is reversed, this can be used to diagnose the presence of hepatic steatosis. Liver-to-spleen attenuation ratio <1.0 can be used effectively to diagnose the presence of hepatic steatosis. Finally, as also shown in Table 1, when compared to placebo/reference therapy, treatment with SGLT-2 inhibitors tended to improve LSMs assessed by Fibroscan® (n = 2 RCTs; WMD: −0.65 kPa, 95%CI −1.48 to +0.20 kPa; I2 = 14.0%; Z-test for overall effect = 1.48, p = 0.097).
Table 1. Effects of SGLT-2 inhibitors on liver fat content (assessed by magnetic resonance-based techniques (MRI-PDFF or MRS), controlled attenuation parameter (CAP) on Fibroscan® and computed tomography (CT)), as well as on liver stiffness measurement assessed by vibration-controlled transient elastography (Fibroscan®).
|
|
WMD |
Test Z for Overall Effect |
Number of RCTs Included |
Number of Subjects Assigned to Placebo or Reference Therapy |
Number of Subjects Assigned to SGLT-2 Inhibitors |
Heterogeneity I2 |
|
Liver fat content |
|
|
|
|
|
|
|
MRI-PDFF or MRS (%) |
−2.05(−2.61 to −1.48) |
Z = 7.07, p < 0.0001 |
7 |
212 |
212 |
0.0% |
|
Controlled attenuation parameter (dB/m) |
−13.9(−30.1 to +2.20) |
Z=1.69, p = 0.089 |
3 |
86 |
106 |
43.7% |
|
CT-Liver-to-spleen attenuation ratio |
+0.10(−0.06 to +0.23) |
Z = 1.14, p = 0.256 |
2 |
67 |
64 |
86.2% |
|
Liver stiffness on Fibroscan® |
|
|
|
|
|
|
|
Liver stiffness measurement (kPa) |
− 0.65 (−1.48 to +0.20) |
Z = 1.48, p = 0.097 |
2 |
71 |
76 |
14.0% |
We tested for the possibility of excessive influence of individual RCTs using an influence test that eliminated each of the included RCTs one at a time. Notably, eliminating each of the eligible RCTs from the analysis did not have any significant effects on changes both in serum liver enzyme levels and in the absolute percentage of liver fat content, assessed by MRI-PDFF or MRS (data not shown).
As summarized in Supplementary Figure S2, when compared to placebo or reference therapy, treatment with SGLT-2 inhibitors was associated with a significant reduction in body weight (panel A: n = 9 RCTs; pooled WMD: −3.74 kg, 95% CI −2.56 to −4.91 kg; I2 = 0%), along with a small improvement in hemoglobin A1c levels (panel B: n = 7 RCTs; pooled WMD: −0.19%, 95% CI −0.08 to −0.30; I2 = 11.9%).
As reported in Supplementary Figure S3, the rank correlation Begg’s test did not show any statistically significant asymmetry of the funnel plots of the eligible RCTs examining the effect of SGLT-2 inhibitors on changes in serum ALT levels and MRI-assessed liver fat content (p-values = 0.677 and 0.881, respectively), thereby suggesting that publication bias was unlikely.
References
- Non-alcoholic Fatty Liver Disease Study, G.; Lonardo, A.; Bellentani, S.; Argo, C.K.; Ballestri, S.; Byrne, C.D.; Caldwell, S.H.; Cortez-Pinto, H.; Grieco, A.; Machado, M.V.; et al. Epidemiological modifiers of non-alcoholic fatty liver disease: Focus on high-risk groups. Liver Dis. 2015, 47, 997–1006, doi:10.1016/j.dld.2015.08.004.
- Younossi, Z.M. Non-alcoholic fatty liver disease—A global public health perspective. Hepatol. 2019, 70, 531–544, doi:10.1016/j.jhep.2018.10.033.
- Younossi, Z.; Anstee, Q.M.; Marietti, M.; Hardy, T.; Henry, L.; Eslam, M.; George, J.; Bugianesi, E. Global burden of NAFLD and NASH: Trends, predictions, risk factors and prevention. Rev. Gastroenterol. Hepatol. 2018, 15, 11–20, doi:10.1038/nrgastro.2017.109.
- Targher, G.; Lonardo, A.; Byrne, C.D. Nonalcoholic fatty liver disease and chronic vascular complications of diabetes mellitus. Rev. Endocrinol. 2018, 14, 99–114, doi:10.1038/nrendo.2017.173.
- Mantovani, A.; Scorletti, E.; Mosca, A.; Alisi, A.; Byrne, C.D.; Targher, G. Complications, morbidity and mortality of nonalcoholic fatty liver disease. Metabolism 2020, doi:10.1016/j.metabol.2020.154170.
- Budd, J.; Cusi, K. Role of Agents for the Treatment of Diabetes in the Management of Nonalcoholic Fatty Liver Disease. Diab. Rep. 2020, 20, 59, doi:10.1007/s11892-020-01349-1.
- Mantovani, A.; Byrne, C.D.; Scorletti, E.; Mantzoros, C.S.; Targher, G. Efficacy and safety of anti-hyperglycaemic drugs in patients with non-alcoholic fatty liver disease with or without diabetes: An updated systematic review of randomized controlled trials. Diabetes Metab. 2020, doi:10.1016/j.diabet.2019.12.007.
- Cusi, K. A diabetologist’s perspective of non-alcoholic steatohepatitis (NASH): Knowledge gaps and future directions. Liver Int. 2020, 40 (Suppl S1), 82–88, doi:10.1111/liv.14350.
- Armstrong, M.J.; Gaunt, P.; Aithal, G.P.; Barton, D.; Hull, D.; Parker, R.; Hazlehurst, J.M.; Guo, K.; LEAN Trial Team; Abouda, G.; et al. Liraglutide safety and efficacy in patients with non-alcoholic steatohepatitis (LEAN): A multicentre, double-blind, randomised, placebo-controlled phase 2 study. Lancet 2016, 387, 679–690, doi:10.1016/S0140-6736(15)00803-X.
- Newsome, P.N.; Buchholtz, K.; Cusi, K.; Linder, M.; Okanoue, T.; Ratziu, V.; Sanyal, A.J.; Sejling, A.S.; Harrison, S.A.; Investigators, N.N. A Placebo-Controlled Trial of Subcutaneous Semaglutide in Nonalcoholic Steatohepatitis. Engl. J. Med. 2020, doi:10.1056/NEJMoa2028395.
- Scheen, A.J. Sodium-glucose cotransporter type 2 inhibitors for the treatment of type 2 diabetes mellitus. Rev. Endocrinol. 2020, 16, 556–577, doi:10.1038/s41574-020-0392-2.
- Schernthaner, G.; Schernthaner-Reiter, M.H.; Schernthaner, G.H. EMPA-REG and Other Cardiovascular Outcome Trials of Glucose-lowering Agents: Implications for Future Treatment Strategies in Type 2 Diabetes Mellitus. Ther. 2016, 38, 1288–1298, doi:10.1016/j.clinthera.2016.04.037.
- Zelniker, T.A.; Braunwald, E. Clinical Benefit of Cardiorenal Effects of Sodium-Glucose Cotransporter 2 Inhibitors: JACC State-of-the-Art Review. Am. Coll. Cardiol. 2020, 75, 435–447, doi:10.1016/j.jacc.2019.11.036.
- Wu, J.H.; Foote, C.; Blomster, J.; Toyama, T.; Perkovic, V.; Sundstrom, J.; Neal, B. Effects of sodium-glucose cotransporter-2 inhibitors on cardiovascular events, death, and major safety outcomes in adults with type 2 diabetes: A systematic review and meta-analysis. Lancet Diabetes Endocrinol. 2016, 4, 411–419, doi:10.1016/S2213-8587(16)00052-8.
- Zelniker, T.A.; Braunwald, E. Mechanisms of Cardiorenal Effects of Sodium-Glucose Cotransporter 2 Inhibitors: JACC State-of-the-Art Review. Am. Coll. Cardiol. 2020, 75, 422–434, doi:10.1016/j.jacc.2019.11.031.
- Zelniker, T.A.; Wiviott, S.D.; Raz, I.; Im, K.; Goodrich, E.L.; Furtado, R.H.M.; Bonaca, M.P.; Mosenzon, O.; Kato, E.T.; Cahn, A.; et al. Comparison of the Effects of Glucagon-Like Peptide Receptor Agonists and Sodium-Glucose Cotransporter 2 Inhibitors for Prevention of Major Adverse Cardiovascular and Renal Outcomes in Type 2 Diabetes Mellitus. Circulation 2019, 139, 2022–2031, doi:10.1161/CIRCULATIONAHA.118.038868.
- Hsiang, J.C.; Wong, V.W. SGLT2 Inhibitors in Liver Patients. Gastroenterol. Hepatol. 2020, 18, 2168–2172.e2, doi:10.1016/j.cgh.2020.05.021.
- Dougherty, J.A.; Guirguis, E.; Thornby, K.A. A Systematic Review of Newer Antidiabetic Agents in the Treatment of Nonalcoholic Fatty Liver Disease. Pharmacother. 2021, 55, 65–79, doi:10.1177/1060028020935105.
- Bolinder, J.; Ljunggren, O.; Kullberg, J.; Johansson, L.; Wilding, J.; Langkilde, A.M.; Sugg, J.; Parikh, S. Effects of dapagliflozin on body weight, total fat mass, and regional adipose tissue distribution in patients with type 2 diabetes mellitus with inadequate glycemic control on metformin. Clin. Endocrinol. Metab. 2012, 97, 1020–1031, doi:10.1210/jc.2011-2260.
- Ito, D.; Shimizu, S.; Inoue, K.; Saito, D.; Yanagisawa, M.; Inukai, K.; Akiyama, Y.; Morimoto, Y.; Noda, M.; Shimada, A. Comparison of Ipragliflozin and Pioglitazone Effects on Nonalcoholic Fatty Liver Disease in Patients With Type 2 Diabetes: A Randomized, 24-Week, Open-Label, Active-Controlled Trial. Diabetes Care 2017, 40, 1364–1372, doi:10.2337/dc17-0518.
- Kuchay, M.S.; Krishan, S.; Mishra, S.K.; Farooqui, K.J.; Singh, M.K.; Wasir, J.S.; Bansal, B.; Kaur, P.; Jevalikar, G.; Gill, H.K.; et al. Effect of Empagliflozin on Liver Fat in Patients With Type 2 Diabetes and Nonalcoholic Fatty Liver Disease: A Randomized Controlled Trial (E-LIFT Trial). Diabetes Care 2018, 41, 1801–1808, doi:10.2337/dc18-0165.
- Eriksson, J.W.; Lundkvist, P.; Jansson, P.A.; Johansson, L.; Kvarnstrom, M.; Moris, L.; Miliotis, T.; Forsberg, G.B.; Riserus, U.; Lind, L.; et al. Effects of dapagliflozin and n-3 carboxylic acids on non-alcoholic fatty liver disease in people with type 2 diabetes: A double-blind randomised placebo-controlled study. Diabetologia 2018, 61, 1923–1934, doi:10.1007/s00125-018-4675-2.
- Cusi, K.; Bril, F.; Barb, D.; Polidori, D.; Sha, S.; Ghosh, A.; Farrell, K.; Sunny, N.E.; Kalavalapalli, S.; Pettus, J.; et al. Effect of canagliflozin treatment on hepatic triglyceride content and glucose metabolism in patients with type 2 diabetes. Diabetes Obes. Metab. 2019, 21, 812–821, doi:10.1111/dom.13584.
- Latva-Rasku, A.; Honka, M.J.; Kullberg, J.; Mononen, N.; Lehtimaki, T.; Saltevo, J.; Kirjavainen, A.K.; Saunavaara, V.; Iozzo, P.; Johansson, L.; et al. The SGLT2 Inhibitor Dapagliflozin Reduces Liver Fat but Does Not Affect Tissue Insulin Sensitivity: A Randomized, Double-Blind, Placebo-Controlled Study With 8-Week Treatment in Type 2 Diabetes Patients. Diabetes Care 2019, 42, 931–937, doi:10.2337/dc18-1569.
- Shimizu, M.; Suzuki, K.; Kato, K.; Jojima, T.; Iijima, T.; Murohisa, T.; Iijima, M.; Takekawa, H.; Usui, I.; Hiraishi, H.; et al. Evaluation of the effects of dapagliflozin, a sodium-glucose co-transporter-2 inhibitor, on hepatic steatosis and fibrosis using transient elastography in patients with type 2 diabetes and non-alcoholic fatty liver disease. Diabetes Obes. Metab. 2019, 21, 285–292, doi:10.1111/dom.13520.
- Kahl, S.; Gancheva, S.; Strassburger, K.; Herder, C.; Machann, J.; Katsuyama, H.; Kabisch, S.; Henkel, E.; Kopf, S.; Lagerpusch, M.; et al. Empagliflozin Effectively Lowers Liver Fat Content in Well-Controlled Type 2 Diabetes: A Randomized, Double-Blind, Phase 4, Placebo-Controlled Trial. Diabetes Care 2020, 43, 298–305, doi:10.2337/dc19-0641.
- Johansson, L.; Hockings, P.D.; Johnsson, E.; Dronamraju, N.; Maaske, J.; Garcia-Sanchez, R.; Wilding, J.P.H. Dapagliflozin plus saxagliptin add-on to metformin reduces liver fat and adipose tissue volume in patients with type 2 diabetes. Diabetes Obes. Metab. 2020, 22, 1094–1101, doi:10.1111/dom.14004.
- Taheri, H.; Malek, M.; Ismail-Beigi, F.; Zamani, F.; Sohrabi, M.; Reza Babaei, M.; Khamseh, M.E. Effect of Empagliflozin on Liver Steatosis and Fibrosis in Patients With Non-Alcoholic Fatty Liver Disease Without Diabetes: A Randomized, Double-Blind, Placebo-Controlled Trial. Ther. 2020, 37, 4697–4708, doi:10.1007/s12325-020-01498-5.
- Han, E.; Lee, Y.H.; Lee, B.W.; Kang, E.S.; Cha, B.S. Ipragliflozin Additively Ameliorates Non-Alcoholic Fatty Liver Disease in Patients with Type 2 Diabetes Controlled with Metformin and Pioglitazone: A 24-Week Randomized Controlled Trial. Clin. Med. 2020, 9, 259, doi:10.3390/jcm9010259.
- Kinoshita, T.; Shimoda, M.; Nakashima, K.; Fushimi, Y.; Hirata, Y.; Tanabe, A.; Tatsumi, F.; Hirukawa, H.; Sanada, J.; Kohara, K.; et al. Comparison of the effects of three kinds of glucose-lowering drugs on non-alcoholic fatty liver disease in patients with type 2 diabetes: A randomized, open-label, three-arm, active control study. Diabetes Investig. 2020, 11, 1612–1622, doi:10.1111/jdi.13279.
- Lai, L.L.; Vethakkan, S.R.; Nik Mustapha, N.R.; Mahadeva, S.; Chan, W.K. Empagliflozin for the Treatment of Nonalcoholic Steatohepatitis in Patients with Type 2 Diabetes Mellitus. Dis. Sci. 2020, 65, 623–631, doi:10.1007/s10620-019-5477-1.
- Gallo, S.; Calle, R.A.; Terra, S.G.; Pong, A.; Tarasenko, L.; Raji, A. Effects of Ertugliflozin on Liver Enzymes in Patients with Type 2 Diabetes: A Post-Hoc Pooled Analysis of Phase 3 Trials. Diabetes Ther. 2020, 11, 1849–1860, doi:10.1007/s13300-020-00867-1.

