Submitted Successfully!
To reward your contribution, here is a gift for you: A free trial for our video production service.
Thank you for your contribution! You can also upload a video entry or images related to this topic.
Version Summary Created by Modification Content Size Created at Operation
1 -- 5372 2024-01-31 13:55:18 |
2 format correct Meta information modification 5372 2024-02-01 08:07:23 | |
3 format correct Meta information modification 5372 2024-02-01 08:08:04 | |
4 format correct Meta information modification 5372 2024-02-05 08:51:30 | |
5 format correct Meta information modification 5372 2024-03-07 09:57:32 |

Video Upload Options

Do you have a full video?

Confirm

Are you sure to Delete?
Cite
If you have any further questions, please contact Encyclopedia Editorial Office.
Elneel, L.; Zitouni, M.S.; Mukhtar, H.; Galli, P.; Al-Ahmad, H. Coastal Assessment and MAM of Sea Level Rise. Encyclopedia. Available online: https://encyclopedia.pub/entry/54593 (accessed on 06 May 2024).
Elneel L, Zitouni MS, Mukhtar H, Galli P, Al-Ahmad H. Coastal Assessment and MAM of Sea Level Rise. Encyclopedia. Available at: https://encyclopedia.pub/entry/54593. Accessed May 06, 2024.
Elneel, Leena, M. Sami Zitouni, Husameldin Mukhtar, Paolo Galli, Hussain Al-Ahmad. "Coastal Assessment and MAM of Sea Level Rise" Encyclopedia, https://encyclopedia.pub/entry/54593 (accessed May 06, 2024).
Elneel, L., Zitouni, M.S., Mukhtar, H., Galli, P., & Al-Ahmad, H. (2024, January 31). Coastal Assessment and MAM of Sea Level Rise. In Encyclopedia. https://encyclopedia.pub/entry/54593
Elneel, Leena, et al. "Coastal Assessment and MAM of Sea Level Rise." Encyclopedia. Web. 31 January, 2024.
Coastal Assessment and MAM of Sea Level Rise
Edit

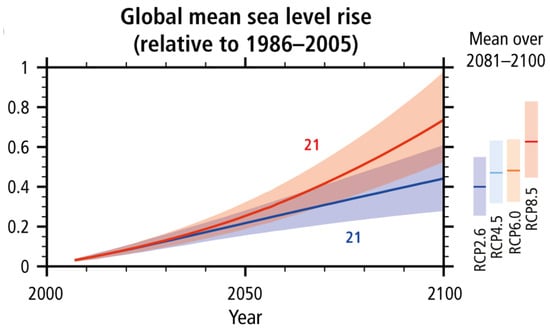
Sea level rise (SLR) is one of the most pressing challenges of climate change and has drawn noticeable research interest. Factors induced by global climate change, such as temperature increase, have resulted in both direct and indirect changes in sea levels at different spatial scales. Various climatic and non-climatic events contribute to sea level changes, posing risks to coastal and low-lying areas. Nevertheless, changes in sea level are not uniformly distributed globally due to several regional factors such as wave actions, storm surge frequencies, and tectonic land movement. The high exposure to those factors increases the vulnerability of subjected areas to SLR impacts. The impacts of events induced by climate change and SLR are reflected in biophysical, socioeconomic, and environmental aspects. Different indicator-based and model-based approaches are used to assess coastal areas’ vulnerabilities, response to impacts, and implementation of adaptation and mitigation measures. Various studies have been conducted to project future SLR impacts and evaluate implemented protection and adaptation approaches, aiding policymakers in planning effective adaptation and mitigation measures to reduce damage.

sea level rise climatic drivers non-climatic drivers climate change impacts coastal vulnerability

1. Introduction

Climate change is one of the most pressing challenges of the century. The increase in CO2 emissions and greenhouse gases (GHGs) is causing a rise in temperature, which leads to a range of far-reaching consequences for economies, societies, and ecosystems around the world. One of the most significant impacts of climate change is sea level rise (SLR) [1][2]. According to the Intergovernmental Panel on Climate Change (IPCC), the global mean sea level (GMSL) has been increasing at accelerating rates for the past century, reaching a rate of 3.7 mm/year in 2018 and is estimated to reach up to 77 cm by the end of the current century [3]. It is also projected that GMSL could reach up to 5.4 m by 2300 [4] depending on the rate of GHG emissions and the approaches taken to mitigate them. SLR is primarily caused by two factors: the thermal expansion of seawater and the melting of ice sheets and glaciers [2]. Other climatic and non-climatic events such as cyclone-driven events and earthquakes also contribute to changes in the regional/relative mean sea level (RMSL) [4].
Coastal areas are of significant economic and environmental importance, and increasing human activities are placing additional stress on them. The impacts of sea level rise are already persistent in many coastal areas globally [5]. Low-lying coastal areas, such as Small Island Developing States (SIDS), are particularly vulnerable to inundation, storm surges, and floods [3][4]. Areas exposed to tidal events also experience the impacts of SLR [6]. In some areas, saltwater intrusion into groundwater and freshwater aquifers threatens freshwater supplies and the production of agricultural [4][7]. Furthermore, SLR can cause physical changes to coastal areas such as coastal erosion and flooding, leading to a loss of land and infrastructure [3][8]. To address the challenges caused by climate change and SLR and reduce their impacts, a comprehensive and coordinated response is needed. This includes reducing GHG emissions to mitigate the anticipated damage of future SLR scenarios and the associated extreme weather events [9], as well as investing in adaptation measures to help vulnerable communities cope with the impacts that are already occurring [10], including hard or soft engineering solutions, ecosystem-based structures, and strategy plans [11]. The use of visualization tools that represent the relationship between impacts and contributing factors to SLR can bridge the gap in understanding the relationship between different components of SLR, raising awareness, and helping decision makers form proper mitigation and adaptation measures [5].

2. Coastal Assessment

2.1. Coastal Impact Modelling

The inundation model or bathtub model [12] is a popular and simple model that is used to assess the coastal impacts of SLR and climate-driven events at different spatial scales (i.e., global, regional, national, and local). The inundation model is a quantitative model that uses topographic maps to indicate and predict impacted areas by calculating adjacent cells that are under a certain elevation value. Although this model is widely used in research, it is reliant on the accuracy of elevation data and might provide false inundation results with a low resolution or inaccurate data with high uncertainties. The inundation model was utilized in [13] to assess SLR and flooding in coastal areas and highlighted the importance of considering vertical uncertainties inherited in the digital elevation data used. Error correction and transformation methods can also be applied to digital elevation data to increase the reliability and confidence of the analysis results. For example, the Aster Global Digital Elevation Map (GDEM), a public source of elevation data, has conducted a validation assessment of their data and enhanced the resolution using different horizontal shifts, as well as elevation error estimation and correction of Band3B error [14].
A variety of research has relied on modeling SLR via inundation. Light Detection and Ranging (LiDAR) [15] remote sensing data have been used to build an inundation model to project different scenarios of SLR in the eastern emirates of UAE. Every eight pixels in the LiDAR images were grouped to determine the adjacent pixels that should be inundated for each SLR scenario [16]. An integrated modeling system combining hydrodynamic and hydrological models was used to study the impact of SLR and river discharge on estuarine hydrodynamics and ecosystems. The 3D model utilized various tidal and climatic factors with different SLR scenarios. The results suggested that salinization was impacted by the river discharge process more than SLR. However, SLR will have more of an impact on estuarine hydrodynamics, which will eventually alter freshwater transportation into the sea [17]. The hydrological model and watershed modeling system HEC-GeoHMS were used to simulate watersheds from land to sea, which occur due to climatic events, such as rainfall and post-storm floods, as well as other human activities, including the usage of aquifers. The data used in the simulation included public elevation data, LU/LC from governmental data, and simulated rainfall data measured based on different public repositories [18].
SimCLIM [19] is an integrated modeling system that is used to assess coastal sensitivity to climate change and variability using biophysical and socioeconomic parameters. This commercialized tool also includes an SLR scenario generator that is used to measure the sensitivity of coastal areas to climatic events. This tool is applicable to all spatial scales and various computational requirements depending on the data and resolution [12]. SimCLIM modeling was used in [20] to project future changes in specific locations. The tool was set to utilize the normalized patterns of Atmosphere-Ocean General Circulation Models (AOGCMs) [21] in a multi-mode by combining GMSL, regional, and local factors [20]. Other ocean modeling tools have been used to analyze the impact of SLR in coastal areas, such as HYCOM [22] ocean modeling, which was developed for the area of the Gulf of Mexico [7]. Another example of an integrated modeling system that uses biophysical and socioeconomic components is the Dynamic Interactive Vulnerability Assessment (DIVA) [20], which produces quantitative results on the coastal vulnerabilities on spatial scales ranging from regional to local. This model utilizes a number of regional factors that contribute to SLR to measure regional SLR changes. Examples of the adaptation and impact options integrated within the DIVA model include flooding, population density, erosion, estimated land for nourishment, wetland loss, and salinization [8]. Biophysical and socioeconomic data from the DIVA model with regional variables have been used to estimate the global economic loss and coastal damage under different SLR scenarios in [23]. This study estimated a global Gross Domestic Product (GDP) loss of 0.5% and a 2% decrease in human well-being under high SLR scenarios. The drawback of this model was the elimination of some of the climate-induced factors that contributed to SLR, such as storm surges effects, and only considering a limited range of adaptation measures [20]. Other models that were used to study the ecological and environmental impacts of SLR and climatic events were the Ecological Landscape Spatial Simulation Models and Sea Level Affecting Marshes Model (SLAMM) [12].
Climate change models make use of future estimations of GHG emissions, as well as ice sheets and glacier melting to project future SLR based on how sea levels respond to changes in those factors [24]. Future projections can be based on IPCC’s Representative Concentration Pathway (RCP) emission scenarios that estimate the influence of GHG emissions on future global mean and temperature levels. Future projections under RCP2.6., RCP4.5., RCP6.0. and RCP8.5. will increase the global mean temperature by 1, 1.8, 2.2, and 3.7 Celsius degrees, and GMSL by 0.4, 0.47, 0.48, and 0.63 m, respectively, by the year 2100 [25]. Figure 1 shows the projection of GMSL under different RCP scenarios according to IPCC AR5 [25]. IPCC’s RCP emission scenarios, local vertical land movement, and glacio-hydro-isostatic movement were used to project future flooding scenarios in the Italian peninsula using topographic maps, elevation data, bathymetry data, and Interferometric Synthetic Aperture Radar (InSAR) satellite images [23]. The results obtained from this study showed that coastal areas were highly vulnerable and subject to marine flooding by the year 2100. Tide gauge data were used in [26] to extract the vertical land movement data. Different scenarios were modeled in [27] to study the impact of future SLR on the low-lying land and protection structure in the coastline of the Tianjin–Hebei district in China. Three scenarios were modeled according to values obtained from the literature (low, medium, and high) for different years (2030, 2050, and 2100), taking into consideration land subsidence and flooding that can result from extreme storm surge events (occurrence rate of once in 50 years, 100 years, 200 years, and 500 years), which were modeled via the Regional Ocean Modelling System (ROMS). SLR projections were used in [10] as a part of a systematic planning strategy to evaluate three different adaptation measures, which ranged from hard-engineered protection structures to planning land use (LU) and maintenance activities in coastal areas, namely beach nourishment, under extreme scenarios (IPCC RCP8.5). The results of this projection were showcased to help in decision making. The increasing use of probabilistic models in projecting future SLR scenarios were surveyed in [28], with consideration of the uncertainties associated with the contributing factors to regional and local sea level changes, such as mesoscale ocean processes. However, probabilistic projections also have uncertainties due to their dependence on emission scenarios, which are also uncertain. In [29], it was mentioned that SLR future LU/LC projections were used to evaluate the impacts of storm surges on coastal areas. It was also mentioned that statistical and probabilistic Bayesian Networks were used with SLR projections to study the long-term coastal impacts of SLR. Although the geomorphological and biological impacts of SLR and the exposure of near-shore structures to SLR in their projection scenarios were not considered in [6], the influence of uncertainties associated with climatic and non-climatic events was acknowledged, but it was emphasized that projection scenarios were built to determine the influence of different factors and not project uncertainties, and hence did not consider them. Several regional factors were used in SLR projection and visualization due to their huge influence on SLR. With the inclusion of regional components in projection, these scenarios could amplify the impacts of global factors, which would be reflected in the increase in projected SLR levels [20][30]. In [30], the contributing regional factors alongside the Atlantic Ocean were used to provide comprehensive projections about SLR in the Mediterranean Sea. Figure 2 illustrates a standard framework developed by an IPCC working group [20] that can be applied in building SLR scenarios using a set of contributing factors as identified by IPCC.
Figure 1. Projection of GMSL (in meters) under different RCP scenarios with associated uncertainties (shading) [25].
Figure 2. Methodology for developing SLR scenarios for impact, mitigation and adaptation assessments [20].
Some studies incorporated AI techniques into SLR projection and simulation. In [31], an AI-based visualization of flooding in the province of Quebec, Canada, was used to raise awareness about climate change. Because of the lack of accurate and high-quality flooding data, a simulated environment was created to obtain data, in addition to other real data, to be used in training a custom Generative Adversarial Network (GAN). GAN models use a generator to create data based on real data parameters and then use a discriminator to distinguish between the generated data and the real data [32]. The flooded areas were covered using a painter model to provide a realistic flooding scenario [31]. In [33], an extreme SLR scenario that occurred in the Mediterranean Sea in 350 AD was re-modeled to visualize how it would impact the current Heraklion port in Crete, Greece. Spatial data that contained topographic, bathymetry, and LU data were fed alongside modeled SLR and tsunami wave scenarios into an animation suite to build a 3D visualization tool with a scientific output. Others used historical data to calculate SLR over the years to analyze the trends causing SLR for future projects. Matlab was used in [34] to pre-process and calculate SLR and Mean Sea Level (MSL) trends using linear regression models applied on historical tide gauge data collected from tide stations’ sensors in Indonesia [34]. Error correction was performed in [34] on historical tide gauge data of Hong Kong coasts and used multiple regression models to calculate changes in sea levels. Regression models such as Auto-Regressive Integrated Moving Average (ARIMA) and Vector Auto-Regression (VAR) were also used to forecast changes in both GMSL and RMSL [35][36][37]. A comparative study on the use of historical GMSL data for forecasting using different machine and deep learning algorithms was conducted in [38], where the results showed that deep learning algorithms such as Dense Neural Network (DNN) and WaveNet Convolutional Neural Networks could provide more reliable results than linear regression.

2.2. Coastal Vulnerability Assessment

Part of studying the impacts of SLR on coastal areas is to assess the extent to which they are vulnerable to SLR. The term “vulnerability” is used to define the susceptibility level of coastal areas when being exposed to certain climate hazards [39]. This term also encompasses concepts such as risk, resilience, and adaptability [40]. Different analytical approaches can be used to assess the degree of vulnerability by incorporating elements of different aspects, such as physical, socioeconomic, and ecological aspects. Furthermore, vulnerability assessments are spatially scale-dependent; therefore, the spatial scale of the study area (regional, national, or local) should be taken into consideration. Vulnerability can be defined as “The degree to which a system, sub-system, or component is likely to experience harm due to exposure to a hazard, either a perturbation or stress” [39], with it having the following three components: exposure, sensitivity, and adaptive capacity [39][40]. The exposure (e.g., population density and LU) and sensitivity (e.g., inundation depth) components are used to measure the impact of climate hazards, while the adaptive capacity component (e.g., disaster management and response) is used to identify the ability of socioeconomic factors (e.g., humans, infrastructure, and habitats) to adapt to changes following climate hazards [40]. In [39], indicator-based approaches have been identified as the main coastal vulnerability assessment tools in events related to climate change. Index-based vulnerability assessment methods are a sub-category of indicator-based methods that focus on simplifying the complex interaction among different parameters of various aspects and representing them in a simpler and more understandable format, to help decision-makers plan proper responses. Another sub-category of indicator-based methods is variable-based methods, which focus on studying a set of independent variables related to coastal issues. Many researchers have relied on using index-based approaches to assess coastal vulnerabilities. Index-based approaches include the coastal susceptibility/sensitivity index (CSI), coastal vulnerability index (CVI), coastal risk index (CRI), and socioeconomic vulnerability index (SVI) [41]. CVI is the most popular index-type approach in research that is used to study and assess the coastal vulnerabilities of specific study areas [42]. A standardized and quantitative way of assessing CVI was developed by Gornitz [43]. This approach uses the geometric average (Equation (1)) of different biophysical parameters, including geomorphology, shoreline change rate (i.e., erosion and accretion), coastal slope, regional SLR, mean significant wave height, and mean tidal range [44].
where x represents a parameter and n refers to the total number of parameters used in the CVI assessment.
Gornitz’s CVI assessment approach was widely utilized and adopted by others [44]. Thieler and Hammer-Klose (defined the standard U.S. Geological Survey (USGS) CVI assessment) [45][46] used similar physical parameters to assess both the positive and negative coastal responses to climate-change-driven events [24]. Coastal assessment methods are applicable to regional, national, and local spatial scales, and can provide a detailed assessment of different segments of the shoreline.
Index-based approaches that depend on Gornitz’s method use a variety of physical parameters to assess coastal vulnerability with a variation of the selected variables, according to the nature of the study area. On a national level, Norezan et al. [47] stated that The Department of Irrigation and Drainage in Malaysia used a CVI method in what is called the National Coastal Vulnerability Index Study (NCVI), to assess the vulnerability of coastal areas to SLR and to help policymakers adopt proper adaptation measures. Nevertheless, a CVI study was conducted on Tok Jembal Beach using Thelier and Hammar-Klose ranking scheme, but with three physical variables and climatic-related components. The set of used parameters included geomorphology, coastal slope, regional SLR, temperature, wind speed, and wave’s type. Other CVI-based works included variables from other non-climatic parameters, such as environmental and socioeconomic [48][49]. Mclaughlin et al. [50] believed in the importance of including socioeconomic factors in CVI assessment; thus, they developed a CVI technique (Equation (2)) that incorporated parameters related to climatic components, socioeconomic, and physical parameters.
 
where CC represents the coastal characteristic sub-index associated with physical/biophysical parameters, CF represents the coastal forcing sub-index associated with climatic components, and SE represents the socioeconomic sub-index.
In [51], Cooper’s guidelines [52] were used to conduct a vulnerability of ecosystem habitats, such as mangrove and seagrass beds in some countries in Africa and the Pacific Islands. The assessment involved 19 different parameters, which fell under three categories: exposure, sensitivity, and adaptive capacity. The study found that the regional factors, particularly the continuous tectonic uplift movement, in the study area of Tanzania resulted in a higher resilience to climate change and SLR compared with the other areas involved in the study. Vulnerability assessments were also used to evaluate the economic risk and market shock via the economic vulnerability assessment (EVA) model [53], which was developed by UN and Fedri using different socioeconomic attributes that fell under either exposure (size, specialization, and location) or shocks (trade and natural shocks) [54]. The coastal sensitivity index (CSI) was also used in a number of research works to include ecosystem and oceanographic parameters, in addition to the physical parameters used in the CVI assessments [55].
Generally, the selection of the type and number of indexes will be reflected in the assessment results, and the selected index set can vary according to the specification of the studied areas. Ref. [56] listed some of the criteria that should be considered when choosing an index-based assessment approach, such as the availability of the data associated with the selected index and its robustness to be influenced by other indexes. Furthermore, the number of selected indexes should be sufficient to obtain reliable assessment results [56]. Table 1 shows different types of parameters that were used in research.
Table 1. Comparison of coastal vulnerability assessment (CVI) techniques in the literature.
Paper Year Region Spatial Scale Approach
[45] 1999 US Atlantic coast National CVI (geomorphology, shoreline change rate, coastal slope, regional SLR,
mean significant wave height, and mean tidal range)
[50] 2010 Northern Ireland Local CVI coastal characteristics (resilience and susceptibility) + coastal forcing
+ socioeconomic factors
[57] 2015 Lithuania in the
south-eastern Baltic
Sea
Local CVI are combined with DS (the outcome analytical hierarchical process
(AHP))
[46] 2016 peninsular coastline
of Spain
National CVI (geomorphology, shoreline change rate, coastal slope, regional SLR,
mean significant wave height, and mean tidal range)
[42] 2018 Italy Local CVI with 10 parameters: (1) geologic (geomorphology, coastal slope,
shoreline erosion/accretion, emerged beach width, and dune width), (2)
physical process (regional SLR, mean significant wave height, and mean
tide range), and (3) vegetation (width of vegetation behind the beach and
Posidonia oceanica))
[58] 2018 Hawaiian Islands Local CVI and InVEST model to calculate the exposure index (EI). Parameters:
bathymetry, shoreline geomorphology, regional SLR, wind and wave
actions, LU/LC, and population
[44] 2019 Andhra Pradesh
(CAP) region in India
local CVI (geomorphology, shoreline change rate, coastal slope, regional SLR,
mean significant wave height, and mean tidal range)
[48] 2019 Bangladesh National CVI method of Mclaughlin and Cooper (2010) [50] that consists of three
sub-indices: (1) coastal characteristics vulnerability sub-index; (2) coastal
forcing vulnerability sub-index, and (3) socioeconomic vulnerability
sub-index
[59] 2020 Sultanate of Oman National CVI (coastal geomorphology coastal slope, coastal elevation, tidal range,
and bathymetry)
[47] 2021 Malaysia’s east coast,
Terengganu State
beaches
Local CVI of coastal vulnerabilities using Hammar–Klose and Thieler CVI
rankings
[60] 2021 South India Regional CVI with 10 parameters: geomorphology, shoreline erosion/accretion
rate, coastal slope, regional SLR, mean significant wave height, mean tide
range, storm wave run-up, regional elevation, LU/LC change, and mean
wave height
[40] 2021 South Korea National CVI of 3 main components: exposure (population density and age group
distribution, coastal industrial facilities, and GRDP), sensitivity
(inundated depth and impacted areas), and adaptive capacity (humans,
emergency response and disaster management, relief fund, and public
officials)
[61] 2022 Nigeria National CVI using physical and socioeconomic parameters (geomorphology,
coastal slope, bathymetry, wave height, mean tidal range, shoreline
change rate, regional SLR, population, cultural heritage, LU/LC, and
road network)
[62] 2023 Northern area of the
estuary of Sebou’ in
Morocco
Local CVI with machine learning algorithms (geomorphology, elevation, slope,
shoreline change, natural habitat, SLR, maximum wave height, and tidal
range)

3. Mitigation and Adaptation Measures (MAM)

This section discusses mitigation and adaptation measures (MAM) that can be implemented in response to SLR induced by climate change. Overall, these responses can be categorized into mitigation measures as a proactive response to SLR, and adaptation measures that act as both proactive and reactive responses. These measures include man-made/natural structures and non-structural measures that involve policies and sets of best practices to protect coastal areas and communities. Utilizing both structural and non-structural measures will increase the effectiveness of protection and reduce losses [11].

3.1. Structural Adaptation Measures

Structural mitigation measures are widely implemented across the globe. Various research works have been conducted to study both their long- and short-term effectiveness for protecting coastal areas against SLR [11]. Examples of structural mitigation measures are as follows:
  • Seawall: a protection structure used to protect the coastal landform from the impact of SLR [63].
  • Breakwater: used to protect coastal zone areas and beach material from strong wave actions. It also enables extending the beach area for different human/economic activities. Breakwaters are built either perpendicular or parallel to the beach according to the beach’s nature, to provide maximum protection. The elevation of the breakwater should be determined according to the height of the local maximum tidal wave [63].
  • Seagrass beds: eco-system-based protection measure of high ecological value that adds a means of support to other structural mitigation measures against SLR impacts [11][51][64].
  • Dike: structures built along the coast to protect against high wave actions and flooding [11]
  • Dunes: Piles of sand and/or other materials that are formed due to either natural causes such as wind actions or built constructions (filled with artificial material) to reduce the impact of wave actions and coastal erosion [65].
  • Beach Nourishment: a structural measure that is implemented by filling up the impacted areas with artificial material to protect the coastal areas from the impact of SLR. Beach nourishment is costly and may cause a negative impact on the environment; therefore, it is usually implemented after conducting assessments studies and strategical evaluations of the affected areas [11].
The impact of structural infrastructure at Damietta Promontory, Egypt, in protecting coastal areas against SLR was studied in [66], using satellite images and historical data on changes in the shoreline. It was found that seawalls and detached breakwater bodies have effectively protected the coastline against SLR. However, it was also found that anthropogenic interventions were causing changes to shorelines that were far greater than those caused by SLR. Furthermore, the importance of the maintenance of those structural bodies to maintain the current elevation was also highlighted. Additionally, some recommendations about extending the length of the breaker were provided. Other existing adaptation measures that are being used to protect against high waves and te impact of SLR in the northeastern coast of Egypt were mentioned in [67], particularly the city of Alexandria. This includes the Muhammed Ali Seawall and the international coastal road that was constructed with a high elevation (3 m) by the government. The impact of the type of material used to construct the structural protection measures was also discussed in the literature, as it determines their efficiency in stopping SLR. In [65], unmanned aerial vehicles (UAVs) [68] were used to study the prior and post outcomes of constructing a dune at Cardiff State Beach, California, to protect against flooding and extreme water events. The constructed dune consisted of different materials, including vegetation, sand, cobble, and rip-rap. Although this dune was affected by a storm during the construction process, the post-construction imagery results obtained from UAV during an observation period of 9 months showed that it had, overall, effectively reduced the impact of flooding. In China, a seawall was constructed to protect the coastline of the Tianjin–Hebei District against SLR and extreme weather events that occur once every 100 years; however, it was suggested in [27] that the current elevation of this seawall would not be able to survive against such an extreme event by 2030 based on a presented study of future projections of SLR. This study simulated different SLR scenarios including the existence and absence of extreme weather events of different intensities using the regional ocean modeling system (ROMS) and other data related to that area. Seawalls were built in the coastal areas of Mombasa in Kenya by the tourism sectors to protect against SLR, extreme weather event impacts, and coastal erosion, in addition to maintaining tourism activities [69]. The effectiveness of some of the implemented structural adaptation measures at some of UAE’s vulnerable coastal areas to prevent erosion that resulted from SLR and wave activities were studied in [63]. Detached breakwaters and offshore barriers were found to be better at protecting the coastal areas against coastal erosion compared with seawalls, as they impacted the beach and were degraded over time due to tidal wave actions [63].
Sediment movements due to wave actions during storm surges in the Croatian Krk island in the Adriatic Sea led to the formation of a beach winter profile that acted as a natural protection structure for the coastal areas against erosion. It was found that this naturally formed protection structure acted better in protecting against coastal erosion than the existing landslide protection wall, which was constructed with a low quality and was susceptible to collapse under the impact of continuous intense wave actions [70]. Existing wetlands and lakes near the coastal zone in Alexandria, Egypt were considered as a defense line to hold seawater from propagating further into the land in case of the occurrence of an extreme weather event [67]. In [64], the impact of using different scenarios by combining adaptation measures with natural ecosystems to protect coastal areas was studied. This study relied on using data-based approaches from the literature and qualitative-based approaches carried out via field studies in the area of Mecklenburg, Germany, in the southeast coast of the Baltic Sea by groups of experts. This research found that combining structural adaptation measures with submerged vegetation would result in both positive economic and environmental impacts by adding an appealing look and value to the coastal areas, which could attract both tourists and environmental scientists.

3.2. Non-Structural Adaptation Measures

The negative impact of climate change and SLR on islands can be more severe compared with coastal states [3][53]. For example, SIDS, will be highly impacted by environmental changes and SLR [53]. As per IPCC, economically disadvantaged SIDS countries are highly vulnerable to climate change and SLR impacts [3]; hence, the necessity of implementing proper and effective adaptation measures arises. Conversely, financially well-off members of SIDS like the Kingdom of Bahrain can adopt non-structural adaptation measures in the form of policies and regulations on energy-related sectors to reduce CO2 and GHG emissions [53]. Because of challenges associated with SIDS, it was suggested in [4] that those countries use eco-based adaptation (EbA) measures that “provide a combination of protect and advance benefits based on the sustainable management, conservation, and restoration of ecosystems” [4]. EbA provides protection by deflecting waves and reducing erosion, thus increasing land elevation via sediment buildup, which has proven its effectiveness at mitigating the impact of SLR [4][71]. Reinforcement learning was used in [72] to build a Marcov Decision Process (MDP)-based model to help policymakers evaluate the economic cost of investing in an adaptation infrastructure for SLR. It also provided a proactive measurement by evaluating the cost of implementing a protection infrastructure versus the economic loss as a consequence of the impact of SLR. The model also considered different SLR scenarios according to the NOAA model, the impact of extreme natural events associated with SLR (such as storms and hurricanes), and residents’ and corporations’ willingness to support the government’s decision to implement the SLR adaptation measures. In [73], a national survey was conducted in the USA to measure how local communities perceived different SLR adaptation measures adopted by their local authorities. Fu’s definition of adaptation measures was used to create four categories, as follows: (1) protection, (2) accommodation, (3) managed retreats, and (4) planning. The survey results showed that adaptation measures at coastal localities focused more on planning, which included hazard plans, coastal and emergency management plans, SLR vulnerability assessments, raising public awareness and education, forming an SLR task force, and conducting vulnerability assessments. Nevertheless, planning might provide a false sense of safety, thus the public preferred having protection measures implemented as part of adaptation measures to SLR. A participatory approach that involved different stakeholders was used in [10] to evaluate the impact of implementing different adaptation measures in Portugal’s coasts to protect them from erosion. Adaptation measures were classified into adaption, nourishment, management, relocation, protection, and restoration. The overall benefit-to-cost ratio was in favor of scenarios that involved protection structures and beach nourishment when considering environmental, economic, and social impacts. Adaptation suggestions were provided in [74] to be used alongside the existing structural protection measure in Po River Delta–Italy to reduce the impact of SLR, including farmers switching to crops that would yield higher economic returns. In [5], the adaptation measure in Southeast Asian countries, like Malaysia, were evaluated and the existing flaws were identified, including the unavailability of documentation, the absence of a centralized assessment and strategies platform, the gap between assessment and application, and the emphasis on the importance of socioeconomic components in assessments, which was reflected negatively on the produced set of policies and strategies.
Generally, hard-engineered structures are preferred as protection measures to reduce the impact of SLR, wave actions, and extreme weather events; however, they might result in negative socioeconomic and ecological impacts. The built-in protection structures might limit the usage of coastal areas, which are usually utilized for habitation and touristic activities. This could be even more challenging in cities that are highly dependent on coastal activities and lack the necessary land capacity for relocation, such as SIDS countries [65]. Additionally, some hard structures may reduce the attractiveness of the beach and impact fisheries activities, leading to negative economic impact [63]. A combination of eco-based systems and other structural protection measures can be effective at protecting against the physical impacts of SLR, while maintaining the socioeconomic and ecological value of the coastal areas; however, the researchers found that such scenarios might not be feasible in all regions, due to many local factors like environmental conditions [4], which play a role in determining the effectiveness of implementing such measures. Some ecosystems that protect the shoreline against changes have the ability to adapt to changes in their environment and can cope with SLR up to a certain extent [71]. However, their ability to continue adapting to recent SLR trends and provide the same level of protection to shorelines against changes are questioned. Although stakeholders are aware of the importance of using protection structures for mitigating coastal changes induced by climate change and SLR, they still prefer soft adaptation measures, such as beach nourishment, as they are easier, simpler, and more cost-efficient to implement [10]. Overall, the trade-off between economic cost loss, such as the value of land and properties, and implementation costs drives the decision to implement proper adaptation measures to reduce the risk caused by climatic-driven events [8]. At a local scale, communities are also playing a role in protecting their areas by taking proactive measures and supporting local authorities [4][73]. Table 2 compares different mitigation and adaptation measures covered in the literature over the past 5 years.
Table 2. Comparison of different mitigation and adaptation measures (MAM) in the literature.
MAM Category Type (# Papers) Papers Examples
Structural Hard Structures (6) [10][27][63][66][67][70][74] Breakwaters, seawalls, dikes
Soft Structures (2) [65][70] Dunes, beach nourishment
Eco-Based Structures (4) [4][64][67][71] Seagrass bed, wetlands & reef conversion and
restoration
Non-Structural Policies and Regulations (6) [4][53][72][73][74][75] Relocation, hazard mapping, public awareness

References

  1. Titus, J.G.; Barth, M.C.; Gibbs, M.J.; Hoffman, J.S.; Kenney, M. An Overview of the Causes and Effects of Sea Level Rise; Van Nostrand Reinhold: London, UK, 1984.
  2. Clark, P.U.; Shakun, J.D.; Marcott, S.A.; Mix, A.C.; Eby, M.; Kulp, S.; Levermann, A.; Milne, G.A.; Pfister, P.L.; Santer, B.D. Consequences of twenty-first-century policy for multi-millennial climate and sea-level change. Nat. Clim. Change 2016, 6, 360–369.
  3. IPCC. Climate Change 2022: Impacts, Adaptation, and Vulnerability; IPCC: Geneva, Switzerland, 2022; AR6.
  4. Oppenheimer, M.; Glavovic, B.; Hinkel, J.; van de Wal, R.; Magnan, A.K.; Abd-Elgawad, A.; Cai, R.; Cifuentes Jara, M.; Deconto, R.M.; Ghosh, T. IPCC Special Report on the Ocean and Cryosphere in a Changing Climate; Chapter Sea Level Rise and Implications for Low-Lying Islands, Coasts and Communities; Cambridge University Press: Cambridge, UK; New York, NY, USA, 2019; pp. 321–445.
  5. Noor, N.M.; Abdul Maulud, K.N. Coastal vulnerability: A brief review on integrated assessment in southeast Asia. J. Mar. Sci. Eng. 2022, 10, 595.
  6. Hall, J.A.; Gill, S.; Obeysekera, J.; Sweet, W.; Knuuti, K.; Marburger, J. Regional Sea Level Scenarios for Coastal Risk Management: Managing the Uncertainty of Future Sea Level Change and Extreme Water Levels for Department of Defense Coastal Sites Worldwide; Technical Report; U.S. Department of Defense, Strategic Environmental Research and Development Program: Washington, DC, USA, 2016.
  7. Wright, L.D.; Caruson, K.; D Elia, C.; Draayer, J.; Nichols, R.; Weiss, R.; Zarillo, G. Assessing and Planning for the Impacts of Storms, Flooding and Sea Level Rise on Vulnerable Gulf of Mexico Coastal Communities: A White Paper. In Proceedings of the Global Oceans 2020: Singapore–US Gulf Coast, Biloxi, MI, USA, 5–30 October 2020; IEEE: Piscataway, NJ, USA, 2020; pp. 1–6.
  8. Bosello, F.; De Cian, E. Climate change, sea level rise, and coastal disasters. A review of modeling practices. Energy Econ. 2014, 46, 593–605.
  9. Sweet, W.V.; Hamlington, B.D.; Kopp, R.E.; Weaver, C.P.; Barnard, P.L.; Bekaert, D.; Brooks, W.; Craghan, M.; Dusek, G.; Frederikse, T.; et al. Global and Regional Sea Level Rise Scenarios for the United States: Updated Mean Projections and Extreme Water Level Probabilities Along U.S. Coastlines; Technical Report NOAA Technical Report NOS 01; National Oceanic and Atmospheric Administration, National Ocean Service: Silver Spring, MD, USA, 2022.
  10. Matos, F.A.; Alves, F.; Coelho, C.; Lima, M.; Vizinho, A. Participatory Approach to Build Up a Municipal Strategy for Coastal Erosion Mitigation and Adaptation to Climate Change. J. Mar. Sci. Eng. 2022, 10, 1718.
  11. Dedekorkut-Howes, A.; Torabi, E.; Howes, M. When the tide gets high: A review of adaptive responses to sea level rise and coastal flooding. J. Environ. Plan. Manag. 2020, 63, 2102–2143.
  12. Mcleod, E.; Poulter, B.; Hinkel, J.; Reyes, E.; Salm, R. Sea-level rise impact models and environmental conservation: A review of models and their applications. Ocean. Coast. Manag. 2010, 59, 507–517.
  13. Gesch, D.B. Best practices for elevation-based assessments of sea-level rise and coastal flooding exposure. Front. Earth Sci. 2018, 6, 230.
  14. Tachikawa, T.; Kaku, M.; Iwasaki, A. ASTER GDEM Version 3 Validation Report; Japan Space System: Tokyo, Japan, 2015.
  15. Wandinger, U. Introduction to Lidar. In Lidar: Range-Resolved Optical Remote Sensing of the Atmosphere; Weitkamp, C., Ed.; Springer: New York, NY, USA, 2005; pp. 1–18.
  16. Arthur, R.M.; Garland, G. Predicting the Extent of Inundation due to Sea-Level Rise: Al Hamra Development, Ras Al Khaimah, UAE. A Pilot Project. Misc. Geogr. 2016, 20, 25–31.
  17. Wu, W.; Yang, Z.; Zhang, X.; Zhou, Y.; Tian, B.; Tang, Q. Integrated modeling analysis of estuarine responses to extreme hydrological events and sea-level rise. Estuar. Coast. Shelf Sci. 2021, 261, 107555.
  18. Abdouli, K.A.; Hussein, K.; Ghebreyesus, D.; Sharif, H.O. Coastal runoff in the United Arab Emirates—The hazard and opportunity. Sustainability 2019, 11, 5406.
  19. Warrick, R.A.; Ye, W.; Kouwenhoven, P.; Hay, J.; Cheatham, C. New developments of the SimCLIM model for simulating adaptation to risks arising from climate variability and change. In Proceedings of the International Congress on Modelling and Simulation, Modelling and Simulation Society of Australia and New Zealand, Melbourne, Australia, 12–15 December 2005; pp. 170–176.
  20. Nicholls, R.J.; Hanson, S.E.; Lowe, J.A.; Warrick, R.A.; Lu, X.; Long, A.J.; Carter, T. Constructing Sea-Level Scenarios for Impact and Adaptation Assessment of Coastal Areas: A Guidance Document; Technical Report; Supporting Material, Intergovernmental Panel on Climate Change Task Group on Data and Scenario Support for Impact and Climate Analysis (TGICA): Geneva, Switzerland, 2011.
  21. Fox-Kemper, B.; Adcroft, A.; Boning, C.; Chassignet, E.; Curchitser, E.; Danabasoglu, G.; Eden, C.; England, M.M.; Gerdes, R.; Greatbatch, R.J.; et al. Challenges and Prospects in Ocean Circulation Models. Front. Mar. Sci. 2019, 6, 65.
  22. Chassignet, E.P.; Hurlburt, H.E.; Metzger, E.J.; Smedstad, O.M.; Cummings, J.A.; Halliwell, G.R.; Bleck, R.; Baraille, R.; Wallcraft, A.J.; Lozano, C. US GODAE: Global ocean prediction with the HYbrid Coordinate Ocean Model (HYCOM). Oceanography 2009, 22, 64–75.
  23. Pycroft, J.; Abrell, J.; Ciscar, J.C. The global impacts of extreme sea-level rise: A comprehensive economic assessment. Environ. Resour. Econ. 2016, 64, 225–253.
  24. Koroglu, A.; Ranasinghe, R.; Jimenez, J.A.; Dastgheib, A. Comparison of coastal vulnerability index applications for Barcelona Province. Ocean. Coast. Manag. 2019, 178, 104799.
  25. IPCC. Climate Change 2014: Synthesis Report; IPCC: Geneva, Switzerland, 2014; p. 151.
  26. Zanchettin, D.; Bruni, S.; Raicich, F.; Lionello, P.; Adloff, F.; Androsov, A.; Antonioli, F.; Artale, V.; Carminati, E.; Ferrarin, C. Sea-level rise in Venice: Historic and future trends. Nat. Hazards Earth Syst. Sci. 2021, 21, 2643–2678.
  27. Wang, F.; Li, J.; Shi, P.; Shang, Z.; Li, Y.; Wang, H. The impact of sea-level rise on the coast of Tianjin-Hebei, China. China Geol. 2019, 2, 26–39.
  28. Jevrejeva, S.; Frederikse, T.; Kopp, R.; Le Cozannet, G.; Jackson, L.; Van De Wal, R. Probabilistic sea level projections at the coast by 2100. Surv. Geophys. 2019, 40, 1673–1696.
  29. Passeri, D.L.; Hagen, S.C.; Medeiros, S.C.; Bilskie, M.V.; Alizad, K.; Wang, D. The dynamic effects of sea level rise on low-gradient coastal landscapes: A review. Earth’s Future 2015, 3, 159–181.
  30. Slangen, A.; Adloff, F.; Jevrejeva, S.; Leclercq, P.W.; Marzeion, B.; Wada, Y.; Winkelmann, R. Integrative Study of the Mean Sea Level and Its Components; Chapter A Review of Recent Updates of Sea-Level Projections at Global and Regional Scales; Springer International Publishing: Cham, Switzerland, 2017; pp. 395–416.
  31. Luccioni, A.; Schmidt, V.; Vardanyan, V.; Bengio, Y. Using artificial intelligence to visualize the impacts of climate change. IEEE Comput. Graph. Appl. 2021, 41, 8–14.
  32. Pan, Z.; Yu, W.; Yi, X.; Khan, A.; Yuan, F.; Zheng, Y. Recent progress on generative adversarial networks (GANs): A survey. IEEE Access 2019, 7, 36322–36333.
  33. Giannakidis, A.; Giakoumidakis, G.; Mania, K. 3D photorealistic scientific visualization of tsunami waves and sea level rise. In Proceedings of the 2014 IEEE International Conference on Imaging Systems and Techniques (IST) Proceedings, Santorini, Greece, 14–17 October 2014; IEEE: Piscataway, NJ, USA, 2014; pp. 167–172.
  34. Faridatunnisa, M.; Heliani, L.S. Study of Sea Level Rise Using Tide Gauge Data Year 1996 to 2015 at Semarang and Prigi Stations. In Proceedings of the 2018 4th International Conference on Science and Technology (ICST), Yogyakarta, Indonesia, 18–19 October 2018; IEEE: Piscataway, NJ, USA, 2018; pp. 1–4.
  35. Tabassum, A.; Rabbani, M.; Omar, S.B. An approach to study on time series components and by using them to enumerate the height of sea level alteration for both Global Mean Sea Level(GMSL) and Bay of Bengal(BOB). In Proceedings of the 2019 IEEE International Conference on Electrical, Computer and Communication Technologies (ICECCT), Coimbatore, India, 20–22 February 2019; IEEE: Piscataway, NJ, USA, 2019; pp. 1–7.
  36. Krishnamurthy, V.N.D.; Degadwala, S.; Vyas, D. Forecasting Future Sea Level Rise: A Data-driven Approach using Climate Analysis. In Proceedings of the 2023 2nd International Conference on Edge Computing and Applications (ICECAA), Coimbatore, India, 20–21 March 2023; IEEE: Piscataway, NJ, USA, 2023; pp. 646–651.
  37. Elneel, L.; Zitouni, M.S.; Mukhtar, H.; Al-Ahmad, H. Forecasting Global Mean Sea Level Rise using Autoregressive Models. In Proceedings of the 2023 30th IEEE International Conference on Electronics, Circuits and Systems (ICECS), Istanbul, Turkey, 4–7 December 2023; IEEE: Piscataway, NJ, USA, 2023; pp. 1–4.
  38. Hassan, K.M.A.; Haque, M.A.; Ahmed, S. Comparative Study of Forecasting Global Mean Sea Level Rising using Machine Learning. In Proceedings of the 2021 International Conference on Electronics, Communications and Information Technology (ICECIT), Khulna, Bangladesh, 14–16 September 2021; IEEE: Piscataway, NJ, USA, 2021; pp. 1–4.
  39. Nguyen, T.T.; Bonetti, J.; Rogers, K.; Woodroffe, C.D. Indicator-based assessment of climate-change impacts on coasts: A review of concepts, methodological approaches and vulnerability indices. Ocean. Coast. Manag. 2016, 123, 18–43.
  40. Ku, H.; Kim, T.; Song, Y.i. Coastal vulnerability assessment of sea-level rise associated with typhoon-induced surges in South Korea. Ocean. Coast. Manag. 2021, 213, 105884.
  41. Sarkar, N.; Rizzo, A.; Vandelli, V.; Soldati, M. A Literature Review of Climate-Related Coastal Risks in the Mediterranean, a Climate Change Hotspot. Sustainability 2022, 14, 15994.
  42. Pantusa, D.; D’Alessandro, F.; Riefolo, L.; Principato, F.; Tomasicchio, G.R. Application of a coastal vulnerability index. A case study along the Apulian Coastline, Italy. Water 2018, 10, 1218.
  43. Gornitz, V. Global coastal hazards from future sea level rise. Palaeogeogr. Palaeoclimatol. Palaeoecol. 1991, 89, 379–398.
  44. Kantamaneni, K.; Sudha Rani, N.; Rice, L.; Sur, K.; Thayaparan, M.; Kulatunga, U.; Rege, R.; Yenneti, K.; Campos, L.C. A systematic review of coastal vulnerability assessment studies along Andhra Pradesh, India: A critical evaluation of data gathering, risk levels and mitigation strategies. Water 2019, 11, 393.
  45. Thieler, E.R.; Hammar-Klose, E.S. National Assessment of Coastal Vulnerability to Sea-Level Rise: Preliminary Results for the US Atlantic Coast; Technical Report; US Geological Survey: Asheville, NC, USA, 1999.
  46. Lopez Royo, M.; Ranasinghe, R.; Jimenez, J.A. A rapid, low-cost approach to coastal vulnerability assessment at a national level. J. Coast. Res. 2016, 32, 932–945.
  47. Norezan, N.N.M.; Ma’arof, I.; Sulaiman, S.A. Offshore Vulnerability and Sustainability Assessment Affected by Sea Breakwater Construction using Geomatics Engineering Technology. In Proceedings of the 2021 IEEE 12th Control and System Graduate Research Colloquium, Shah Alam, Malaysia, 7 August 2021; IEEE: Piscataway, NJ, USA, 2021; pp. 104–109.
  48. Mullick, M.R.A.; Tanim, A.; Islam, S.S. Coastal vulnerability analysis of Bangladesh coast using fuzzy logic based geospatial techniques. Ocean. Coast. Manag. 2019, 174, 154–169.
  49. Sudha Rani, N.; Satyanarayana, A.; Bhaskaran, P.K. Coastal vulnerability assessment studies over India: A review. Nat. Hazards 2015, 77, 405–428.
  50. Mclaughlin, S.; Cooper, J.A.G. A multi-scale coastal vulnerability index: A tool for coastal managers? Environ. Hazards 2010, 9, 233–248.
  51. Ellison, J.C. Vulnerability assessment of mangroves to climate change and sea-level rise impacts. Wetl. Ecol. Manag. 2015, 23, 115–137.
  52. Cooper, J.; McLaughlin, S. Contemporary multidisciplinary approaches to coastal classification and environmental risk analysis. J. Coast. Res. 1998, 14, 512–524.
  53. Saleh, A.S.; Altaei, S.; Alkhaldi, F.K. Climate Change Implications on Small Island Developing States (SIDS): A Socioeconomic Perspective from the Kingdom of Bahrain. In Proceedings of the 2021 Third International Sustainability and Resilience Conference: Climate Change, Virtual, 15–17 November 2021; IEEE: Piscataway, NJ, USA, 2021; pp. 39–44.
  54. Feindouno, S.; Goujon, M. The Retrospective Economic Vulnerability Index, 2015 Update; Ferdi Working Paper; Ferdi: New York, NY, USA, 2016.
  55. Al-Awadhi, T.; Mansour, S.; Hereher, M. Assessment of coastal sensitivity to non-eustatic sea level rise: A case study on Muscat coast—Sultanate of Oman. Arab. J. Geosci. 2020, 13, 1–11.
  56. Anfuso, G.; Postacchini, M.; Di Luccio, D.; Benassai, G. Coastal sensitivity/vulnerability characterization and adaptation strategies: A review. J. Mar. Sci. Eng. 2021, 9, 72.
  57. Bagdanaviciute, I.; Kelpaaite, L.; Soomere, T. Multi-criteria evaluation approach to coastal vulnerability index development in micro-tidal low-lying areas. Ocean. Coast. Manag. 2015, 104, 124–135.
  58. Onat, Y.; Marchant, M.; Francis, O.P.; Kim, K. Coastal exposure of the Hawaiian Islands using GIS-based index modeling. Ocean. Coast. Manag. 2018, 163, 113–129.
  59. Hereher, M.; Al-Awadhi, T.; Al-Hatrushi, S.; Charabi, Y.; Mansour, S.; Al-Nasiri, N.; Sherief, Y.; El-Kenawy, A. Assessment of the coastal vulnerability to sea level rise: Sultanate of Oman. Environ. Earth Sci. 2020, 79, 1–12.
  60. Seenipandi, K.; Ramachandran, K.; Chandrasekar, N. Modeling of coastal vulnerability to sea-level rise and shoreline erosion using modified CVI model. In Remote Sensing of Ocean and Coastal Environments; Elsevier: Amsterdam, The Netherlands, 2021; pp. 315–340.
  61. Oloyede, M.O.; Williams, A.B.; Ode, G.O.; Benson, N.U. Coastal Vulnerability Assessment: A Case Study of the Nigerian Coastline. Sustainability 2022, 14, 2097.
  62. Ennouali, Z.; Fannassi, Y.; Lahssini, G.; Benmohammadi, A.; Masria, A. Mapping Coastal vulnerability using machine learning algorithms: A case study at North coastline of Sebou estuary, Morocco. Reg. Stud. Mar. Sci. 2023, 60, 102829.
  63. Subraelu, P.; Ebraheem, A.A.; Sherif, M.; Sefelnasr, A.; Yagoub, M.; Rao, K.N. Land in Water: The Study of Land Reclamation and Artificial Islands Formation in the UAE Coastal Zone: A Remote Sensing and GIS Perspective. Land 2022, 11, 2024.
  64. Schernewski, G.; Voeckler, L.N.; Lambrecht, L.; Robbe, E.; Schumacher, J. Building with Nature—Ecosystem Service Assessment of Coastal-Protection Scenarios. Sustainability 2022, 14, 15737.
  65. Winters, M.A.; Leslie, B.; Sloane, E.B.; Gallien, T.W. Observations and Preliminary Vulnerability Assessment of a Hybrid Dune-Based Living Shoreline. J. Mar. Sci. Eng. 2020, 8, 920.
  66. El-Asmar, H.M.; Taha, M.M. Monitoring Coastal Changes and Assessing Protection Structures at the Damietta Promontory, Nile Delta, Egypt, to Secure Sustainability in the Context of Climate Changes. Sustainability 2022, 14, 15415.
  67. Abou-Mahmoud, M.M.E. Assessing coastal susceptibility to sea-level rise in Alexandria, Egypt. Egypt. J. Aquat. Res. 2021, 47, 133–141.
  68. Fahlstrom, P.G.; Gleason, T.J. Introduction to UAV Systems, 4th ed.; John Wiley and Sons: Hoboken, NJ, USA, 2012; pp. 1–15.
  69. Kebede, A.S.; Nicholls, R.J.; Hanson, S.; Mokrech, M. Impacts of Climate Change and Sea-Level Rise: A Preliminary Case Study of Mombasa, Kenya. J. Coast. Res. 2010, 28, 8–19.
  70. Ruzic, I.; Benac, C.; Jovancevic, S.D.; Radisic, M. The application of UAV for the analysis of geological hazard in Krk Island, Croatia, Mediterranean Sea. Remote Sens. 2021, 13, 1790.
  71. Lincoln, S.; Buckley, P.; Howes, E.L.; Maltby, K.M.; Pinnegar, J.K.; Ali, T.S.; Alosairi, Y.; Al-Ragum, A.; Baglee, A.; Balmes, C.O.; et al. A Regional Review of Marine and Coastal Impacts of Climate Change on the ROPME Sea Area. Sustainability 2021, 13, 13810.
  72. Shuvo, S.S.; Yilmaz, Y.; Bush, A.; Hafen, M. Scenario Planning for Sea Level Rise via Reinforcement Learning. In Proceedings of the 2019 IEEE Global Conference on Signal and Information Processing (GlobalSIP), Ottawa, ON, Canada, 11–14 November 2019; IEEE: Piscataway, NJ, USA, 2019; pp. 1–5.
  73. Fu, X. Measuring local sea-level rise adaptation and adaptive capacity: A national survey in the United States. Cities 2020, 102, 102717.
  74. Da Lio, C.; Tosi, L. Vulnerability to relative sea-level rise in the Po river delta (Italy). Estuar. Coast. Shelf Sci. 2019, 228, 106379.
  75. Ministry of Climate Change and Environment. UAE Climate Risk Assessment and Adaptation Measures in Key Sectors: Health, Energy, Infrastructure and Environment; Technical Report National Climate Change Adaptation Program; Ministry of Climate Change and Environment: Dubai, United Arab Emirates, 2019.
More
Information
Subjects: Others
Contributors MDPI registered users' name will be linked to their SciProfiles pages. To register with us, please refer to https://encyclopedia.pub/register : , , , ,
View Times: 102
Revisions: 5 times (View History)
Update Date: 07 Mar 2024
1000/1000