Your browser does not fully support modern features. Please upgrade for a smoother experience.
Submitted Successfully!
 +1 credit
Thank you for your contribution! You can also upload a video entry or images related to this topic.
For video creation, please contact our Academic Video Service.
| Version | Summary | Created by | Modification | Content Size | Created at | Operation |
|---|---|---|---|---|---|---|
| 1 | Christine Fernandez-Maloigne | -- | 2084 | 2024-01-18 09:28:24 | | | |
| 2 | Lindsay Dong | + 35 word(s) | 2119 | 2024-01-19 03:41:39 | | | | |
| 3 | Lindsay Dong | Meta information modification | 2119 | 2024-01-31 06:15:00 | | |
Video Upload Options
We provide professional Academic Video Service to translate complex research into visually appealing presentations. Would you like to try it?
Cite
If you have any further questions, please contact Encyclopedia Editorial Office.
Guillevin, R.; Naudin, M.; Fayolle, P.; Giraud, C.; Le Guillou, X.; Thomas, C.; Herpe, G.; Miranville, A.; Guillevin, C.; Pellerin, L.; et al. Diagnostic and Therapeutic Issues in Glioma Imaging. Encyclopedia. Available online: https://encyclopedia.pub/entry/54019 (accessed on 25 June 2026).
Guillevin R, Naudin M, Fayolle P, Giraud C, Le Guillou X, Thomas C, et al. Diagnostic and Therapeutic Issues in Glioma Imaging. Encyclopedia. Available at: https://encyclopedia.pub/entry/54019. Accessed June 25, 2026.
Guillevin, Rémy, Mathieu Naudin, Pierre Fayolle, Clément Giraud, Xavier Le Guillou, Clément Thomas, Guillaume Herpe, Alain Miranville, Carole Guillevin, Luc Pellerin, et al. "Diagnostic and Therapeutic Issues in Glioma Imaging" Encyclopedia, https://encyclopedia.pub/entry/54019 (accessed June 25, 2026).
Guillevin, R., Naudin, M., Fayolle, P., Giraud, C., Le Guillou, X., Thomas, C., Herpe, G., Miranville, A., Guillevin, C., Pellerin, L., & Fernandez-Maloigne, C. (2024, January 18). Diagnostic and Therapeutic Issues in Glioma Imaging. In Encyclopedia. https://encyclopedia.pub/entry/54019
Guillevin, Rémy, et al. "Diagnostic and Therapeutic Issues in Glioma Imaging." Encyclopedia. Web. 18 January, 2024.
Copy Citation
Glial tumors represent the leading etiology of primary brain tumors. Their particularities lie in (i) their location in a highly functional organ that is difficult to access surgically, including for biopsy, and (ii) their rapid, anisotropic mode of extension, notably via the fiber bundles of the white matter, which further limits the possibilities of resection. The use of mathematical tools enables the development of numerical models representative of the oncotype, genotype, evolution, and therapeutic response of lesions.
numerical twin
virtual biopsy
connectome
metabolic MRI
functional MRI
1. Introduction
Glial tumors, as the first etiology of primary brain tumors, are challenging both to diagnose and to treat. Yet their physical biopsy is limitative, at best partial, and sometimes impossible, due to the location of the tumor and the vulnerability of the brain. In addition, imaging, namely MRI, is the only way to assess their extensions. A standard MRI scan provides a limited morphologic aspect of a tumoral process within the brain, revealing basic information including topography, size, mass effect, extension and post-contrast increased signal, and non-quantitative parameters [1]. The rise of fluctuations of the blood oxygenation level dependent (BOLD) signal across different regions in the brain [2] has introduced a new functional dimension to brain imaging. Indeed, functional magnetic resonance imaging (fMRI) has become a widely-used tool for the investigation of cognitive processes in the human brain. It provides a new platform to explore the overall structure of local and global functional connectivity by measuring the level of resting state simultaneous activation between brain regions to detect the brain’s connectome [3][4]. This “virtual brain” also requires powerful mathematical tools such as the graph theory. Using this tool, the brain is viewed as a collection of nodes that are connected via edges [5]. The development of the connectome, or ‘wiring diagram’ of the brain, offers the potential to answer questions related to connectivity [6][7][8][9]. Then, after removing part of the network during a surgical intervention, connection re-wiring (based on brain plasticity) can be studied and predicted in silico.
2. Choosing the Parameters
From year to year, new MR sequences are proposed by research teams using different methodological procedures, thus gathering information related to pathophysiological issues [10]. The choice of each parameter must be (i) consistent with the question to be addressed, (ii) accessible with reliable, reproducible quantitative measurements, (iii) within a reasonable acquisition time for the patient, (iv) integrable into a model, and (v) not redundant with other information. In addition, key genetic and molecular pathway information needs to be captured with enough spatial resolution, as provided by high- and ultra-high field MR scanners, in the shortest acquisition time possible [11][12].
Once acquired, the set of parameters should be post-processed and integrated into the pipeline to be delivered as quickly as possible to the medical staff. As a consequence, the team in charge of processing this type of information should not be made up of radiologists only, but should include all the following skills: NMR methodology, metrology, signal analysis and treatment, computer science, mathematics and theoretical biology (TB) for integration into the models (Figure 1).
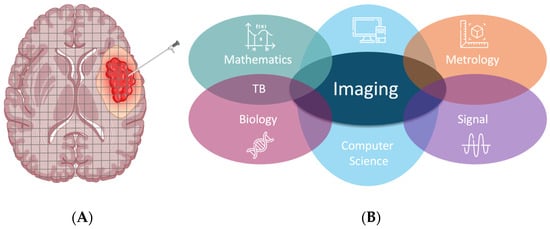
Figure 1. (A) schematic comparison between physical (needle) biopsy: focal and partial and virtual, global biopsy (grid superimposed in successive slices). (B) Different fields of knowledge required in a team for achieving numerical twinning for an organ in the course of its pathological process.
If metabolic information is to be mutually consistent, the parameters for morphological analysis must be kept to a minimum. Another challenge lies in the methods of extraction, quantification, and reproducibility of the parameters chosen. Quantitative imaging can provide reliable T1 and T2 values to achieve this goal [13].
By providing anatomical and structural information about neoplasms and surrounding parenchyma, clinically-available MRI sequences enable diagnosis and grading of gliomas. Sequences such as diffusion-weighted imaging (DWI), diffusion tensor imaging (DTI), perfusion-weighted imaging (PWI), and proton MR spectroscopy (1H-MRS) are currently the benchmarks for the detection and assessment of a brain tumor’s oncotype. These practices combine different classifiers and machine learning [14][15]. However, the assessment of brain tumor patients, including complete extension assessment, monitoring early responses to therapy, and predicting the outcome, remains challenging [16].
The emergence and conceptualization of the central role of lactate, not only as an escape metabolite from the Krebs cycle, but also as an energy substrate for tumor cell growth via the intratumoral lactate shuttle [17], has made it possible to use its detection and quantification (easily achieved with proton spectroscopy) to model and predict the behavior of a glioma. Thus, the detection of lactate resonance during WHO II glioma monitoring predicts (i) an increase in Ki-67 above 4% [18] and (ii) the appearance of a perfusion increment above 1.75 (rCBVmax) [19], this increment in turn being predictive of OS shortening.
3. Automatic Analysis of Tumoral Heterogeneity: The Challenge of Segmentation
All the previously mentioned genetic-metabolic information can be identified by (semi) automatic spectra analysis and should then be integrated into an AI process.
An MR-spectroscopy-based algorithm for in-depth characterization of brain lesions and prediction of a lesion’s molecular traits has been developed. Dimensional reductions of metabolic profiles demonstrated distinct patterns throughout pathologies. With a combination of a deep autoencoder and multi-layer linear discriminant models for voxel-wise prediction of the molecular profile based on MRS imaging, Diamandis et al. found specific metabolite patterns in different spatial regions [20]. Yet, choline and lactate resonance allow flagging of a contrast enhanced tumor, thus allowing metabolic prediction classification of molecular subgroups of tumors. The fingerprinting schedule consists in (i) acquisition of a sub-sampled image set and library generation via sequence parameters; (ii) comparison of the library and the signal for each voxel assignment to a tissue class (iii) creation of the resulting maps for enhanced image analysis [21].
Other spatial segmentation methods for brain tumors have been developed using innovative mathematical tools. There is a morphological approach based on T2Flair volume acquisitions, using (i) a proliferation-diffusion equation δ(c)/δ(t) = ρ·c + ∇·(D ∇·c) [22], (ii) a diffusion tensor sequence, (iii) segmentation with extraction of the equivalent diameter of the spheroid to obtain the equivalent diameter, which is predictive of progression-free survival [23][24][25]. However, this method, while simple to implement, requires at least one year to provide significant information, and should be used in complementarity with the previously-discussed metabolic method.
A more complex method, using a Cahn–Hilliard type equation (4th order PDE in space), integrates parametric information from MRI while, takeing into account spatial diffusion, phase separation, and aggregation phenomena (low or high cell concentrations in different parts of the tumor), thus restoring tissue heterogeneity and its temporal growth component (anisotropy) [26].
This method can be implemented in an in silico model supplied with in vivo metabolic data collected during the patient’s MR examination.
4. Oncometabolic Representation: Dynamic Representation of Tumor Behavior
After appropriate segmentation of the tumoral process, a dynamic estimation of key metabolites has to be performed for therapeutic monitoring and outcome prediction. An approach to estimate glioma lactate kinetics has been proposed by Perrillat et al. [27]. The two variables of the system display distinct time evolutions. Thus, the system can be studied using asymptotic and geometric analysis of slow-fast systems (Figure 2).
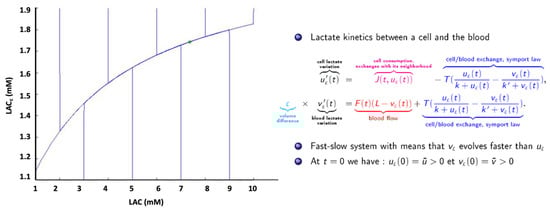
Figure 2. Fast-slow system. Rapid variations of [Lac] (vertical lines) around a medium value (green cross) on asymptotic trajectory, in accordance with in vivo spectroscopic quantifications.
The model has an associated viability domain, and generic orbits are almost parallel to the Y (LACc) axis. The generic orbits then remain in the neighborhood of the slow curve while tending toward the stationary point. As a consequence, generic orbits do not leave the viability domain. Beyond the mathematical presentation, this point means that metabolic concentrations can be analyzed in vivo using MR examination despite MR’s weak temporal resolution.
This approach can be extended to the various metabolites involved in tumor dynamics (e.g., glutamate) that are measurable with MRI [28][29]. Thus, by extension, the tumor is represented by a set of metabolites defining a global viability domain. When confronted with imaging data from NMR spectroscopy and perfusion, the model provides results confirming in silico simulations [27]. Then, the glioma’s process and evolution can be represented by its metabolic concentration trajectories in addition to standard imaging (Figure 3).
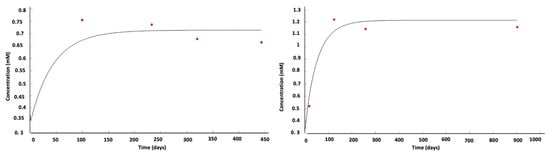
Figure 3. Two examples of the evolution of local lactate concentration (red dots: patient data; black curve: model simulation) in a WHO IV glioma [27]. In vivo measurements fit in silico predictions.
5. Other Genetic-Metabolic Issues
Analysis of the distribution of gray levels within an MRI image enables us to obtain the texture features of intra-lesional heterogeneity [30][31] which is called a Texture Analysis (TA). Based on the general assumption that a tumor’s heterogeneity should constitute a biomarker of its aggressivity, as it is correlated to the WHO grade [32], quantification of its histogram (with and without filtration) is based on the parameter standard deviation (SD), which represents the width of the histogram or degree of variation from the mean pixel value (equation shown below):
This type of analysis can be used on different MR sequences or CT slices. However, the texture caused by necrosis, which may be important to detect during LGG transformation, may be extracted via ADC textural analysis. TA of T1 post-contrast may provide accurate quantitation of intra-lesional heterogeneity.
The fractal dimension (FD) is a non-integer number that characterizes the morphometric variability of a complex and irregular shape [33]. Two quantitative parameters can be automatically computed and correlated with each histopathological type of tumor: the volume fraction of SWI signals within tumors (signal ratio) and the morphological self-similar features (fractal dimension [FD]).
6. Building Connectomes
6.1. Metabolic Connectome
Considering the above statements assessing the interdependency of multiple metabolites involved in the tumor growth process, several authors have built simulations of the impact of one variation (glucose consumption to produce lactate) on global metabolism using multiple sampling bootstrap scheme assembled metabolic brain networks with optimal parameters setup [34][35][36].
It is therefore possible today to produce an in silico representation of a global biological model of a glioma, based on parameters derived from MRI. The consequences of the dynamic modifications of one metabolite upon the others can be simulated.
6.2. Functional Connectome
Neurooncosurgery faces two major constraints that could be in opposition. It should be both as complete as possible and respectful of functional anatomy. So-called functional brain mapping has hugely increased using both pre-operative electrophysiology and MR-based BOLD acquisitions. By integrating a network-based model and localization with neuroanatomy, the brain’s connectivity is considered in a global way, i.e., holistically. Based on the graph theory, the brain is considered as a collection of nodes that are connected via edges [5][37]. The connectome analysis has revealed the brain organization—where nodes are circumscribed brain regions and edges the degree of synchronization of endogenous signals expected recovery [37]. Glioma-induced alterations of the connectome [36], including Resting State Network reorganization [38] and non-linear registration of structural data [39], may be quantified.
7. Therapeutic Simulation: Chemotherapy Modulation
Mathematical modeling can be adapted to describe the effects of resection [40][41], chemotherapy [42][43][44], radiotherapy [45][46], or immunotherapy. Therefore it can help to plan anticancer therapy [47].
Lactate has been established as a fuel for glioma growth. Therefore, monitoring its concentration values obtained by 1H Magnetic Resonance Spectroscopy and integrating those values into a realistic mathematical model within slow-fast systems may be useful.
8. Outcome Prediction
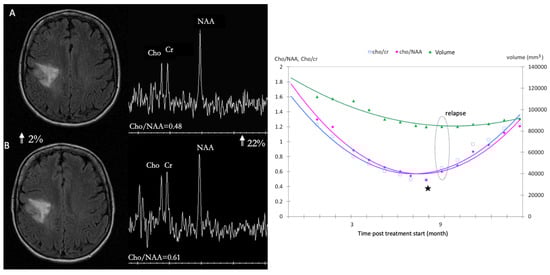
Radiomics allows the conversion of imaging data into a high dimensional feature space using an automated data mining algorithm [48][49][50], thus overcoming single parameter analysis in patients with glioblastomas. It assesses the spatial heterogeneity of brain tumors, using clinically feasible and commonly performed T1-weighted, T2-weighted, and fluid-attenuated inversion recovery (FLAIR) MRI. They can improve the estimation of prognoses [51] and the determination of treatment response to anti-angiogenic therapy. Both perfusion WI and 1H-MRS have emerged as potential prognostic factors for the outcomes of glioma patients under chemotherapy. For high grade gliomas under bevacizumab, both dsc and dce markers are relevant [48][49][51][52]. For LGG under TMZ [53], the mean relative decrease of metabolic ratios, mean (D(Cho/Cr)n/(Cho/Cr)o), at n = 3 months is predictive of tumor response over the 14 months of follow-up (Figure 4). The mean relative change between metabolic ratios, mean ((Cho/NAA)n(Cho/Cr)n)/(Cho/NAA)n, at n = 4 months is predictive of tumor relapse with a significant cutoff of 0.046, a sensitivity of 60% and a specificity of 100% (p = 0.004), Figure 4.
Figure 4. Comparison between dynamics fluctuations of metabolites ratios and volumetric measurements on LGG under TMZ treatment: stronger variations within a short time delay allowing better monitoring. (A) axial image FLAIR of low-grade glioma at 8 months (inflexion point ★) with associated spectrum showing a ratio Cho/NAA at 0.48, (B) axial image FLAIR of low-grade glioma at 9 month (circle represent the relapse) and the spectrum with a ratio Cho/NAA at 0.61.
References
- Di Ieva, A.; Magnussen, J.S.; McIntosh, J.; Mulcahy, M.J.; Pardey, M.; Choi, C. Magnetic Resonance Spectroscopic Assessment of Isocitrate Dehydrogenase Status in Gliomas: The New Frontiers of Spectrobiopsy in Neurodiagnostics. World Neurosurg. 2020, 133, e421–e427.
- Biswal, B.; Yetkin, F.Z.; Haughton, V.M.; Hyde, J.S. Functional Connectivity in the Motor Cortex of Resting Human Brain Using Echo-Planar MRI. Magn. Reson. Med. 1995, 34, 537–541.
- Baxter, D.A.; Byrne, J.H. Simulator for Neural Networks and Action Potentials. Methods Mol. Biol. 2007, 401, 127–154.
- Schilling, K.G.; Tax, C.M.W.; Rheault, F.; Landman, B.A.; Anderson, A.W.; Descoteaux, M.; Petit, L. Prevalence of White Matter Pathways Coming into a Single White Matter Voxel Orientation: The Bottleneck Issue in Tractography. Hum. Brain Mapp. 2022, 43, 1196–1213.
- Hart, M.G.; Ypma, R.J.F.; Romero-Garcia, R.; Price, S.J.; Suckling, J. Graph Theory Analysis of Complex Brain Networks: New Concepts in Brain Mapping Applied to Neurosurgery. J. Neurosurg. 2016, 124, 1665–1678.
- Fornito, A.; Zalesky, A.; Breakspear, M. Graph Analysis of the Human Connectome: Promise, Progress, and Pitfalls. NeuroImage 2013, 80, 426–444.
- Smith, S.M.; Beckmann, C.F.; Andersson, J.; Auerbach, E.J.; Bijsterbosch, J.; Douaud, G.; Duff, E.; Feinberg, D.A.; Griffanti, L.; Harms, M.P.; et al. Resting-State fMRI in the Human Connectome Project. NeuroImage 2013, 80, 144–168.
- Sporns, O.; Tononi, G.; Kötter, R. The Human Connectome: A Structural Description of the Human Brain. PLoS Comput. Biol. 2005, 1, e42.
- Discovering the Human Connectome—Sporns, Olaf: 9780262017909—AbeBooks. Available online: https://www.abebooks.fr/9780262017909/Discovering-Human-Connectome-Sporns-Olaf-0262017903/plp (accessed on 3 November 2023).
- Cho, N.S.; Sanvito, F.; Thakuria, S.; Wang, C.; Hagiwara, A.; Nagaraj, R.; Oshima, S.; Lopez Kolkovsky, A.L.; Lu, J.; Raymond, C.; et al. Multi-Nuclear Sodium, Diffusion, and Perfusion MRI in Human Gliomas. J. Neurooncol. 2023, 163, 417–427.
- Shaffer, A.; Kwok, S.S.; Naik, A.; Anderson, A.T.; Lam, F.; Wszalek, T.; Arnold, P.M.; Hassaneen, W. Ultra-High-Field MRI in the Diagnosis and Management of Gliomas: A Systematic Review. Front. Neurol. 2022, 13, 857825.
- Zaiss, M.; Windschuh, J.; Paech, D.; Meissner, J.-E.; Burth, S.; Schmitt, B.; Kickingereder, P.; Wiestler, B.; Wick, W.; Bendszus, M.; et al. Relaxation-Compensated CEST-MRI of the Human Brain at 7T: Unbiased Insight into NOE and Amide Signal Changes in Human Glioblastoma. NeuroImage 2015, 112, 180–188.
- Blystad, I.; Warntjes, J.B.M.; Smedby, Ö.; Lundberg, P.; Larsson, E.-M.; Tisell, A. Quantitative MRI Using Relaxometry in Malignant Gliomas Detects Contrast Enhancement in Peritumoral Oedema. Sci. Rep. 2020, 10, 17986.
- Vallée, R.; Vallée, J.-N.; Guillevin, C.; Lallouette, A.; Thomas, C.; Rittano, G.; Wager, M.; Guillevin, R.; Vallée, A. Machine Learning Decision Tree Models for Multiclass Classification of Common Malignant Brain Tumors Using Perfusion and Spectroscopy MRI Data. Front. Oncol. 2023, 13, 1089998.
- Vallée, A.; Guillevin, C.; Wager, M.; Delwail, V.; Guillevin, R.; Vallée, J.-N. Added Value of Spectroscopy to Perfusion MRI in the Differential Diagnostic Performance of Common Malignant Brain Tumors. Am. J. Neuroradiol. 2018, 39, 1423–1431.
- McKnight, T.R. Proton Magnetic Resonance Spectroscopic Evaluation of Brain Tumor Metabolism. Semin. Oncol. 2004, 31, 605–617.
- Pérez-Escuredo, J.; Van Hée, V.F.; Sboarina, M.; Falces, J.; Payen, V.L.; Pellerin, L.; Sonveaux, P. Monocarboxylate Transporters in the Brain and in Cancer. Biochim. Biophys. Acta 2016, 1863, 2481–2497.
- Guillevin, R.; Menuel, C.; Duffau, H.; Kujas, M.; Capelle, L.; Aubert, A.; Taillibert, S.; Idbaih, A.; Pallud, J.; Demarco, G.; et al. Proton Magnetic Resonance Spectroscopy Predicts Proliferative Activity in Diffuse Low-Grade Gliomas. J. Neurooncol. 2008, 87, 181–187.
- Guillevin, R.; Menuel, C.; Abud, L.; Costalat, R.; Capelle, L.; Hoang-Xuan, K.; Habas, C.; Chiras, J.; Vallee, J.N. Proton MR Spectroscopy in Predicting the Increase of Perfusion MR Imaging for WHO Grade II Gliomas. J. Magn. Reson. Imaging 2012, 35, 543–550.
- Diamandis, E.; Gabriel, C.P.S.; Würtemberger, U.; Guggenberger, K.; Urbach, H.; Staszewski, O.; Lassmann, S.; Schnell, O.; Grauvogel, J.; Mader, I.; et al. MR-Spectroscopic Imaging of Glial Tumors in the Spotlight of the 2016 WHO Classification. J. Neurooncol. 2018, 139, 431–440.
- Ropella-Panagis, K.M.; Seiberlich, N.; Gulani, V. Magnetic Resonance Fingerprinting: Implications and Opportunities for PET/MR. IEEE Trans. Radiat. Plasma Med. Sci. 2019, 3, 388–399.
- Tracqui, P.; Cruywagen, G.C.; Woodward, D.E.; Bartoo, G.T.; Murray, J.D.; Alvord, E.C., Jr. A Mathematical Model of Glioma Growth: The Effect of Chemotherapy on Spatio-Temporal Growth. Cell Prolif. 1995, 28, 17–31.
- Duffau, H. The Anatomo-Functional Connectivity of Language Revisited. New Insights Provided by Electrostimulation and Tractography. Neuropsychologia 2008, 46, 927–934.
- Mandonnet, E.; Delattre, J.Y.; Tanguy, M.L.; Swanson, K.R.; Carpentier, A.F.; Duffau, H.; Cornu, P.; Van Effenterre, R.; Alvord, E.C., Jr.; Capelle, L. Continuous Growth of Mean Tumor Diameter in a Subset of Grade II Gliomas. Ann. Neurol. 2003, 53, 524–528.
- Mandonnet, E.; Pallud, J.; Clatz, O.; Taillandier, L.; Konukoglu, E.; Duffau, H.; Capelle, L. Computational Modeling of the WHO Grade II Glioma Dynamics: Principles and Applications to Management Paradigm. Neurosurg. Rev. 2008, 31, 263–269.
- Li, L. On a Cahn–Hilliard–Oono Model for Image Segmentation. Asymptot. Anal. 2023, 132, 519–548.
- Perrillat-Mercerot, A.; Miranville, A.; Agosti, A.; Rocca, E.; Ciarletta, P.; Guillevin, R. Partial Differential Model of Lactate Neuro-Energetics: Analytic Results and Numerical Simulations. Math. Med. Biol. 2021, 38, 178–201.
- Perrillat-Mercerot, A.; Bourmeyster, N.; Guillevin, C.; Miranville, A.; Guillevin, R. Analysis of a Mathematical Model for the Glutamate/Glutamine Cycle in the Brain. Bull. Math. Biol. 2019, 81, 4251–4270.
- Perrillat-Mercerot, A.; Guillevin, C.; Miranville, A.; Guillevin, R. Using Mathematics in MRI Data Management for Glioma Assesment. J. Neuroradiol. 2021, 48, 282–290.
- Davnall, F.; Yip, C.S.P.; Ljungqvist, G.; Selmi, M.; Ng, F.; Sanghera, B.; Ganeshan, B.; Miles, K.A.; Cook, G.J.; Goh, V. Assessment of Tumor Heterogeneity: An Emerging Imaging Tool for Clinical Practice? Insights Imaging 2012, 3, 573–589.
- Miles, K.A.; Ganeshan, B.; Hayball, M.P. CT Texture Analysis Using the Filtration-Histogram Method: What Do the Measurements Mean? Cancer Imaging 2013, 13, 400–406.
- Helseth, R.; Helseth, E.; Johannesen, T.B.; Langberg, C.W.; Lote, K.; Rønning, P.; Scheie, D.; Vik, A.; Meling, T.R. Overall Survival, Prognostic Factors, and Repeated Surgery in a Consecutive Series of 516 Patients with Glioblastoma Multiforme. Acta Neurol. Scand. 2010, 122, 159–167.
- Jiménez, J.; López, A.M.; Cruz, J.; Esteban, F.J.; Navas, J.; Villoslada, P.; Ruiz de Miras, J. A Web Platform for the Interactive Visualization and Analysis of the 3D Fractal Dimension of MRI Data. J. Biomed. Inform. 2014, 51, 176–190.
- Huang, S.-Y.; Hsu, J.-L.; Lin, K.-J.; Liu, H.-L.; Wey, S.-P.; Hsiao, I.-T. Alzheimer’s Disease Neuroimaging Initiative Characteristic Patterns of Inter- and Intra-Hemispheric Metabolic Connectivity in Patients with Stable and Progressive Mild Cognitive Impairment and Alzheimer’s Disease. Sci. Rep. 2018, 8, 13807.
- Perrillat-Mercerot, A.; Deliot, N.; Miranville, A.; Guillevin, R.; Constantin, B. Mathematical Analysis of Membrane Transporters Dynamics: A Calcium Fluxes Case Study. Acta Biotheor. 2022, 70, 14.
- Schu, G.; Brum, W.S.; Rodrigues, Y.E.; de Azeredo, J.C.; Pascoal, T.A.; Benedet, A.L.; Mathotaarachchi, S.; Rosa-Neto, P.; Almeida, J.; Zimmer, E.R.; et al. Stable Brain PET Metabolic Networks Using a Multiple Sampling Scheme. bioRxiv 2021.
- Hart, M.G.; Price, S.J.; Suckling, J. Connectome Analysis for Pre-Operative Brain Mapping in Neurosurgery. Br. J. Neurosurg. 2016, 30, 506–517.
- Lv, K.; Cao, X.; Wang, R.; Du, P.; Fu, J.; Geng, D.; Zhang, J. Neuroplasticity of Glioma Patients: Brain Structure and Topological Network. Front. Neurol. 2022, 13, 871613.
- Chen, H.S.-M.; Kumar, V.A.; Johnson, J.M.; Chen, M.M.; Noll, K.R.; Hou, P.; Prabhu, S.S.; Schomer, D.F.; Liu, H.-L. Effect of Brain Normalization Methods on the Construction of Functional Connectomes from Resting-State Functional MRI in Patients with Gliomas. Magn. Reson. Med. 2021, 86, 487–498.
- Swanson, K.R.; Bridge, C.; Murray, J.D.; Alvord, E.C. Virtual and Real Brain Tumors: Using Mathematical Modeling to Quantify Glioma Growth and Invasion. J. Neurol. Sci. 2003, 216, 1–10.
- Swanson, K.R.; Rockne, R.C.; Claridge, J.; Chaplain, M.A.; Alvord, E.C., Jr.; Anderson, A.R.A. Quantifying the Role of Angiogenesis in Malignant Progression of Gliomas: In Silico Modeling Integrates Imaging and Histology. Cancer Res. 2011, 71, 7366–7375.
- Konukoglu, E.; Clatz, O.; Menze, B.H.; Stieltjes, B.; Weber, M.-A.; Mandonnet, E.; Delingette, H.; Ayache, N. Image Guided Personalization of Reaction-Diffusion Type Tumor Growth Models Using Modified Anisotropic Eikonal Equations. IEEE Trans. Med. Imaging 2010, 29, 77–95.
- Liu, Y.; Sadowski, S.M.; Weisbrod, A.B.; Kebebew, E.; Summers, R.M.; Yao, J. Patient Specific Tumor Growth Prediction Using Multimodal Images. Med. Image Anal. 2014, 18, 555–566.
- Mandonnet, E. Biomathematical Modeling of DLGG. In Diffuse Low-Grade Gliomas in Adults; Duffau, H., Ed.; Springer International Publishing: Cham, Switzerland, 2017; pp. 651–664. ISBN 978-3-319-55466-2.
- Lagaert, J.-B. Modélisation de la Croissance Tumorale: Estimation de Paramètres d’un Modèle de Croissance et Introduction d’un Modèle Spécifique Aux Gliomes de Tout Grade. Ph.D. Thesis, Université Sciences et Technologies-Bordeaux I, Talence, France, 2011.
- Saut, O.; Lagaert, J.-B.; Colin, T.; Fathallah-Shaykh, H.M. A Multilayer Grow-or-Go Model for GBM: Effects of Invasive Cells and Anti-Angiogenesis on Growth. Bull. Math. Biol. 2014, 76, 2306–2333.
- Sherer, E.; Hannemann, R.E.; Rundell, A.; Ramkrishna, D. Analysis of Resonance Chemotherapy in Leukemia Treatment via Multi-Staged Population Balance Models. J. Theor. Biol. 2006, 240, 648–661.
- Chang, K.; Bai, H.X.; Zhou, H.; Su, C.; Bi, W.L.; Agbodza, E.; Kavouridis, V.K.; Senders, J.T.; Boaro, A.; Beers, A.; et al. Residual Convolutional Neural Network for the Determination of IDH Status in Low- and High-Grade Gliomas from MR Imaging. Clin. Cancer Res. 2018, 24, 1073–1081.
- Chang, P.; Grinband, J.; Weinberg, B.D.; Bardis, M.; Khy, M.; Cadena, G.; Su, M.-Y.; Cha, S.; Filippi, C.G.; Bota, D.; et al. Deep-Learning Convolutional Neural Networks Accurately Classify Genetic Mutations in Gliomas. Am. J. Neuroradiol. 2018, 39, 1201–1207.
- Choi, Y.S.; Bae, S.; Chang, J.H.; Kang, S.-G.; Kim, S.H.; Kim, J.; Rim, T.H.; Choi, S.H.; Jain, R.; Lee, S.-K. Fully Automated Hybrid Approach to Predict the IDH Mutation Status of Gliomas via Deep Learning and Radiomics. Neuro-Oncology 2021, 23, 304–313.
- Zhang, B.; Chang, K.; Ramkissoon, S.; Tanguturi, S.; Bi, W.L.; Reardon, D.A.; Ligon, K.L.; Alexander, B.M.; Wen, P.Y.; Huang, R.Y. Multimodal MRI Features Predict Isocitrate Dehydrogenase Genotype in High-Grade Gliomas. Neuro-Oncology 2017, 19, 109–117.
- Patel, S.H.; Bansal, A.G.; Young, E.B.; Batchala, P.P.; Patrie, J.T.; Lopes, M.B.; Jain, R.; Fadul, C.E.; Schiff, D. Extent of Surgical Resection in Lower-Grade Gliomas: Differential Impact Based on Molecular Subtype. Am. J. Neuroradiol. 2019, 40, 1149–1155.
- Guillevin, R.; Menuel, C.; Taillibert, S.; Capelle, L.; Costalat, R.; Abud, L.; Habas, C.; De Marco, G.; Hoang-Xuan, K.; Chiras, J.; et al. Predicting the Outcome of Grade II Glioma Treated with Temozolomide Using Proton Magnetic Resonance Spectroscopy. Br. J. Cancer 2011, 104, 1854–1861.
More
Information
Subjects:
Computer Science, Interdisciplinary Applications; Radiology, Nuclear Medicine & Medical Imaging
Contributors
MDPI registered users' name will be linked to their SciProfiles pages. To register with us, please refer to https://encyclopedia.pub/register
:
View Times:
600
Revisions:
3 times
(View History)
Update Date:
31 Jan 2024
Table of Contents


Notice
You are not a member of the advisory board for this topic. If you want to update advisory board member profile, please contact office@encyclopedia.pub.
OK
Confirm
Only members of the Encyclopedia advisory board for this topic are allowed to note entries. Would you like to become an advisory board member of the Encyclopedia?
Yes
No
${ textCharacter }/${ maxCharacter }
Submit
Cancel
Back
Comments
${ item }
|
${ item.createdUser.fullName }
${ item.createdAt }
${ item.vote }
${ item.reply }
Delete
${ reply.createdUser.fullName }
${ reply.createdAt }
${ reply.vote }
Delete
There is no reply to this comment~
${ item.replyTextCharacter }/${ item.replyMaxCharacter }
Submit
Cancel
More
No more~
There is no comment~
${ textCharacter }/${ maxCharacter }
Submit
Cancel
${ selectedItem.replyTextCharacter }/${ selectedItem.replyMaxCharacter }
Submit
Cancel
Confirm
Are you sure to Delete?
Yes
No