Your browser does not fully support modern features. Please upgrade for a smoother experience.
Submitted Successfully!
 +1 credit
Thank you for your contribution! You can also upload a video entry or images related to this topic.
For video creation, please contact our Academic Video Service.
| Version | Summary | Created by | Modification | Content Size | Created at | Operation |
|---|---|---|---|---|---|---|
| 1 | Sung-Woo Byun | -- | 1307 | 2024-01-10 07:32:59 | | | |
| 2 | Catherine Yang | Meta information modification | 1307 | 2024-01-10 08:32:52 | | | | |
| 3 | Catherine Yang | Meta information modification | 1307 | 2024-01-12 07:53:22 | | |
Video Upload Options
We provide professional Academic Video Service to translate complex research into visually appealing presentations. Would you like to try it?
Cite
If you have any further questions, please contact Encyclopedia Editorial Office.
Chang, I.; Byun, S.; Lim, T.; Park, G. Design and Development of the Gas Detection Platform. Encyclopedia. Available online: https://encyclopedia.pub/entry/53641 (accessed on 24 June 2026).
Chang I, Byun S, Lim T, Park G. Design and Development of the Gas Detection Platform. Encyclopedia. Available at: https://encyclopedia.pub/entry/53641. Accessed June 24, 2026.
Chang, Il-Sik, Sung-Woo Byun, Tae-Beom Lim, Goo-Man Park. "Design and Development of the Gas Detection Platform" Encyclopedia, https://encyclopedia.pub/entry/53641 (accessed June 24, 2026).
Chang, I., Byun, S., Lim, T., & Park, G. (2024, January 10). Design and Development of the Gas Detection Platform. In Encyclopedia. https://encyclopedia.pub/entry/53641
Chang, Il-Sik, et al. "Design and Development of the Gas Detection Platform." Encyclopedia. Web. 10 January, 2024.
Copy Citation
A gas detection platform was constructed using commercial sensors and embedded boards, and experimental data were collected in a hood environment such as used in chemical experiments. Electronic devices and data analysis procedures must be specifically tailored to develop an electronic olfactory system.
electronic nose system
gas recognition
artificial olfactory
environmental application
gas sensor
1. Gas Detection Platform Hardware Design
In general, gas detection as an electric signal has been found to be stable in various environments and temperature ranges and to respond sensitively and quickly to various concentrations and potential analytes. To meet these conditions, MOx sensors have frequently been used in research and have shown good performance. In this study, following these approaches, a gas detection platform was constructed based on the gas detection platform design used in previous e-nose research [1]. The gas detection platform detects a variety of analytes in a demonstration facility and tracks changes in the generated chemical analyte gas. The gas detection platform’s gas sensor measures changes in electrical conduction, captured in time series through the MOx film via interactions that reduce or oxidize the analyte gas on the film’s surface. A multivariate response is displayed to various odoriferous or odorless gas stimuli discharged throughout the sensor electrodes. For this reason, in most studies, multiple sensors rather than a single sensor are used in the gas detection platform, with the sensor configuration varying depending on the type of gas to be detected. In the research, when a small amount of gas was used for an empirical experiment, gases that were relatively harmless to the human body were selected based on the advice of a chemical expert; the type, characteristics, and precautions associated with the selected gas are shown in Table 1. The selected gases mentioned in Table 1 were used in the experiments.
Table 1. The type, characteristics, and precautions associated with the selected gas.
| Name | Advice | Other |
|---|---|---|
| Benzene | Inhaling benzene can lead to drowsiness, dizziness, and loss of consciousness, while prolonged exposure to benzene can affect the bone marrow, leading to anemia and leukemia. | It is recommended to use just one or two drops in the Petri dish. |
| Toluene | Excessive inhalation may result in functional disorders such as abdominal pain and vomiting, or neurological disorders such as headaches and hallucinations. | |
| Ammonia | When exposed to high levels of ammonia, it is rapidly absorbed by the mucous membranes, destroying cellular tissue to a lethal level. | It is recommended to use ammonium hydroxide, which is diluted with water. |
| Acetone | It can be harmful if inhaled into the airway, and long or repeated exposure can damage blood in the body. | Relatively safe. |
| Ethanol | Ethanol is used to disinfect non-human medical equipment, such as hand disinfection, without wounds. | Relatively safe. |
Arduino, an open-source computing platform and software development environment based on a microcontroller board, is associated with a digital device that can process commands and controls by connecting interactive objects such as sensors or components. To construct a gas detection platform, this research used the Arduino Nano board, a small microcontroller (ATmega328P) board developed by Arduino.cc with a compact form factor that has 32 KB of memory consisting of 30 pins and a clock speed of 16 MHz, consisting of eight ADC ports that can receive analog sensor values [2]. As mentioned above, there are various types of sensors depending on the gas to be detected; these sensor types are used to find and classify various gases. The Arduino sensor, known as the MQ gas sensor, detects a variety of gases, including alcohol, smoke methane, LPG, hydrogen, ammonia, benzene, and propane [3]. A total of four sensors (MQ-3, MQ-135, MQ-137, and MQ-138) were used in this research, as follows. First, the MQ-3 gas sensor module can detect carbon monoxide, methane, benzene, hexane, LPG, and alcohol, and features high sensitivity and fast response speed; the sensitivity of the sensor can be changed using a potentiometer. This gas sensor module is highly sensitive to alcohol and can also be used as a breathalyzer. Second, the MQ-135 gas sensor module can identify hazardous gases and smoke, including ammonia, sulfur, benzene, and carbon dioxide. Like other MQ Series gas sensors, this sensor has pins for digital and analog outputs; the digital pin output increases when the amount of gas exceeds a predetermined threshold, which can be adjusted using a potentiometer. The analog voltage generated by the analog output pin can be used to approximately measure the concentration of various gases in the atmosphere. Third, the MQ-137 gas sensor is a sensor for measuring ammonia; using a simple circuit, changes in conductivity can be converted into an output signal of the corresponding gas concentration. This sensor is very sensitive to gaseous ammonia and has excellent detection performance for organic amines such as trimethylamine and calamine. Lastly, the MQ-138 gas sensor can detect benzene, toluene, alcohol, acetone, propane, formaldehyde, and hydrogen gas, and is particularly sensitive to toluene, acetone, alcohol, and methanol. It can also be used to monitor hydrogen and organic vapors. The configuration and design of the sensor and board used in this research are shown in Figure 1.
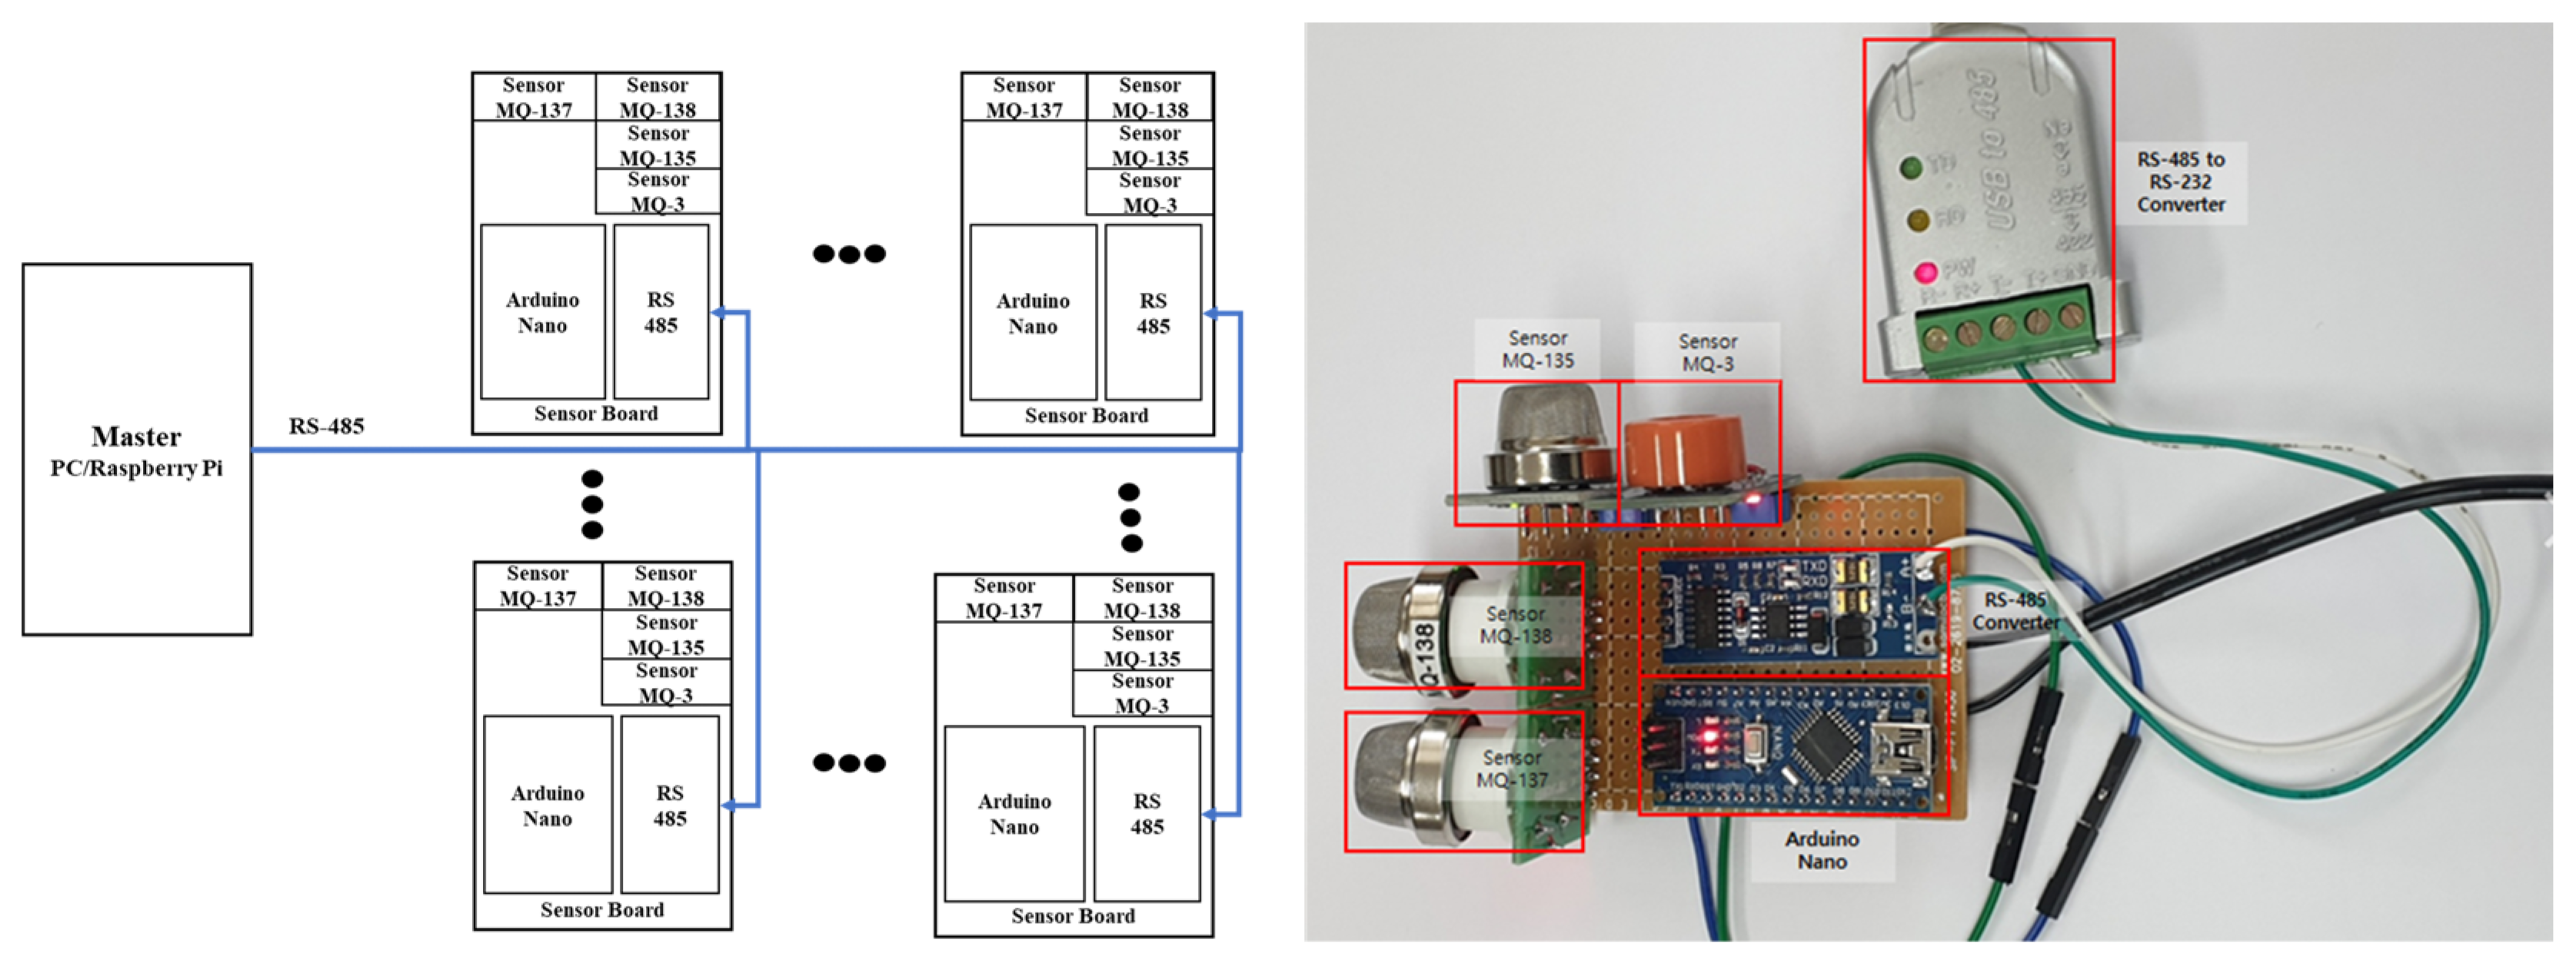
Figure 1. The configuration and design of the sensor and board.
All four sensors operate at 5 V, and the pin configurations consist of VCC, GND, DO (Digital Out), and AO (Analog Out). In this research, VCC, GND, and AO are used, with AO connected to the ADC pin of the Arduino board. Arduino Nano has a 10-bit resolution providing sensor values ranging from 0 to 1023. In order to collect all data from each sensor board, the half-duplex RS-485 communication method is used as shown in Figure 1. RS-485 is a communication method capable of a transmission distance of approximately 1.2 km at a speed of 100 kbps. Using a PC or Raspberry Pi as the master, the slave’s sensor data are collected at regular intervals by initially assigning a different ID to each sensor board.
2. Gas Detection Platform Software Design
Boosting is a type of ensemble learning, a machine learning technique that combines multiple weak learners to create a strong learner. Boosting algorithms work by training models sequentially and compensating for errors in previous models. Well-known boosting algorithms include AdaBoost, gradient boosting, XGBoost, and LightGBM.
Structured data refers to tabular data consisting of rows and columns, where each row generally represents an observation and each column represents a feature. Boosting algorithms are among the algorithms primarily suited to structured data. The key aspect of the relationship between boosting algorithms and structured data is that boosting algorithms show high performance on structured data because they combine weak learners to generate a strong prediction model. Boosting trains the next model by focusing on the errors of the previous model. Structured data can contain various types of features, such as categorical and numeric features, and boosting algorithms are well-suited to handling various feature types and capturing the interactions between features. For this reason, boosting algorithms show excellent performance on structured data, handling a variety of characteristics well, and are effective in reducing overfitting. Therefore, a boosting algorithm may be more suitable than a complex deep learning model when creating an e-nose model.
Adaboost, the original boosting algorithm, functions by simply increasing the weight of misclassified data points in the decision tree so that they are better classified on the next pass. The concept of the gradient boost model, on the other hand, is to find the value that minimizes the loss function by applying the gradient descent algorithm rather than increasing the weight of error values. Although the gradient is changed several times by a certain amount in the negative direction of the slope, the major drawback of most boosting algorithms, including this type of gradient boosting model, is the risk of overfitting. To prevent overfitting in gradient boosting, a regularization term is added to the loss function. With this approach, XGBoost is widely known for its excellent performance in regression and classification.
References
- Vergara, A.; Fonollosa, J.; Mahiques, J.; Trincavelli, M.; Rulkov, N.; Huerta, R. On the performance of gas sensor arrays in open sampling systems using inhibitory support vector machines. Sens. Actuators B Chem. 2013, 185, 462–477.
- Arduino Nano. Available online: https://docs.arduino.cc/hardware/nano (accessed on 3 January 2024).
- All About MQ Series Gas Sensor. Available online: https://robocraze.com/blogs/post/mq-series-gas-sensor (accessed on 3 January 2024).
More
Information
Contributors
MDPI registered users' name will be linked to their SciProfiles pages. To register with us, please refer to https://encyclopedia.pub/register
:
View Times:
643
Revisions:
3 times
(View History)
Update Date:
12 Jan 2024
Table of Contents


Notice
You are not a member of the advisory board for this topic. If you want to update advisory board member profile, please contact office@encyclopedia.pub.
OK
Confirm
Only members of the Encyclopedia advisory board for this topic are allowed to note entries. Would you like to become an advisory board member of the Encyclopedia?
Yes
No
${ textCharacter }/${ maxCharacter }
Submit
Cancel
Back
Comments
${ item }
|
${ item.createdUser.fullName }
${ item.createdAt }
${ item.vote }
${ item.reply }
Delete
${ reply.createdUser.fullName }
${ reply.createdAt }
${ reply.vote }
Delete
There is no reply to this comment~
${ item.replyTextCharacter }/${ item.replyMaxCharacter }
Submit
Cancel
More
No more~
There is no comment~
${ textCharacter }/${ maxCharacter }
Submit
Cancel
${ selectedItem.replyTextCharacter }/${ selectedItem.replyMaxCharacter }
Submit
Cancel
Confirm
Are you sure to Delete?
Yes
No