Submitted Successfully!
To reward your contribution, here is a gift for you: A free trial for our video production service.
Thank you for your contribution! You can also upload a video entry or images related to this topic.
Version Summary Created by Modification Content Size Created at Operation
1 -- 5156 2024-01-09 19:10:37 |
2 format correct Meta information modification 5156 2024-01-10 09:25:11 |

Video Upload Options

Do you have a full video?

Confirm

Are you sure to Delete?
Cite
If you have any further questions, please contact Encyclopedia Editorial Office.
Salimi, M.; Roshanfar, M.; Tabatabaei, N.; Mosadegh, B. Machine Learning-Assisted Short-Wave InfraRed (SWIR) Techniques. Encyclopedia. Available online: https://encyclopedia.pub/entry/53624 (accessed on 04 July 2024).
Salimi M, Roshanfar M, Tabatabaei N, Mosadegh B. Machine Learning-Assisted Short-Wave InfraRed (SWIR) Techniques. Encyclopedia. Available at: https://encyclopedia.pub/entry/53624. Accessed July 04, 2024.
Salimi, Mohammadhossein, Majid Roshanfar, Nima Tabatabaei, Bobak Mosadegh. "Machine Learning-Assisted Short-Wave InfraRed (SWIR) Techniques" Encyclopedia, https://encyclopedia.pub/entry/53624 (accessed July 04, 2024).
Salimi, M., Roshanfar, M., Tabatabaei, N., & Mosadegh, B. (2024, January 09). Machine Learning-Assisted Short-Wave InfraRed (SWIR) Techniques. In Encyclopedia. https://encyclopedia.pub/entry/53624
Salimi, Mohammadhossein, et al. "Machine Learning-Assisted Short-Wave InfraRed (SWIR) Techniques." Encyclopedia. Web. 09 January, 2024.
Machine Learning-Assisted Short-Wave InfraRed (SWIR) Techniques
Edit

Personalized medicine transforms healthcare by adapting interventions to individuals’ unique genetic, molecular, and clinical profiles. To maximize diagnostic and/or therapeutic efficacy, personalized medicine requires advanced imaging devices and sensors for accurate assessment and monitoring of individual patient conditions or responses to therapeutics. In the field of biomedical optics, short-wave infrared (SWIR) techniques offer an array of capabilities that hold promise to significantly enhance diagnostics, imaging, and therapeutic interventions. SWIR techniques provide in vivo information, which was previously inaccessible, by making use of its capacity to penetrate biological tissues with reduced attenuation and enable researchers and clinicians to delve deeper into anatomical structures, physiological processes, and molecular interactions. Combining SWIR techniques with machine learning (ML), which is a powerful tool for analyzing information, holds the potential to provide unprecedented accuracy for disease detection, precision in treatment guidance, and correlations of complex biological features, opening the way for the data-driven personalized medicine field. Despite numerous biomedical demonstrations that utilize cutting-edge SWIR techniques, the clinical potential of this approach has remained significantly underexplored. 

personalized medicine short-wave infrared (SWIR) techniques machine learning deep learning biomedical optics individualized bioinstruments

1. Common SWIR Imaging Technologies

1.1. Fluorescent Imaging

Fluorescent (or fluorescence) imaging is a commonly used technique in the field of biomedicine, employed to image samples ranging from the cellular level on a microscope slide to larger tissue samples in vivo [1]. In clinical settings, fluorescence imaging is now employed as a tool for intraoperative guidance during surgeries in various configurations suitable for both open and laparoscopic surgery with potential applications, including tumor delineation, metastasis detection, and nerve visualization multiplexing [2]. Biomedical images generated in the SWIR frequency range offer striking contrast, precisely outlining tumor boundaries. Surgeons utilize these images to guide intricate procedures, ensuring accurate tumor removal while minimizing impact on healthy tissues. These compelling images not only demonstrate the immediate clinical relevance of SWIR fluorescence in enhancing surgical precision, but also emphasize its potential to revolutionize intraoperative decision making. This application captures the large interest of readers by highlighting the tangible benefits of SWIR fluorescence imaging in improving surgical outcomes and paving the way for more effective and targeted interventions in the field of personalized medicine. Fluorescent imaging has also been applied to pharmacology, offering real-time monitoring of drug distribution within the vasculature of animals [3].
In this method, fluorophores within the sample are illuminated by light at the excitation wavelength, and the resulting emitted fluorescent light is captured by an SWIR camera [1]. Figure 1a illustrates the schematic of the epi-illumination SWIR fluorescent (SWIRF) imaging technique. A common approach for illuminating the sample is the wide-field configuration, where the entire sample is illuminated simultaneously, see Figure 1a [1][4]. However, as the emitted light from different points within the sample interacts, the signals received by the camera are semi-quantitative. For quantitative results, the fluorescence molecular tomography (FMT) method is recommended (Figure 1b), involving the raster scanning of the sample surface with a narrow light beam [1][4]. FMT, subsequently, employs an inverse modeling approach to generate a three-dimensional tomogram depicting the distribution of fluorophores within the sample. One key downside of FMT, however, is the relatively long acquisition and data processing times.
Figure 1. Schematic of SWIR techniques. (a) SWIRF system with wide-field epi-illumination method, (b) SWIRF with FMT configuration; hyper/multi spectral imaging with (c) reflectance and (d) transmittance setting; OCT systems with (e) swept source and (f) spectral domain configuration.

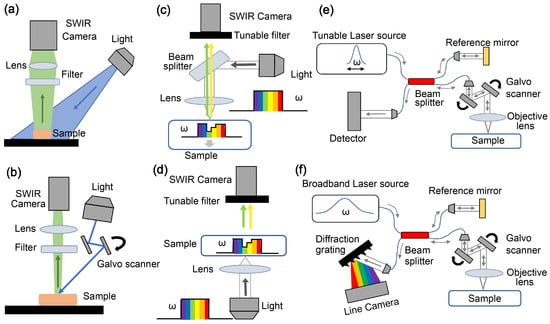
1.2. Multispectral/Hyperspectral Imaging

Spectroscopy is a measurement approach to characterize biological tissues by interrogating their responses to a spectrum of light or collection of wavelengths [5]. When a sample is imaged continuously across a range of wavelengths, the technique is referred to as hyperspectral imaging. Conversely, if the sample is imaged within discontinuous wavelength intervals, it is called multispectral imaging. Both approaches can yield spectra of the sample in either a reflectance (Figure 1c) or transmittance configuration (Figure 1d). Analyzing the recorded spectrum of each camera pixel allows for getting insight into the chemical makeup of the given part of the tissue [5][6].
In the SWIR range, spectroscopy reveals more distinct features in the spectra of tissue constituents, such as water, lipid, and collagen, compared to shorter wavelengths [7][8]. Furthermore, incident light in the SWIR range is less affected by scattering events, enabling deeper exploration of tissue surfaces for targeted molecules [5]. These advantages of SWIR spectroscopy offers heightened sensitivity to tissue constituents, facilitating enhanced characterization of variations in tissue composition concentrations resulting from conditions such as atherosclerotic plaque, tumors, and skin burns [6][7]. Spectroscopic systems hold the potential to serve as a virtual method for histology, where excised tissues are immediately analyzed by intraoperative post-biopsy procedures without the necessity of staining with chemical agents. Additionally, to study brain function in the field of neuroscience, hyperspectral images generated in the SWIR frequency range provide intricate details about oxygenation levels and metabolic activities in different brain regions, offering a comprehensive view of neural processes. These captivating images not only contribute to our understanding of complex brain functions, but also hold promise for unraveling mysteries related to neurodegenerative disorders. It is worth mentioning that one limitation of spectroscopic methods is their inherent lack of depth resolution, which means they provide a broad overview of the chemical composition of tissue beneath the surface without precise discrimination of information at specific depths.

1.3. Optical Coherence Tomography (OCT)

OCT is a method of interferometry that creates high-resolution 2D and 3D images of biological tissues at the micron level [9]. A prevalent type of OCT is Fourier-domain OCT, available in two configurations: swept source (Figure 1e) and spectral domain (Figure 1f). In both configurations, elastically back-reflected light from various tissue structures interfere with a reference light beam, generating a fringe pattern in the Fourier domain [9]. Applying Fourier analysis on this pattern transforms the “wavenumber” space (k-space) information into the “physical length” space (z-space). The absolute values of the complex numbers resulting from this Fourier transformation constitute the structural image of the tissue. In addition, the phase of the Fourier transformation result represents the differences in optical path lengths between tissue layers and the reference mirror. OCT functional modalities tied to phase, such as photothermal (PT)-OCT [10] and optical coherence elastography (OCE) [11], leverage phase variations over time to obtain additional information about tissue molecular and mechanical characteristics. In such modalities, the supplementary phase information automatically overlays on the high-resolution structural OCT amplitude images, creating a depth-resolved map for the additional properties of the tissue.

2. Biomedical Applications of ML-Assisted SWIR Techniques

In general, ML can provide valuable support to SWIR techniques in three distinct ways: (1) Assistance in Diagnosis: ML can effectively analyze SWIR data and images to aid clinicians in making more accurate diagnoses; (2) Quantitative imaging and prognosis: ML can be leveraged to extract quantitative data from multifactorial SWIR datasets, enabling the extraction of precise information from biological systems (e.g., for disease staging); (3) Overcoming technological limitations: ML also has the potential to enhance the performance of SWIR technologies (e.g., increase imaging speed or image quality) without any hardware modification.

2.1. Assistance in Diagnosis

SWIR techniques offer promising solutions for biomarker detection in various diseases, particularly in cardiovascular diseases (CVDs) and cancers, which are leading causes of global hospitalization and mortality. ML as a transformative technology to analyze complex clinical data can assist in the interpretation of results from SWIR techniques, thereby enhancing diagnostic precision [12]. Remarkably positive outcomes have emerged from ML’s application in diagnosing both CVDs [13] and cancers [14], spanning various clinical stages. The text below scrutinizes recent advancements in ML-assisted diagnostics of SWIR images based on a clinical area of application.

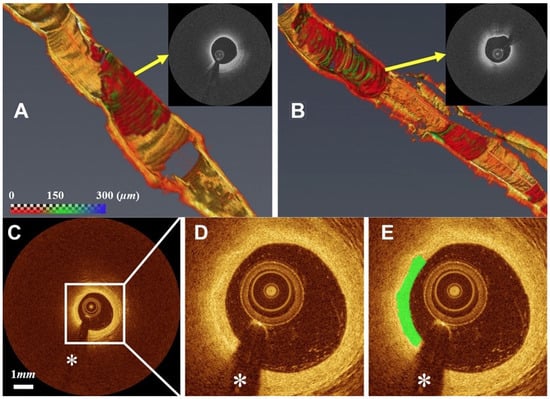
2.1.1. Cardiovascular Diseases (CVDs)

According to the World Health Organization (WHO), CVDs, a group of disorders related to the heart and its blood vessels, are responsible for an estimated 17.9 million deaths annually [15]. Atherosclerosis, characterized by the accumulation of substances such as lipids within the artery walls, contributes to a majority of CVDs [16]. In developed stages, atherosclerosis plaque leads to myocardial infarction, commonly known as a heart attack, by obstructing blood flow in the coronary arteries. Studies emphasize the critical role of plaque structure and composition, particularly its fibrous cap thickness as a determinant of high-risk plaques [17]. For example, thin cap fibroatheroma (TCFA), a primary type of high-risk plaque, typically exhibits a fibrous cap thickness of less than 65 µm [17]. These structural and molecular plaque instability hallmarks, however, are complex and frequently not detectable from angiographic images. IV-OCT serves as a diagnostic SWIR technique for various subclinical vascular diseases (SVDs) by enabling visualization of abnormalities within cardiovascular tissues during cardiac catheterization. IV-OCT excel at detecting structural abnormalities such as atherosclerotic plaque by providing micron-resolution cross-sectional images of the arterial walls [18].
However, classification of the degree of vulnerability of plaque to rupture from IV-OCT images is frequently inaccurate due to the multifactorial nature of light-matter interactions. As such, ML models, particularly DNN, have been widely employed to automatically characterize and classify both cardiac tissue [19][20] and plaque from IV-OCT results [21]. These studies leverage deep learning models to robustly identify various intracoronary pathological formations from OCT images. They showcase high accuracy, sensitivity, and specificity of the deep learning models, with values as high as 0.99 ± 0.01. These advancements hold substantial promise for improving the efficiency and accuracy of CVD diagnoses, contributing to enhanced patient care and outcomes in the field of pediatric cardiology. Furthermore, supervised DNN models were used in various studies to detect, classify, and segment TCFA from IV-OCT results (Figure 2) [22][23]. As an illustration, the automatic detection of TCFA from each B-scan through an IV-OCT pullback is rendered in a 3D map, with the cap thickness information depicted in Figure 2. In cases where supervised training with extensive labeled datasets is unfeasible, weak supervised learning methods have been proposed for TCFA detection [24]. These studies achieved high sensitivities and specificities for plaque classification, and demonstrated excellent reproducibility and efficient clinical analyses. These advancements have the potential to enhance patient care and streamline clinical workflows.
Figure 2. Automated detection results for TCFA from IVOCT pullbacks with ML. (A) Short lesion with TCFA, (B) long lesion with TCFA. The color bar in panel (A) represent the cap thickness. These three-dimensional (3D) visualizations results come from real-time analysis of each (C) captured cross sections by the ML model. For better visualization, panel (D) represents the zoomed view of the cross section and panel (E) indicates the zoomed view overlaid with a fibrous cap with a green color. The white asterisk (∗) is the guidewire shadow. Figures adapted with permission from [22].
In the treatment stage, a recent study assessed the effectiveness of statin-based treatments on TCFA [25]. Using ML models, the study analyzed IV-OCT results from 69 patients over 8–10 weeks to predict changes in cap thickness. When dealing with limited datasets for ML unit training, alternative ML models can be utilized. For instance, a decision-tree-based model was trained using voxels from 300 images to classify plaques [26]. Identification of stents in IV-OCT scans aids cardiologists in assessing stent deployment and tissue coverage post-implantation. Diverse ML models, including DNN [27], Bayesian networks [28], decision trees [29], and SVM [30], have been employed to detect stents in IV-OCT results. A software tool called OCTOPUS V.1, incorporating various ML models, has been developed for offline analysis of both plaques and stents [31].
Furthermore, SWIR techniques have proven valuable for analyzing Heart Failure (HF), another prevalent form of CVD, affecting over 64 million people worldwide [32]. HF is characterized by the heart’s inability to efficiently fill with or pump blood due to structural or functional abnormalities. ML models have been utilized to enhance the quantification of edema; a key manifestation of HF [32]. Edema arises when an excessive volume of fluid accumulates in organs due to reduced blood pumping. Molecular chemical imaging in SWIR, as a hyperspectral technique, has been performed on patients. Spectral data obtained from these analyses were processed using Partial Least Squares (PLS) ML models to: (1) differentiate spectra from healthy and HF cases and (2) quantify the degree of edema.

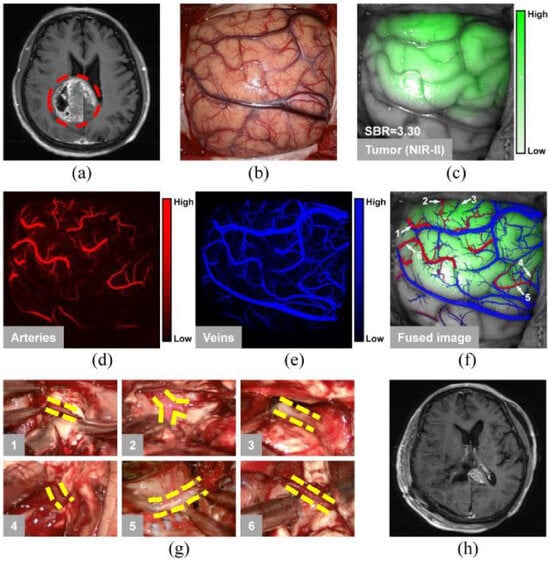
2.1.2. Cancer Diagnosis and Surgical Interventions

Cancer stands as the second leading cause of death globally, accounting for nearly 10 million deaths in 2020 [33]. Surgical procedures have been employed in 45% of cases for cancer treatment [34]. Precise intraoperative tumor delineation plays a pivotal role in enhancing the effectiveness of surgical interventions. Extension of fluorescent surgery in SWIR holds promising potential to aid clinicians in achieving more precise intraoperative tumor delineation. Within neurological surgery, specifically addressing gliomas—a prevalent malignant primary nervous system tumor—conventional practices rely on surgeons’ visual assessments aided by intraoperative histopathological findings from dissected tissues [35]. However, this approach lengthens procedure times and adds complexity and uncertainty. By leveraging deep learning models to analyze SWIRF data from collected tissue, real-time and highly accurate detection of tumor regions becomes achievable. In the study, employing a DNN on SWIRF data demonstrated the capacity to detect non-trivial features in images, yielding superior performance in identifying tumor regions (93.8%) compared to neurosurgeon evaluations (82.0%, p < 0.001) [35].
It is important to note that due to the multifactorial nature of SWIRF signals, relying solely on pixel intensity for tumor delineation can lead to errors. To address this challenge, a study pursued tumor delineation within small animals in vivo utilizing a multispectral SWIR approach [34]. To enhance decision accuracy, captured tumor region spectra were subjected to analysis by seven distinct ML models. Results revealed that despite subtle differences between tumor and non-tumor spectra, employing KNN models increased classification accuracy to 97.1% for tumors, 93.5% for non-tumors, and 99.2% for background regions. Another study focused on distinguishing malignant kidney tissues from normal tissues in an ex vivo setting [36]. Raman spectroscopy in the SWIR range was used to obtain spectra containing various peaks, reflecting tissue conditions (normal or malignant). To classify these spectra, a Bayesian ML model called sparse multinomial logistic regression (SMLR) was applied. The study showcased a classification accuracy of 92.5%, sensitivity of 95.8%, and specificity of 88.8% using this ML model.
Furthermore, as a pioneering advancement in the field of intraoperative surgical procedures for glioma resection in humans, a groundbreaking method has been devised leveraging multispectral fluorescence spanning the NIR and SWIR spectra (see Figure 3) [37]. The inherent high contrast images provided by SWIR technology empower surgeons to identify capillaries with unprecedented precision, detecting vessels as small as 182 μm, while enhancing the certainty of isolating tumor-feeding arteries. In order to process these images in real time, a DNN equipped with a U-Net structure was harnessed for the purpose of segmenting the intricate blood vasculature. This innovative approach not only revolutionizes intraoperative procedures but also underscores the potential of advanced imaging technologies to redefine the landscape of surgical interventions.
Figure 3. Showcase of blocking feeding arteries and tumor resection of a patient with GBM using the image-guided method. (a) MRI scans before surgery indicated a lesion in the right parietal (red circle). (b) Scan results with visible light after dural opening. (c) Scan of tumor with SWIRF method. NIR-IIb image of the (d) feeding arteries and (e) veins. (f) Integrated image of these separate scans. White arrows 1–6 correspond to the location of the tumor-feeding arteries. (g) Yellow lines show the feeding arteries blocked as a result of tumor resection during surgery. Panel 1–6 correspond to the vessels labeled as 1–6 in (f). (h) MRI scan shows the tumor was resected to the maximum extent after this image-guided surgery. Figure adapted with permission from [37].
In surgical procedures, the accurate segmentation of vessels, overlapping structures, and junctions within SWIRF images emerges as a critical necessity. A previous study has demonstrated the application of DNN for vasculature segmentation purposes, in preclinical phases as a proof of concept [38]. The Iter-Net model, originally devised for retinal segmentation, accurately delineated murine vasculature captured in vivo using SWIRF imaging. Remarkably, the DNN not only achieved effective segmentation, but also collected supplementary vascular insights encompassing morphological details, discernment of vessel types (veins or arteries), and characterization of hemodynamic attributes. These accomplishments hold the potential to extend into the SWIRF-guided surgery, offering valuable assistance to surgeons during operative interventions.
An innovative method was reported for detecting tumoral epithelial lesions through the synergy of hyperspectral imaging and deep learning. Detecting these lesions early is crucial for effective cancer diagnosis and treatment planning. DNN RetinaNet was then utilized to automatically identify and classify these lesions. The findings highlight the effectiveness of this approach, offering a promising non-invasive solution for early-stage cancer detection, with potential implications for enhancing patient care and treatment strategies [39].
OCT and its extended modalities have gained prominence in cancer-related applications, due to the fine resolution, high acquisition rate, and millimeter-scale imaging depth, especially in intraoperative tumor margin evaluation. Moreover, compatibility of OCT with fiber optic technology enables miniaturization of its imaging head into diverse portable formats, such as handheld, needle probes, and single fibers, which enables precise assessment of tumor margins during breast-conserving surgeries [9]. By harnessing DNN, clinical OCT datasets sourced from patients with breast tumors have achieved remarkable outcomes, indicating a 98.9% accuracy in the classification of 44 normal and 44 malignant cases [40]. Additionally, the fusion of ultrahigh-resolution OCT systems operating in NIR and SWIR ranges, coupled with the assistance of a Relevance Vector Machine ML model, demonstrated an automatic detection capability for invasive ductal carcinoma within ex vivo human breast tissue, achieving an overall accuracy of 84% [41]. Further demonstrating the efficacy of OCT, a study employing an SVM model to classify OCT images from cancerous tissues yielded exceptional metrics with sensitivity, specificity, and accuracy values of 91.56%, 93.86%, and 92.71%, respectively, [42]. In microscopy, the integration of OCT and Raman spectroscopy yielded a comprehensive set of morphological, intensity, and spectroscopic features for ML models aimed at classifying cancer cells in an in vitro setting. By subjecting the images to analysis using three distinct ML models, namely linear discriminant analysis, KNN, and decision tree, the study achieved an impressive classification accuracy of 85% for distinguishing among five different types of skin cells [43]. A recent advancement involves the application of polarization sensitive (PS)-OCT, as a modality of OCT to provide higher contrast for differentiation and classification of malignant tumors, fibro-adipose tissues, and stroma within human excised breast tissues [44]. Employing leave-one-site-out cross-validation, an SVM model was trained to categorize the captured images. The outcome yielded an 82.9% overall accuracy when compared against histopathological results, substantiating the potential of PS-OCT in offering reliable cancer diagnostic insights.
Beyond the aforementioned primary SWIR imaging techniques, novel imaging systems have emerged in this spectral range. For example, an innovative technique grounded in orthogonal polarization imaging (OPI) within the SWIR range enabled size measurements of lymph nodes in both animal and human samples [45]. Given that cancer cells metastasize through the vascular and lymphatic system, this study harnessed deep U-Net models for high-contrast, label-free image analysis to automatically segment lymph nodes. These advancements highlight the profound impact of ML-assisted SWIR techniques in enhancing cancer diagnosis and surgical interventions.

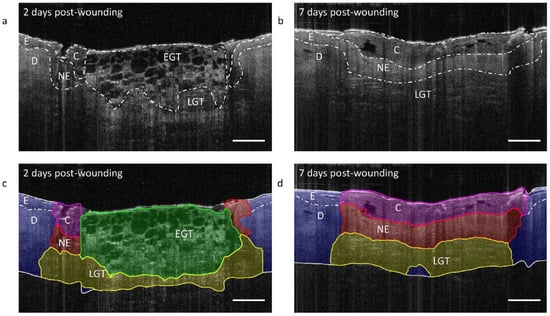
2.2. Quantitative Imaging and Prognosis

ML has also proven to be powerful in quantifying signals obtained through SWIR techniques, offering insights into health-related measurements. For instance, the quantification of water and lipid contents in tissues holds value for monitoring physiologic levels. To this end, an SWIR probe designed for scanning thin tissues, utilizing diffused light, was constructed using three LED light sources and four source-detector separations [46]. Employing a DNN, the percentage of water and lipid components were estimated by analyzing the received signals in the detectors. Training the DNN involved simulating various conditions through precise Monte Carlo simulations. Results on phantoms demonstrated accurate quantification of water (2.1 ± 1.1% error) and lipid (1.2 ± 1.5% error) components using this approach. Expanding this study to the meso-patterned imaging (MPI) modality facilitated monitoring important physiological processes in clinics, including edema, inflammation, and tumor lipid heterogeneity [47]. In this context, hyperspectral MPI results were subjected to analysis by an SVM model for identifying subcutaneous brown adipose tissue.
In another study utilizing spectroscopy, in vivo skin parameters were quantified by applying two ML models to spectral reflectance results captured by sensors spanning from 450 to 1800 nm [48]. Quantifying skin parameters holds immense importance in dermatology, benefiting cancer diagnostics, wound healing, drug delivery, and related applications such as skin aging. The study introduced a theoretical model correlating skin physiological parameters to back-reflected light spectra. SVM and KNN models were then applied in a reverse modeling approach to derive skin parameters from the back-reflected spectra. Results from 24 human cases showcased favorable agreement between the prediction results from this non-invasive method and ground truth data.
Within the domain of OCT, quantitative techniques have emerged, which are independent of the specific OCT system used for data acquisition for clinically relevant measurements. ML models have also proven to be capable in enhancing precision in quantification of OCT results. For instance, in cardiology, quantifying lipid content aids clinicians in determining the growth stage of atherosclerotic plaques. Beyond cap thickness, lipid-rich necrotic cores serve as significant indicators of high-risk plaques [49]. A study employed a discriminant analysis ML model on spectral and attenuation data, based on acquired OCT spectra to quantify key chemicals, such as lipid, collagen, and calcium, in phantoms and swine ex vivo tissue [50]. This advancement has significant implications for personalized medicine, as it enables precise depth localization of lipids and necrotic cores in coronary plaques, improving the interpretation of IV-OCT data and facilitating tailored treatment approaches. In the field of dermatology, a U-Net model was applied to OCT results from wounds to quantify wound morphology during the healing process [51]. This approach automatically detects wound morphology and quantifies volumetric transitions throughout treatment, promising a non-invasive and real-time method for wound monitoring (Figure 4).
Figure 4. Monitoring results of wound healing. After (a) 2 and (b) 7 days, images acquired with OCT are shown with their segmented (c,d) regions in the corresponding OCT B-scan with ML model. The annotations are: blood clot (C); dermis (D); epidermis (E); early granulation tissue (EGT); late granulation tissue (LGT); neo-epidermis (NE). Scale bar = 500 μm. Figure adapted with permission from [51].
In the field of ophthalmology, ML assists in measuring and quantifying biomarkers in different parts of the eye on OCT scans. A novel deep learning method, the residual U-Net, was introduced for the automated segmentation and quantification of choroidal thickness (CT) and vasculature [52]. Even with limited data, the precision achieved by this approach was comparable to that of manual segmentation conducted by experienced operators. High agreement is observed between manual and automatic segmentation methods, with intraclass correlation coefficients (ICC) exceeding 0.964 on 217 images. Furthermore, excellent reproducibility is demonstrated by the automatic method, with an ICC greater than 0.913. These results highlight the effectiveness of deep learning in accurately and consistently segmenting choroidal boundaries for the analysis of CT and vasculature. The impact of accurate choroidal segmentation using deep learning on personalized medicine concept is substantial, as it contributes to early disease detection, more precise diagnoses, better disease progression monitoring, and overall improvements in the efficiency of ocular healthcare.
In ophthalmology, understanding the human vitreous structure is vital, given its substantial age-related variations, but in vivo study limitations have persisted due to the vitreous transparency and mobility. Although OCT is routinely used to identify boundaries within the vitreous, the acquisition of high-resolution images suitable for generating 3D representations remains a challenge. A study used ML-based 3D modeling, employing a CNN network trained on manually labeled fluid areas [53]. The trained network automatically labeled vitreous fluid, generating 3D models and quantifying vitreous fluidic cavities. This innovative modeling system introduced novel imaging markers with the potential to advance our understanding of the aging processes and the diagnosis of various eye diseases, contributing significantly to ocular health assessment and clinical management.
For precise eye disorder quantification, particularly in complex cases with distorted anatomy, automated segmentation of fluid spaces in OCT imaging is crucial. A novel end-to-end ML approach was presented for combining a random forest classifier for accurate fluid detection and an efficient DeepLab algorithm for quantification and labeling [54]. The method achieves an average Dice score of 86.23%, compared to manual delineations by an expert. This approach promises to significantly improve automated fluid space segmentation and quantification in OCT imaging, enhancing clinical management and monitoring of eye disorders, particularly in complex cases.
Accurate quantification of intrachoroidal cavitations (ICCs) and their effect on visual function is paramount, particularly in high myopia. A study introduced a new 3D volume parameter for ICCs, addressing the need for precise quantification [55]. A significant knowledge gap exists regarding the relationship between 3D ICC volume and visual field sensitivity, and this study quantifies this correlation. Through deep learning-based noise reduction, the study quantified ICCs in 13 eyes with high myopia. It revealed negative correlations between ICC volume, length, depth, and visual field metrics, highlighting the role of quantification in understanding ICC impact. This research introduces a novel parameter for ICC assessment, enhancing our understanding of their effect on visual function. This has the potential to improve clinical detection and precise quantification of ICC pathology in high myopia, ultimately benefiting patient care and management.
Another success of ML models in OCT is enabling quantification of cellular microstructures that are finer than the inherent resolution of OCT. Alterations in light scattering patterns stemming from distributed particles within the phantoms yield significant optical signals. ML has proven to be successful in quantifying such non-trivial patterns in the OCT results. In a study, OCT images of assorted tissue-mimicking phantoms underwent analysis via SVM models to quantify speckle through texture [56]. Furthermore, a DNN was employed to accurately estimate fundamental parameters encompassing the count of scatterers within a resolution volume, lateral and axial resolution, as well as signal-to-noise ratio (SNR) by analyzing local speckle patterns within the OCT images [57]. These networks can also find utility in calibrating OCT systems for exceptionally precise measurements of the attenuation coefficient, exemplifying their potential to enhance the precision and versatility of OCT techniques.
Theoretical models developed for PT-OCT signals demonstrate that PT-OCT signals are influenced by multiple parameters, necessitating consideration of the interplay between them for accurate quantification of titers of molecules of interest [10][58]. Recent applications of SVM models to PT-OCT data successfully classified phantoms based on their lipid content irrespective of their depth within the sample [59]. This study can have a significant impact on personalized medicine by enhancing diagnostic capabilities and improving patient outcomes through a better understanding of lipid-related aspects of various diseases. OCE is another modality of OCT that can provide mechanical-related properties of tissues. A DNN was applied on obtained mechanical properties data from phantoms mimicking tissues with different mechanical elasticity to extract mechanical properties [60]. This advancement in elastic property estimation using DNN from OCE data holds the promise of enhancing personalized medicine by providing clinicians with real-time, non-invasive tools for assessing tissue characteristics and tailoring treatments to individual patient needs.

2.3. Overcoming Technological Limitations

ML offers a promising solution to address certain inherent limitations in SWIR techniques. A notable restriction of SWIRF imaging is the lack of FDA-approved dyes tailored for efficient emission in the SWIR band [61]. Currently, Indocyanine Green (ICG) stands as the lone FDA-approved option, primarily emitting in the NIR-I region (700–900 nm), albeit with a relatively weak emission tail in the SWIR spectrum [61]. A study aimed to harness the power of DNN to convert SWIRF images captured within the NIR-I/IIa window (900–1300 nm) using ICG dyes into comparable images captured in the NIR-IIb (1500–1700 nm) range with SWIR-specialized dyes (see Figure 5) [62]. Results showcased significant enhancement in the signal-to-base ratio (>100) for in vivo lymph node imaging, along with notable improvements in tumor-to-normal tissue ratios (>20) and tumor margin detection through imaging epidermal growth factor receptor after processing ICG images by the trained DNN.
Figure 5. Generativemodel of NIR-IIb from NIR-IIa. Contrast enhancement of SWIRF by generating images with a GAN network to resemble a NIR-IIb image from a NIR-IIa input image (scale bar, 5 mm). Figure adapted with permission from [62].
Another challenge in fluorescent imaging pertains to accurately reconstructing a 3D map of fluorophore distribution, a task constrained by complicated inverse modeling problems. DNNs demonstrated capability to directly render the 3D distribution of fluorophores from raw data, eliminating the need for complex inverse modeling calculations [63]. Increasing the imaging depth in SWIRF has also become possible with DNN models. While the typical maximum penetration depth in soft tissues in the SWIR range spans from 4 to 6 mm, penetration depth decreases to 1.4 mm for brain imaging due to higher tissue scattering. To overcome this limitation, a DNN was trained using images acquired through a two-photon illumination technique. Reconstructing SWIRF images with this network resulted in enhanced SNR in deeper tissue layers [64]. This advancement facilitated 3D volume reconstruction of brain tissues with enhanced details without compromising temporal resolution.
ML models have also addressed some systemic limitations of OCT imaging, such as enhancing image contrast, extending the imaging range, and correcting for degradation of spatial resolution with depth. For instance, dual DNNs have directly enhanced axial resolution from raw interference fringe signals and subsequently reconstructed B-scans to reduce speckle noise [65]. Likewise, DNNs with GAN structures have been trained with different variations of the OCT system to produce speckle-free images [66][67]. For OCT retinal images, speckle noise was effectively removed using CNN [68] and GAN [69] deep networks that autonomously learned from training data, eliminating the need for manual parameter selection. OCT’s challenge of balancing lateral resolution and depth of focus was successfully met by a DNN, which reconstructed out-of-focus en-face images through a GAN structure [70]. ML models have also accelerated OCT systems by reducing required spectral datapoints, followed by DNN-based reconstruction to eliminate aliasing artifacts resulting from undersampling [71][72]. Additionally, to combat axial resolution degradation due to light dispersion in tissues, a modified U-Net architecture has proven effective in compensating for chromatic dispersion in OCT [73].
Beyond conventional OCT, ML models have helped overcome technological limitations of functional extensions of OCT. For instance, in OCT-Angiography (OCTA), the quality of results and the field of view have an inverse relationship. To address the issue, a DNN was employed to transform low-quality outcomes obtained from a 6 mm by 6 mm field of view into high-quality results acquired from a 3 mm by 3 mm field of view [74]. ML has also been used to improve the performance of OCT phase-tied modalities, such as PT-OCT. The quality of results in these modalities have a direct relation with the length of captured time trace OCT phase signal over each A-line. As such, these modalities typically suffer from a low acquisition rate, which renders them impractical for clinical use. In a study, using an ANN model, SNR of images acquired with PT-OCT using short acquisitions were improved to SNR values normally offered by very long acquisition times [75]. Another interesting potential of ML is in extracting additional information from OCT datasets that are not directly accessible via OCT raw images. In a relevant work, a DNN model employing a GAN architecture synthesized PS-OCT images from raw OCT intensity images, avoiding the need for additional hardware needed to construct a PS-OCT system [76].
Similar to OCT, ML has been shown to enhance performance in various other SWIR modalities. For example, DL classifiers were utilized to improve the detection accuracy of otoscopy for diagnosing middle ear effusions [77]. Middle ear effusions, commonly associated with ear infections, are a prevalent medical issue, particularly in pediatric patients. The traditional diagnostic process often involves invasive procedures, which can be uncomfortable and impractical, especially for children. Leveraging advanced DL models, the system analyzes SWIR images of the ear canal and tympanic membrane, identifying specific features indicative of effusion with a specificity and sensitivity over 90%.

References

  1. Stuker, F.; Ripoll, J.; Rudin, M. Fluorescence molecular tomography: Principles and potential for pharmaceutical research. Pharmaceutics 2011, 3, 229–274.
  2. Hernot, S.; van Manen, L.; Debie, P.; Mieog, J.S.D.; Vahrmeijer, A.L. Latest developments in molecular tracers for fluorescence image-guided cancer surgery. Lancet Oncol. 2019, 20, e354–e367.
  3. Qi, J.; Sun, C.; Zebibula, A.; Zhang, H.; Kwok, R.T.; Zhao, X.; Xi, W.; Lam, J.W.; Qian, J.; Tang, B.Z. Real-time and high-resolution bioimaging with bright aggregation-induced emission dots in short-wave infrared region. Adv. Mater. 2018, 30, 1706856.
  4. Zhang, Q.; Grabowska, A.M.; Clarke, P.A.; Morgan, S.P. Numerical Simulation of a Scanning Illumination System for Deep Tissue Fluorescence Imaging. J. Imaging 2019, 5, 83.
  5. Zhang, H.; Salo, D.; Kim, D.M.; Komarov, S.; Tai, Y.C.; Berezin, M.Y. Penetration depth of photons in biological tissues from hyperspectral imaging in shortwave infrared in transmission and reflection geometries. J. Biomed. Opt. 2016, 21, 126006.
  6. Randeberg, L.L. Hyperspectral characterization of tissue in the SWIR spectral range: A road to new insight? In Optical Biopsy XVII: Toward Real-Time Spectroscopic Imaging and Diagnosis; SPIE: Bellingham, WA, USA, 2019; Volume 10873, pp. 125–140.
  7. Wilson, R.H.; Nadeau, K.P.; Jaworski, F.B.; Tromberg, B.J.; Durkin, A.J. Review of short-wave infrared spectroscopy and imaging methods for biological tissue characterization. J. Biomed. Opt. 2015, 20, 030901.
  8. Nachabé, R.; Evers, D.J.; Hendriks, B.H.; Lucassen, G.W.; van der Voort, M.; Rutgers, E.J.; Peeters, M.J.V.; Van der Hage, J.A.; Oldenburg, H.S.; Wesseling, J.; et al. Diagnosis of breast cancer using diffuse optical spectroscopy from 500 to 1600 nm: Comparison of classification methods. J. Biomed. Opt. 2011, 16, 087010.
  9. Drexler, W.; Fujimoto, J.G. Optical Coherence Tomography: Technology and Applications; Springer Science & Business Media: Berlin/Heidelberg, Germany, 2008.
  10. Salimi, M.H.; Villiger, M.; Tabatabaei, N. Three-dimensional opto-thermo-mechanical model for predicting photo-thermal optical coherence tomography responses in multilayer geometries. Biomed. Opt. Express 2022, 13, 3416–3433.
  11. Singh, M.; Zvietcovich, F.; Larin, K.V. Introduction to optical coherence elastography: Tutorial. J. Opt. Soc. Am. A 2022, 39, 418–430.
  12. Wang, S.; Cao, G.; Wang, Y.; Liao, S.; Wang, Q.; Shi, J.; Li, C.; Shen, D. Review and prospect: Artificial intelligence in advanced medical imaging. Front. Radiol. 2021, 1, 781868.
  13. Johnson, K.W.; Torres Soto, J.; Glicksberg, B.S.; Shameer, K.; Miotto, R.; Ali, M.; Ashley, E.; Dudley, J.T. Artificial intelligence in cardiology. J. Am. Coll. Cardiol. 2018, 71, 2668–2679.
  14. Xu, M.; Chen, Z.; Zheng, J.; Zhao, Q.; Yuan, Z. Artificial Intelligence-Aided Optical Imaging for Cancer Theranostics. Semin. Cancer Biol. 2023, 94, 62–80.
  15. World Health Organization. Cardiovascular Diseases. 2023. Available online: http://surl.li/kjhtr (accessed on 23 October 2023).
  16. Bui, Q.T.; Prempeh, M.; Wilensky, R.L. Atherosclerotic plaque development. Int. J. Biochem. Cell Biol. 2009, 41, 2109–2113.
  17. Virmani, R.; Burke, A.P.; Farb, A.; Kolodgie, F.D. Pathology of the vulnerable plaque. J. Am. Coll. Cardiol. 2006, 47, C13–C18.
  18. Tearney, G.J.; Regar, E.; Akasaka, T.; Adriaenssens, T.; Barlis, P.; Bezerra, H.G.; Bouma, B.; Bruining, N.; Cho, J.M.; Chowdhary, S.; et al. Consensus standards for acquisition, measurement, and reporting of intravascular optical coherence tomography studies: A report from the International Working Group for Intravascular Optical Coherence Tomography Standardization and Validation. J. Am. Coll. Cardiol. 2012, 59, 1058–1072.
  19. Abdolmanafi, A.; Duong, L.; Dahdah, N.; Adib, I.R.; Cheriet, F. Characterization of coronary artery pathological formations from OCT imaging using deep learning. Biomed. Opt. Express 2018, 9, 4936–4960.
  20. Abdolmanafi, A.; Duong, L.; Dahdah, N.; Cheriet, F. Deep feature learning for automatic tissue classification of coronary artery using optical coherence tomography. Biomed. Opt. Express 2017, 8, 1203–1220.
  21. Kolluru, C. Deep Neural Networks for A-Line Based Plaque Classification in Intravascular Optical Coherence Tomography Images. Ph.D. Thesis, Case Western Reserve University, Cleveland, OH, USA, 2018.
  22. Lee, J.; Pereira, G.T.; Gharaibeh, Y.; Kolluru, C.; Zimin, V.N.; Dallan, L.A.; Kim, J.N.; Hoori, A.; Al-Kindi, S.G.; Guagliumi, G.; et al. Automated analysis of fibrous cap in intravascular optical coherence tomography images of coronary arteries. Sci. Rep. 2022, 12, 21454.
  23. Lee, J.; Prabhu, D.; Kolluru, C.; Gharaibeh, Y.; Zimin, V.N.; Bezerra, H.G.; Wilson, D.L. Automated plaque characterization using deep learning on coronary intravascular optical coherence tomographic images. Biomed. Opt. Express 2019, 10, 6497–6515.
  24. Shi, P.; Xin, J.; Wu, J.; Deng, Y.; Cai, Z.; Du, S.; Zheng, N. Detection of thin-cap fibroatheroma in IVOCT images based on weakly supervised learning and domain knowledge. J. Biophotonics 2023, 16, e202200343.
  25. Johnson, K.W.; Glicksberg, B.S.; Shameer, K.; Vengrenyuk, Y.; Krittanawong, C.; Russak, A.J.; Sharma, S.K.; Narula, J.N.; Dudley, J.T.; Kini, A.S. A transcriptomic model to predict increase in fibrous cap thickness in response to high-dose statin treatment: Validation by serial intracoronary OCT imaging. EBioMedicine 2019, 44, 41–49.
  26. Kolluru, C.; Prabhu, D.; Gharaibeh, Y.; Wu, H.; Wilson, D.L. Voxel-based plaque classification in coronary intravascular optical coherence tomography images using decision trees. In Medical Imaging 2018: Computer-Aided Diagnosis; SPIE: Bellingham, WA, USA, 2018; Volume 10575, pp. 657–662.
  27. Yang, G.; Mehanna, E.; Li, C.; Zhu, H.; He, C.; Lu, F.; Zhao, K.; Gong, Y.; Wang, Z. Stent detection with very thick tissue coverage in intravascular OCT. Biomed. Opt. Express 2021, 12, 7500–7516.
  28. Wang, Z.; Jenkins, M.W.; Linderman, G.C.; Bezerra, H.G.; Fujino, Y.; Costa, M.A.; Wilson, D.L.; Rollins, A.M. 3-D stent detection in intravascular OCT using a Bayesian network and graph search. IEEE Trans. Med. Imaging 2015, 34, 1549–1561.
  29. Lu, H.; Gargesha, M.; Wang, Z.; Chamie, D.; Attizzani, G.F.; Kanaya, T.; Ray, S.; Costa, M.A.; Rollins, A.M.; Bezerra, H.G.; et al. Automatic stent detection in intravascular OCT images using bagged decision trees. Biomed. Opt. Express 2012, 3, 2809–2824.
  30. Lu, H.; Lee, J.; Ray, S.; Tanaka, K.; Bezerra, H.G.; Rollins, A.M.; Wilson, D.L. Automated stent coverage analysis in intravascular OCT (IVOCT) image volumes using a support vector machine and mesh growing. Biomed. Opt. Express 2019, 10, 2809–2828.
  31. Lee, J.; Kim, J.N.; Gharaibeh, Y.; Zimin, V.N.; Dallan, L.A.; Pereira, G.T.; Vergara-Martel, A.; Kolluru, C.; Hoori, A.; Bezerra, H.G.; et al. OCTOPUS–Optical coherence tomography plaque and stent analysis software. Heliyon 2023, 9, e13396.
  32. Smith, A.G.; Perez, R.; Thomas, A.; Stewart, S.; Samiei, A.; Bangalore, A.; Gomer, H.; Darr, M.B.; Schweitzer, R.C.; Vasudevan, S. Objective determination of peripheral edema in heart failure patients using short-wave infrared molecular chemical imaging. J. Biomed. Opt. 2021, 26, 105002.
  33. World Health Organization. Cancer. 2023. Available online: http://surl.li/cdgtc (accessed on 23 October 2023).
  34. Waterhouse, D.J.; Privitera, L.; Anderson, J.; Stoyanov, D.; Giuliani, S. Enhancing intraoperative tumor delineation with multispectral short-wave infrared fluorescence imaging and machine learning. J. Biomed. Opt. 2023, 28, 094804.
  35. Shen, B.; Zhang, Z.; Shi, X.; Cao, C.; Zhang, Z.; Hu, Z.; Ji, N.; Tian, J. Real-time intraoperative glioma diagnosis using fluorescence imaging and deep convolutional neural networks. Eur. J. Nucl. Med. Mol. Imaging 2021, 48, 3482–3492.
  36. Haifler, M.; Pence, I.; Sun, Y.; Kutikov, A.; Uzzo, R.G.; Mahadevan-Jansen, A.; Patil, C.A. Discrimination of malignant and normal kidney tissue with short wave infrared dispersive Raman spectroscopy. J. Biophotonics 2018, 11, e201700188.
  37. Cao, C.; Jin, Z.; Shi, X.; Zhang, Z.; Xiao, A.; Yang, J.; Ji, N.; Tian, J.; Hu, Z. First clinical investigation of near-infrared window IIa/IIb fluorescence imaging for precise surgical resection of gliomas. IEEE Trans. Biomed. Eng. 2022, 69, 2404–2413.
  38. Baulin, V.A.; Usson, Y.; Le Guével, X. Deep learning: Step forward to high-resolution in vivo shortwave infrared imaging. J. Biophotonics 2021, 14, e202100102.
  39. de Lucena, D.V.; da Silva Soares, A.; Coelho, C.J.; Wastowski, I.J.; Filho, A.R.G. Detection of tumoral epithelial lesions using hyperspectral imaging and deep learning. In Proceedings of the Computational Science—ICCS 2020: 20th International Conference, Amsterdam, The Netherlands, 3–5 June 2020; Proceedings, Part III 20. Springer: Cham, Switzerland, 2020; pp. 599–612.
  40. Butola, A.; Prasad, D.K.; Ahmad, A.; Dubey, V.; Qaiser, D.; Srivastava, A.; Senthilkumaran, P.; Ahluwalia, B.S.; Mehta, D.S. Deep learning architecture “LightOCT” for diagnostic decision support using optical coherence tomography images of biological samples. Biomed. Opt. Express 2020, 11, 5017–5031.
  41. Yao, X.; Gan, Y.; Chang, E.; Hibshoosh, H.; Feldman, S.; Hendon, C. Visualization and tissue classification of human breast cancer images using ultrahigh-resolution OCT. Lasers Surg. Med. 2017, 49, 258–269.
  42. Butola, A.; Ahmad, A.; Dubey, V.; Srivastava, V.; Qaiser, D.; Srivastava, A.; Senthilkumaran, P.; Mehta, D.S. Volumetric analysis of breast cancer tissues using machine learning and swept-source optical coherence tomography. Appl. Opt. 2019, 58, A135–A141.
  43. You, C.; Yi, J.Y.; Hsu, T.W.; Huang, S.L. Integration of cellular-resolution optical coherence tomography and Raman spectroscopy for discrimination of skin cancer cells with machine learning. J. Biomed. Opt. 2023, 28, 096005.
  44. Zhu, D.; Wang, J.; Marjanovic, M.; Chaney, E.J.; Cradock, K.A.; Higham, A.M.; Liu, Z.G.; Gao, Z.; Boppart, S.A. Differentiation of breast tissue types for surgical margin assessment using machine learning and polarization-sensitive optical coherence tomography. Biomed. Opt. Express 2021, 12, 3021–3036.
  45. Li, Z.; Huang, S.; He, Y.; van Wijnbergen, J.W.; Zhang, Y.; Cottrell, R.D.; Smith, S.G.; Hammond, P.T.; Chen, D.Z.; Padera, T.P.; et al. A new label-free optical imaging method for the lymphatic system enhanced by deep learning. bioRxiv 2023.
  46. Spink, S.S.; Pilvar, A.; Wei, L.L.; Frias, J.; Anders, K.; Franco, S.T.; Rose, O.C.; Freeman, M.; Bag, G.; Huang, H.; et al. Shortwave infrared diffuse optical wearable probe for quantification of water and lipid content in emulsion phantoms using deep learning. J. Biomed. Opt. 2023, 28, 094808.
  47. Zhao, Y.; Pilvar, A.; Tank, A.; Peterson, H.; Jiang, J.; Aster, J.C.; Dumas, J.P.; Pierce, M.C.; Roblyer, D. Shortwave-infrared meso-patterned imaging enables label-free mapping of tissue water and lipid content. Nat. Commun. 2020, 11, 5355.
  48. Vyas, S.; Banerjee, A.; Burlina, P. Estimating physiological skin parameters from hyperspectral signatures. J. Biomed. Opt. 2013, 18, 057008.
  49. Finn, A.V.; Nakano, M.; Narula, J.; Kolodgie, F.D.; Virmani, R. Concept of vulnerable/unstable plaque. Arterioscler. Thromb. Vasc. Biol. 2010, 30, 1282–1292.
  50. Fleming, C.P.; Eckert, J.; Halpern, E.F.; Gardecki, J.A.; Tearney, G.J. Depth resolved detection of lipid using spectroscopic optical coherence tomography. Biomed. Opt. Express 2013, 4, 1269–1284.
  51. Wang, Y.; Freeman, A.; Ajjan, R.; Del Galdo, F.; Tiganescu, A. Automated quantification of 3D wound morphology by machine learning and optical coherence tomography in type 2 diabetes. Ski. Health Dis. 2023, 3, e203.
  52. Zheng, G.; Jiang, Y.; Shi, C.; Miao, H.; Yu, X.; Wang, Y.; Chen, S.; Lin, Z.; Wang, W.; Lu, F.; et al. Deep learning algorithms to segment and quantify the choroidal thickness and vasculature in swept-source optical coherence tomography images. J. Innov. Opt. Health Sci. 2021, 14, 2140002.
  53. Takahashi, H.; Mao, Z.; Du, R.; Ohno-Matsui, K. Machine learning-based 3D modeling and volumetry of human posterior vitreous cavity of optical coherence tomographic images. Sci. Rep. 2022, 12, 13836.
  54. Teja, R.V.; Manne, S.R.; Goud, A.; Rasheed, M.A.; Dansingani, K.K.; Chhablani, J.; Vupparaboina, K.K.; Jana, S. Classification and quantification of retinal cysts in OCT B-scans: Efficacy of machine learning methods. In Proceedings of the 2019 41st Annual International Conference of the IEEE Engineering in Medicine and Biology Society (EMBC), Berlin, Germany, 23–27 July 2019; pp. 48–51.
  55. Fujimoto, S.; Miki, A.; Maruyama, K.; Mei, S.; Mao, Z.; Wang, Z.; Chan, K.; Nishida, K. Three-Dimensional Volume Calculation of Intrachoroidal Cavitation Using Deep-Learning–Based Noise Reduction of Optical Coherence Tomography. Transl. Vis. Sci. Technol. 2022, 11, 1.
  56. Kulmaganbetov, M.; Bevan, R.J.; Anantrasirichai, N.; Achim, A.; Erchova, I.; White, N.; Albon, J.; Morgan, J.E. Textural feature analysis of optical coherence tomography phantoms. Electronics 2022, 11, 669.
  57. Seesan, T.; Abd El-Sadek, I.; Mukherjee, P.; Zhu, L.; Oikawa, K.; Miyazawa, A.; Shen, L.T.W.; Matsusaka, S.; Buranasiri, P.; Makita, S.; et al. Deep convolutional neural network-based scatterer density and resolution estimators in optical coherence tomography. Biomed. Opt. Express 2022, 13, 168–183.
  58. Salimi, M.; Villiger, M.; Tabatabaei, N. Effects of lipid composition on photothermal optical coherence tomography signals. J. Biomed. Opt. 2020, 25, 120501.
  59. Salimi, M.; Villiger, M.; Tabatabaei, N. Molecular-Specific Imaging of Tissue with Photo-Thermal Optical Coherence Tomography. Int. J. Thermophys. 2023, 44, 36.
  60. Neidhardt, M.; Bengs, M.; Latus, S.; Schlüter, M.; Saathoff, T.; Schlaefer, A. 4D deep learning for real-time volumetric optical coherence elastography. Int. J. Comput. Assist. Radiol. Surg. 2021, 16, 23–27.
  61. Carr, J.A.; Franke, D.; Caram, J.R.; Perkinson, C.F.; Saif, M.; Askoxylakis, V.; Datta, M.; Fukumura, D.; Jain, R.K.; Bawendi, M.G.; et al. Shortwave infrared fluorescence imaging with the clinically approved near-infrared dye indocyanine green. Proc. Natl. Acad. Sci. USA 2018, 115, 4465–4470.
  62. Ma, Z.; Wang, F.; Wang, W.; Zhong, Y.; Dai, H. Deep learning for in vivo near-infrared imaging. Proc. Natl. Acad. Sci. USA 2021, 118, e2021446118.
  63. Cao, C.; Xiao, A.; Cai, M.; Shen, B.; Guo, L.; Shi, X.; Tian, J.; Hu, Z. Excitation-based fully connected network for precise NIR-II fluorescence molecular tomography. Biomed. Opt. Express 2022, 13, 6284–6299.
  64. Chen, R.; Peng, S.; Zhu, L.; Meng, J.; Fan, X.; Feng, Z.; Zhang, H.; Qian, J. Enhancing Total Optical Throughput of Microscopy with Deep Learning for Intravital Observation. Small Methods 2023, 7, 2300172.
  65. Lee, W.; Nam, H.S.; Seok, J.Y.; Oh, W.Y.; Kim, J.W.; Yoo, H. Deep learning-based image enhancement in optical coherence tomography by exploiting interference fringe. Commun. Biol. 2023, 6, 464.
  66. Wu, R.; Huang, S.; Zhong, J.; Li, M.; Zheng, F.; Bo, E.; Liu, L.; Liu, Y.; Ge, X.; Ni, G. MAS-Net OCT: A deep-learning-based speckle-free multiple aperture synthetic optical coherence tomography. Biomed. Opt. Express 2023, 14, 2591–2607.
  67. Dong, Z.; Liu, G.; Ni, G.; Jerwick, J.; Duan, L.; Zhou, C. Optical coherence tomography image denoising using a generative adversarial network with speckle modulation. J. Biophotonics 2020, 13, e201960135.
  68. Shi, F.; Cai, N.; Gu, Y.; Hu, D.; Ma, Y.; Chen, Y.; Chen, X. DeSpecNet: A CNN-based method for speckle reduction in retinal optical coherence tomography images. Phys. Med. Biol. 2019, 64, 175010.
  69. Ma, Y.; Chen, X.; Zhu, W.; Cheng, X.; Xiang, D.; Shi, F. Speckle noise reduction in optical coherence tomography images based on edge-sensitive cGAN. Biomed. Opt. Express 2018, 9, 5129–5146.
  70. Yuan, Z.; Yang, D.; Yang, Z.; Zhao, J.; Liang, Y. Digital refocusing based on deep learning in optical coherence tomography. Biomed. Opt. Express 2022, 13, 3005–3020.
  71. Zhang, Z.; Li, H.; Lv, G.; Zhou, H.; Feng, H.; Xu, Z.; Li, Q.; Jiang, T.; Chen, Y. Deep learning-based image reconstruction for photonic integrated interferometric imaging. Opt. Express 2022, 30, 41359–41373.
  72. Zhang, Y.; Liu, T.; Singh, M.; Çetintaş, E.; Luo, Y.; Rivenson, Y.; Larin, K.V.; Ozcan, A. Neural network-based image reconstruction in swept-source optical coherence tomography using undersampled spectral data. Light. Sci. Appl. 2021, 10, 155.
  73. Ahmed, S.; Le, D.; Son, T.; Adejumo, T.; Ma, G.; Yao, X. ADC-net: An open-source deep learning network for automated dispersion compensation in optical coherence tomography. Front. Med. 2022, 9, 864879.
  74. Gao, M.; Guo, Y.; Hormel, T.T.; Sun, J.; Hwang, T.S.; Jia, Y. Reconstruction of high-resolution 6 × 6-mm OCT angiograms using deep learning. Biomed. Opt. Express 2020, 11, 3585–3600.
  75. Salimi, M. Advanced Photothermal Optical Coherence Tomography (PT-OCT) for Quantification of Tissue Composition. Ph.D. Thesis, York University, Toronto, ON, Canada, 2022.
  76. Sun, Y.; Wang, J.; Shi, J.; Boppart, S.A. Synthetic polarization-sensitive optical coherence tomography by deep learning. NPJ Digit. Med. 2021, 4, 105.
  77. Kashani, R.G.; Młyńczak, M.C.; Zarabanda, D.; Solis-Pazmino, P.; Huland, D.M.; Ahmad, I.N.; Singh, S.P.; Valdez, T.A. Shortwave infrared otoscopy for diagnosis of middle ear effusions: A machine-learning-based approach. Sci. Rep. 2021, 11, 12509.
More
Information
Contributors MDPI registered users' name will be linked to their SciProfiles pages. To register with us, please refer to https://encyclopedia.pub/register : , , ,
View Times: 138
Revisions: 2 times (View History)
Update Date: 10 Jan 2024
1000/1000
Video Production Service