Your browser does not fully support modern features. Please upgrade for a smoother experience.
Submitted Successfully!
 +1 credit
Thank you for your contribution! You can also upload a video entry or images related to this topic.
For video creation, please contact our Academic Video Service.
| Version | Summary | Created by | Modification | Content Size | Created at | Operation |
|---|---|---|---|---|---|---|
| 1 | Nicola Marsden | -- | 3890 | 2024-01-07 07:20:00 | | | |
| 2 | Nicola Marsden | -2 word(s) | 3888 | 2024-01-07 07:25:05 | | | | |
| 3 | Camila Xu | Meta information modification | 3888 | 2024-01-09 02:21:50 | | |
Video Upload Options
We provide professional Academic Video Service to translate complex research into visually appealing presentations. Would you like to try it?
Cite
If you have any further questions, please contact Encyclopedia Editorial Office.
Marsden, N.; Pröbster, M. The Social Perception of Autonomous Delivery Vehicles. Encyclopedia. Available online: https://encyclopedia.pub/entry/53514 (accessed on 27 July 2026).
Marsden N, Pröbster M. The Social Perception of Autonomous Delivery Vehicles. Encyclopedia. Available at: https://encyclopedia.pub/entry/53514. Accessed July 27, 2026.
Marsden, Nicola, Monika Pröbster. "The Social Perception of Autonomous Delivery Vehicles" Encyclopedia, https://encyclopedia.pub/entry/53514 (accessed July 27, 2026).
Marsden, N., & Pröbster, M. (2024, January 07). The Social Perception of Autonomous Delivery Vehicles. In Encyclopedia. https://encyclopedia.pub/entry/53514
Marsden, Nicola and Monika Pröbster. "The Social Perception of Autonomous Delivery Vehicles." Encyclopedia. Web. 07 January, 2024.
Copy Citation
The use of different technologies significantly changes the social perception of different social groups, and moreover, devices themselves are perceived in stereotypical terms. Autonomous delivery vehicles (ADV) are electric and self-driving ground vehicles, which drive on streets or sidewalks with a limited speed of 5–10 km/h and are able to manage all driving tasks by themselves without human intervention in a mixed traffic environment
social perception
autonomous vehicles
last-mile delivery
stereotypes
1. Introduction
Emerging technologies diffuse into all areas of life, and technology use is increasingly taking place in social settings—whether at work, in private, or in public spaces—making the social acceptability of technological devices crucial for adoption [1]. In 1994, Nielsen named social acceptability as an essential part of system acceptability [2]. For a long time, however, research in human–computer interaction focused mainly on subjects like usability and user experience [1], and conceptualizations of the social acceptability of technology are still rare (see [3] for a review, also [1][4]). Insufficient social acceptability of a technological device can have a number of devastating effects on users, including negative self- and external image [5], the risk of stigmatization, misperception, and negative judgment from others [3][4][6][7][8][9][10]. Especially in public spaces, the social acceptability of technological devices thus needs to be considered. Studies have investigated the social acceptability of technology usage in a number of different contexts and situations, for example for the use of mobile devices [4][11][12], data glasses [7][13], or head-mounted displays [9][10][14][15] and for specific interaction modes such as gestures (for an overview see [3]). A considerable number of these studies found a link between the social acceptability of technologies and the perception of different user groups, e.g., that devices are more accepted if they assist people with a disability [14]. The use of different technologies significantly changes the social perception of different social groups, and moreover, devices themselves are perceived in stereotypical terms [4]. Prior research that assessed the perceptions of different technological devices like tablets, VR headsets, or quadcopters, in conjunction with different user groups, used the Stereotype Content Model (SCM) [16][17] to explain the social acceptability of devices for different user groups.
2. Social Acceptability of Technological Devices
Generally speaking, social acceptability is defined as “the absence of social disapproval” by the APA Dictionary of Psychology [18]. This definition by negation is also adapted by Kelly and Gilbert, who developed the WEAR Scale to measure the social acceptability of a wearable device and suppose that “a socially acceptable wearable is most notably marked by an absence of negative reactions or judgments from others”. This absence of fear needs to be accompanied by the fulfillment of aspirational desires to account for the social acceptability of a wearable device [12].
Moreover, social acceptability is construed as a reciprocal and contextual rather than an isolated process. According to Goffman’s theory of impression management, asserting that all public action is a performance, people cultivate their identity not only for themselves but present themselves to others by adapting the roles of performers for the spectators [5]. This duality of social acceptance was described by Montero et al. [19], who defined social acceptance on two dimensions: (a) the user’s social acceptance, an internal effect of the interaction that defines the user’s subjective impression; and (b) the spectator’s social acceptance, an external effect of the user’s interactions. In their study on the social acceptance of gestures, the spectators’ perceptions of others depended on their ability to interpret the performers’ device manipulations. This duality between the users (performers) and others in their vicinity (spectators) is present throughout a large number of previous works [7][20][21][22]. These findings underline the importance of social, reciprocal perceptions regarding the social acceptability of technologies and devices.
The widely used Technology Acceptance Model (TAM) describes the adoption of new technologies by individuals as influenced through two main factors: perceived usefulness (PU) and perceived ease-of-use (PEOU) [23]. The growing awareness of the importance of social factors when considering technology acceptance led to the creation of derivate models of the TAM (e.g., UTAUT), featuring subjective norms and social influence [24][25]. However, they only account for positive social influences, i.e., feedback encouraging the interaction because “an individual perceives that important others believe he or she should use the new system” ([26], p. 451), and the TAM/UTAUT does not take the perception of others who use a technology into consideration. Yet the perception of others who use a technology is crucial to understanding not only the acceptance, but the acceptability of a technology, which as a reciprocal process relies on the anticipation of other people’s approval or disapproval. As such, social acceptability of technology has been shown to highly correlate with ratings of the dimensions of the Stereotype Content Model [4][11] and, thus, the SCM has been validated as a method to assess social acceptability in technologies [27].
3. Social Perception of Devices and Their Connection to Different User Groups
A substantial number of studies indicate that the perceived social acceptability of a device also depends on who is using it. Profita et al. assessed the perceived social acceptability of head-mounted displays and discovered that the use was considered more socially acceptable if the device was being used to assist a person with a disability [14]. Rico and Brewster conducted a study on the social acceptability of gestures for mobile interfaces [28]. The authors, featuring strangers, colleagues, friends, family, and partners as potential users, suggested that the social acceptability increases with the familiarity of the audience. Schwind et al. showed that the acceptance of consumer-grade VR glasses depended on the situation and the number of people in the context of the user [10]. Moreover, bystanders, who express privacy concerns, reduce the social acceptance of devices with built-in cameras, such as life-logging cameras or smart glasses, as shown in works by Koelle et al. and Wolf et al. [7][13]. Subsequentially, the presence and reactions of others can have substantial effects on the users themselves, who then may feel uncomfortable and embarrassed and less willing to use the device [29][30].
Altogether, the perception and social acceptability of devices and interaction techniques depends on the perception of the user groups and their social contexts. Research has shown that social acceptability is higher if a technology supports a person with physical disabilities [14], indicating that the perception of certain groups that use a technology and the perception of this technology are intertwined. Accordingly, as perceptions of other people are influenced by stereotypes, it needs to be considered how these stereotypes may change the social perceptions of a device systematically.
4. Stereotypes
Researchers' perception of other people usually happens intuitively and largely automatically, i.e., without conscious effort [31][32][33]. These perceptions are—at least partially—informed by stereotypes. A stereotype is a simplification of a complex social reality; it comprises knowledge and assumptions about the attributes and behavior of people [34]. Stereotypical notions can be activated by implicit associations [34]. This way, stereotypes can influence our social perception and our behavior, even without our awareness [35][36]. While stereotypes are socio-cognitive knowledge structures that each person carries within themselves, they are also socially shared, created, and recreated through social situations. This dual structure of stereotypes leads to a continuous validation through consensus, leading to an asserted knowledge of a social group that is perpetuated in every act of repetition [37].
5. The Stereotype Content Model
Regarding the content of stereotypes, there are two basic dimensions that systematically organize people’s perception of others and thus help them navigate the social world: the assessment of someone’s warmth and competence [38][39]. The Stereotype Content Model (SCM) is a central framework in social psychology, linking these two dimensions to the human disposition to assess someone’s intent to either harm or help them [17][40][41]. The dimension “warmth” refers to how benign and likeable members of a certain group are perceived, thus evaluating what the person’s intent might be and whether they have positive or negative intentions toward oneself. The dimension “competence” describes how able and independent someone is considered, thus evaluating how effectively a person can pursue their intentions and how capable they are to either benefit or harm oneself. The SCM offers a framework to explain how the perception regarding these two dimensions elicits distinct patterns of affective and behavioral responses [38][40]. High ratings on both the warmth and the competence dimensions are usually reserved for one’s ingroup (i.e., the group oneself feels part of) and groups that are generally highly admired in a society. Notably, perception of outgroups is frequently not generally negative, but ambivalent, with high values on one dimension and low values on the other dimension [16][41]. One example for such ambivalent stereotypical perceptions are “rich people” or “business women”, which are perceived as cold but competent and are consequently envied, whereas other groups such as housewives, the elderly, and people with disabilities are perceived as warm, but incompetent and are pitied [38][41]. Cold and incompetent groups (e.g., homeless people) are despised, and warm and competent groups (usually one’s own ingroup) are admired. This positive assessment of the ingroup is called “ingroup favoritism”. Typically, groups that are classified similarly on these dimensions, i.e., are from the same cluster, elicit similar emotional and behavioral responses [16]. To sum it up, according to the SCM, the stereotypical status of a social group is predicted by four competence–warmth combinations: paternalistic stereotypes (high warmth, low competence), admirable stereotypes (high warmth, high competence), contemptuous stereotypes (low warmth, low competence), or envious stereotypes (low warmth, high competence); see also Figure 1.
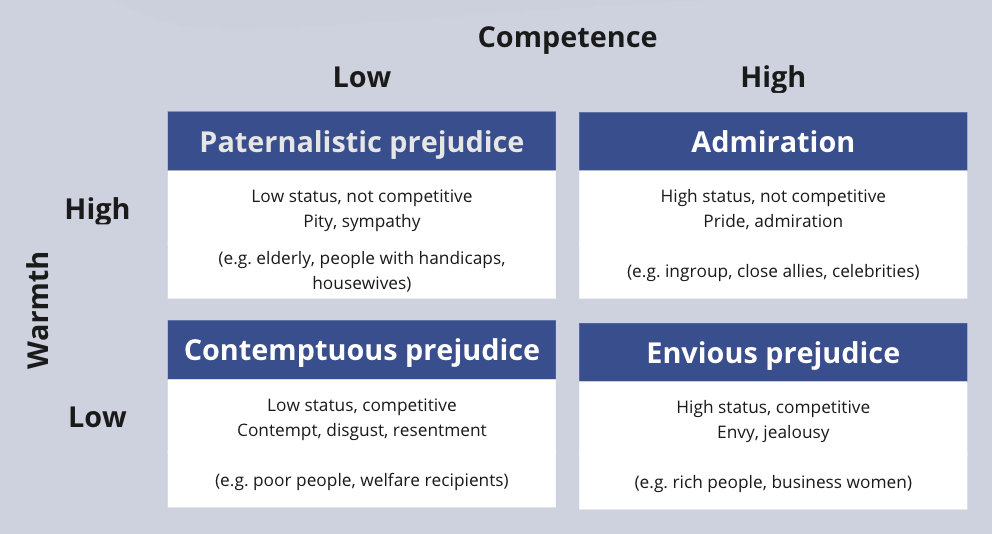
Figure 1. The Stereotype Content Model (SCM), figure adapted from Fiske et al. [41].
This pattern of uni- and ambivalent perception has been found to be remarkably stable across 19 different countries [38]. The SCM has been applied to various fields and found useful for understanding the mechanisms of racism [42], ageism [43], and sexism [44].
6. Gender as a Source of Stereotypes
Gender has been found to be a strong and prevalent source of stereotyping. In terms of the content of gender stereotypes, women are stereotypically perceived as warmer than men, but less competent [37][41][45][46][47][48][49]—a phenomenon that has been found to be interculturally stable [50]. Gender stereotypes tend to be constant over time [48][51][52]; however, recent research shows that the difference between men and women is getting smaller regarding the competence dimension and women are progressively seen as having the same level of competence as men [53][54][55]. Eagly and colleagues [56] refer to the analyses of public opinion polls in the US from 1946 to 2018, to show that women are increasingly seen as equally—or occasionally even more—competent than men. The different perception regarding the warmth dimension remains unchanged: women are still considered more communal and less agentic than men.
While there are overarching stereotypes for men and women, people distinguish between the stereotypic traits of several male and female subgroups [44][57][58]. For example, Wade and Brewer explored subgroups of women and found the “homemakers” and “business women” to be highly divergent in their stereotypical perception [59]. The participants of a recent study in Germany rated unemployed people as low in warmth and competence, thus denoting contemptuous stereotypes; pensioners were rated as medium in competence and warmth; and physicians received high ratings in both warmth and competence [60]. However, the perceptions of gender subgroups were not considered in this study. Various other studies referred to the SCM to explore occupational stereotypes (e.g., [61][62][63][64]), but only some of them consider gender subgroups. Yet when the gender of a person or group member is not explicitly specified or marked as “female”, usually a masculine mental representation of those group members is activated when reading a group name, in line with the findings of linguistic psychology (for overview see [65]). Thus, instead of measuring the perception of a seemingly “gender-neutral” group, participants are actually predominantly rating the group members of one gender only—which is the male one in most cases. Likewise, according to the model of intersectional invisibility [66], due to the ideologies of androcentrism, ethnocentrism, and heterosexism, the prototypical human is a man, the prototypical citizen (in a Western context) is white, and heterosexuality is prototypical of human sexuality. Members of subgroups are thus rendered invisible when they belong to two subordinate groups (e.g., ethnic minority women or ethnic minority gay men). These findings stress the importance of differentiating between subgroups when studying stereotypical group perception.
The perception of professions and gender are linked: several studies demonstrate (e.g., [67][68]) that healthcare professions such as social workers, psychologists, and nurses and jobs in education such as school and kindergarten teachers are linked to warmth traits, as women are considered to have more “social qualities” [37], whereas managerial and technical professions are not considered to require such traits. Men, on the other hand, are stereotypically perceived to possess better reasoning and technical skills than women; thus, industrial engineers or electrical apprentice are perceived as “masculine” [67][68][69].
Thus, the perception of these subgroups often reflects the combination of gender with other social roles such as parental or occupational status [47][49] or the intersection of gender with other social categories such as race/ethnicity and sexual orientation [70][71][72]. Bye [53] assessed and analyzed the stereotypical perceptions of men and women across gender subgroups. She discovered that even in contemporary Norway, women as well as men in care-giving roles are depicted as stereotypically warm but low in competence. On the other hand, women and men in traditional male roles (leaders, politicians, or business people) are perceived stereotypically competent and low in warmth. Women were usually viewed as warmer on a subgroup level, whereas competence ratings were inconsistent across different subgroups. These findings are in line with social role theory [49] and furthermore underline the importance of considering the intersection of different subgroups, to gain insights on how groups, in other words, people, are perceived.
Notably, gender stereotypes do not only have descriptive aspects (i.e., how members of a group are) but also have prescriptive aspects, i.e., what members of a group should be like [37]. Deviations of these prescriptive stereotypes can lead to rejection or punishments. Such social and economic sanctions for counter-stereotypical behavior are known as the backlash effect [73]. Referring to the SCM, this is also evident in the stereotypical perception of subgroups, e.g., that business women are perceived as more competent than the “average woman”, but cold(er), whereas businessmen are perceived as competent, but without the loss of warmth that business women receive [41]. Another example refers to working women, who, when they become mothers, usually trade in a gain in warmth for a loss in competence while this does not affect men who become fathers—the latter even gain in perceived warmth [45].
7. The SCM and the Perception of Technological Devices
As the SCM refers to deeply rooted mechanisms of human perception and inter-social behavior, it has been applied widely and considered helpful in understanding a range of phenomena in different fields, including the perception of nonhuman entities, such as brands and mobile devices. Previous studies demonstrate that consumers perceive brands in a similar way to how they perceive people, and they also feel and behave towards brands in ways that are comparable to their behaviors towards other people [74][75]. Even national stereotypes about a product’s country of origin can influence consumers’ expectations and willingness to buy a product [76]. The stereotypic perception of the “typical users” of a brand also seems to have an effect on people’s desire to buy and own a brand [77].
Frischknecht [78] refers to the SCM in her study on the general perception of autonomous technical systems. She suggests that increasing levels of technical autonomy change the attribution of competence and agency, while attributions of warmth and experience do not change under conditions of increasing technical autonomy.
A study by Hohenberger and colleagues [79] also found also a difference between women and men regarding their willingness to use autonomous vehicles related to their emotional responses to “automated cars”. Men were more likely to associate positive emotions, while women were more likely to associate negative emotions towards automated cars. However, their study was not related to ADV, but only to autonomous vehicles in general.
Beyond the influence of user groups, contextual factors of device use have also found to be influential regarding the perception of wearable devices in terms of the SCM. People differentiate between the placement of the device, particularly devices in the user’s hand, and activities in which the device can contextually be misused [27].
Schwind et al. [4] investigated if the principles of the Stereotype Content Model (SCM) can be applied to the perception of mobile devices. In a first study, they assessed various combinations of mobile devices and different group stereotypes and showed that the anticipated use of different mobile devices had a systematic effect on the perceptions of stereotypical warmth and competence of a range of social groups. Some devices, such as LED glasses or a life-logging camera, located nearly all groups into the contemptuous quadrant (low-warmth and low-competence). On the other hand, medical devices generally increased perceived warmth. However, not only did the strength of influence vary across devices (e.g., LED glasses, life-logging camera, and blood glucose sensors had stronger effects than VR or EEG headsets), but the effects also varied across different social groups. Senior citizens using devices that are usually seen as very competitive when associated with other groups (VR headsets or quadcopters) showed a higher influence of the device on perceived competence than on warmth.
The authors backed their assumption that different devices have their own location in the SCM, i.e., that a mobile device is recognized as a social object and perceived stereotypically by itself, in a second study, which measured the stereotypical perceptions of the different devices independently of a specific user group. Thus, Schwind et al.’s [4] combined findings support the notion that a systematic shift in the perception of warmth and competence occurs when people use a certain technological device as described by the SCM. Moreover, their results indicate that stereotypical perceptions of devices are not independent of the people that are its users (and vice versa) and the social acceptability of said devices depends on the assumed abilities of the user’s social group.
However, their study only focused on the perception of mobile devices (a specific, albeit heterogenous group) as social objects. Also, they did not differentiate between group members according to their gender when assessing the influence of different potential user groups. As pointed out above, gender is a highly prevalent source of stereotyping, and the perceptions of members of the same social or professional group often differ according to gender-related subgroup stereotypes: hence, gender may elicit very dissimilar, sometimes ambivalent stereotypes. Moreover, the present study aims to extend the previous findings regarding the stereotypical perception of devices to the perception of autonomous and self-steering vehicles and varying potential user groups within the framework of the SCM.
8. The Perception of Autonomous Delivery Vehicles
Autonomous and self-steering vehicles have been used in pilot projects for years (e.g., [80][81]) and they are likely to become common in real-world settings [82]. Their potential to reduce emissions and increase safety in urban areas is considered to be tremendous, but their use is also controversial, e.g., because of ethical concerns [83][84][85][86]. Most previous studies so far focused on the acceptance on AVs in general, often for human passengers, e.g., autonomous cars or shuttles (see [87] for a review on shuttles); see also [88][89][90]. However, it needs to be considered that the perceptions of vehicles used for the transportation of people may differ from the perception of those used for the transportation of goods, as the involvement of people as passengers could influence the perceptions of the vehicles (e.g., safety concerns), and ways of use are different (e.g., shared use in a neighborhood vs. private use). Likewise, the context and the assumed activities may influence the perceptions ([27]).
Autonomous delivery vehicles (ADV) are electric and self-driving ground vehicles, which drive on streets or sidewalks with a limited speed of 5–10 km/h and are able to manage all driving tasks by themselves without human intervention in a mixed traffic environment. [80]. They are equipped with space for the transportation of various sensors, cameras, and GPS tracking and can be used to deliver goods such as groceries and parcels directly to the doorstep (last-mile logistics). Unlike conventional delivery methods, the interaction is based on a human–technology interface (i.e., mobile, so no human–human interaction is involved during the final drop-off [80]. They are still in the trial phase and mainly used in pilot projects, e.g., in Germany/Heilbronn [80], Düsseldorf, and Hamburg. ADV are believed to have the potential to revolutionize last-mile delivery in a way that is more sustainable and customer-focused, but only if they are widely accepted [91]. However, the research on the acceptance of ADV is still in its beginnings [80][92][93].
Marsden et al. [80] assessed the attitudes towards ADV and found that ADV were generally seen as rather “innovative”, “environmentally friendly”, and “interesting”, but men in general showed slightly more positive attitudes (and slightly less negatives ones) towards ADV and also indicated a stronger wish to use them than women. Moreover, some safety concerns were expressed; however, participants rather disagreed with the suggestion of “dangerous”, “uncanny”, and “senseless” ADV. Additionally, ADV were considered to be rather well-suited for people with physical constraints and least suited for older people.
Kapser and Abdelraham [94] applied the Unified Theory of Acceptance and Use of Technology (UTAUT) to investigate the user acceptance of ADV in the context of last-mile delivery. In their study, performance expectancy has been found to be the most important variable, followed by social influence, whereas no effect could be found for effort expectancy. In the following, Kapser and Abdelraham [92] employed an extended Unified Theory of Acceptance and Use of Technology (UTAUT2) and adapted it to the context of ADV in last-mile delivery including risk perceptions. They found price sensitivity is the strongest predictor of behavioral intention (i.e., user acceptance), followed by performance expectancy, hedonic motivation, perceived risk, social influence, and facilitating conditions, whereas no effect could be found for effort expectancy. Further on, they extended the model (UTAUT2) in another study which served to empirically verify previous assumptions of their models and included gender as a moderator variable [91]. Their results indicate that trust in technology, price sensitivity, innovativeness, performance expectancy, hedonic motivation, social influence, and perceived risk determine behavioral intention. However, no significant effect of social influence, hedonic motivation, and perceived risk on behavioral intention could be found for men—these were only relevant for women. Notably, on average, the participants showed a rather “neutral” attitude towards ADV, which indicated that they have not yet formed a strong opinion on ADV. Pani and colleagues [93] conducted a study on the public acceptance of autonomous delivery robots (which are, in essence, similar to ADV) during the COVID-19 epidemic. They offer a detailed analysis of consumer preferences, trust, attitudes, and willingness to pay (WTP); however, their study focused on marketing aspects and different buying habits and attitudes.
While these findings offer many insights on the attitudes towards autonomous vehicles and their social acceptability, the results are sometimes fragmentary or inconsistent and integrated in several different frameworks. Some of the mentioned concepts, such as “trust” in autonomous vehicles [95], also relate to the SCM. Gender differences have been argued to play a crucial role in technology acceptance research [25][26], but were often not considered. Many of the mentioned studies also did not consider the influence of the social context, e.g., (other) users and their perceived stereotypes, including gender, on the perceptions and acceptance of a technological device.
References
- Koelle, M.; Boll, S.; Olsson, T.; Williamson, J.; Profita, H.; Kane, S.; Mitchell, R. (Un) Acceptable!?! Re-thinking the Social Acceptability of Emerging Technologies. In Proceedings of the Extended Abstracts of the 2018 CHI Conference on Human Factors in Computing Systems, Montreal, QC, Canada, 21–26 April 2018; pp. 1–8.
- Nielsen, J. Usability Engineering; Elsevier: Amsterdam, The Netherlands, 1994.
- Koelle, M.; Ananthanarayan, S.; Boll, S. Social acceptability in HCI: A survey of methods, measures, and design strategies. In Proceedings of the 2020 CHI Conference on Human Factors in Computing Systems, Honolulu, HI, USA, 25–30 April 2020; pp. 1–19.
- Schwind, V.; Deierlein, N.; Poguntke, R.; Henze, N. Understanding the Social Acceptability of Mobile Devices Using the Stereotype Content Model. In Proceedings of the 2019 CHI Conference on Human Factors in Computing Systems, Glasgow, UK, 4–9 May 2019; pp. 1–12.
- Goffman, E. The Presentation of Self in Everyday Life; Doubleday: Garden City, NY, USA, 1959.
- Shinohara, K.; Wobbrock, J.O. In the shadow of misperception: Assistive technology use and social interactions. In Proceedings of the SIGCHI Conference on Human Factors in Computing Systems, Vancouver, BC, Canada, 7–12 May 2011; pp. 705–714.
- Koelle, M.; Kranz, M.; Möller, A. Don’t look at me that way! understanding user attitudes towards data glasses usage. In Proceedings of the 17th International Conference on Human-Computer Interaction with Mobile Devices and Services, Copenhagen, Denmark, 24–27 August 2015; pp. 362–372.
- Koelle, M.; El Ali, A.; Cobus, V.; Heuten, W.; Boll, S.C. All about acceptability? Identifying factors for the adoption of data glasses. In Proceedings of the 2017 CHI Conference on Human Factors in Computing Systems, Denver, CO USA, 6–11 May 2017; pp. 295–300.
- Profita, H.P. Designing wearable computing technology for acceptability and accessibility. SIGACCESS Access. Comput. 2016, 114, 44–48.
- Schwind, V.; Reinhardt, J.; Rzayev, R.; Henze, N.; Wolf, K. Virtual reality on the go? A study on social acceptance of vr glasses. In Proceedings of the 20th International Conference on Human-Computer Interaction with Mobile Devices and Services Adjunct, Barcelona, Spain, 3–6 September 2018; pp. 111–118.
- Schwind, V.; Henze, N. Anticipated User Stereotypes Systematically Affect the Social Acceptability of Mobile Devices. In Proceedings of the 11th Nordic Conference on Human-Computer Interaction: Shaping Experiences, Shaping Society, Tallinn, Estonia, 25–29 October 2020; pp. 1–12.
- Kelly, N.; Gilbert, S. The WEAR scale: Developing a measure of the social acceptability of a wearable device. In Proceedings of the 2016 CHI Conference Extended Abstracts on Human Factors in Computing Systems, San Jose, CA, USA, 7–12 May 2016; pp. 2864–2871.
- Wolf, K.; Schmidt, A.; Bexheti, A.; Langheinrich, M. Lifelogging: You’re wearing a camera? IEEE Pervasive Comput. 2014, 13, 8–12.
- Profita, H.; Albaghli, R.; Findlater, L.; Jaeger, P.; Kane, S.K. The AT effect: How disability affects the perceived social acceptability of head-mounted display use. In Proceedings of the 2016 CHI Conference on Human Factors in Computing Systems, San Jose, CA, USA, 7–12 May 2016; pp. 4884–4895.
- Pohl, D.; de Tejada Quemada, C.F. See what I see: Concepts to improve the social acceptance of HMDs. In Proceedings of the 2016 IEEE Virtual Reality (VR), Greenville, SC, USA, 9–23 March 2016; pp. 267–268.
- Cuddy, A.J.; Fiske, S.T.; Glick, P. The BIAS map: Behaviors from intergroup affect and stereotypes. J. Pers. Soc. Psychol. 2007, 92, 631.
- Fiske, S.T.; Xu, J.; Cuddy, A.C.; Glick, P. (Dis) respecting versus (dis) liking: Status and interdependence predict ambivalent stereotypes of competence and warmth. J. Soc. Issues 1999, 55, 473–489.
- VandenBos, G.R. APA Dictionary of Psychology; American Psychological Association: Washington, DC, USA, 2007.
- Montero, C.S.; Alexander, J.; Marshall, M.T.; Subramanian, S. Would you do that? Understanding social acceptance of gestural interfaces. In Proceedings of the 12th International Conference on Human Computer Interaction with Mobile Devices and Services, Lisbon, Portugal, 7–10 September 2010; pp. 275–278.
- Avila Soto, M.; Funk, M. Look, a guidance drone! assessing the social acceptability of companion drones for blind travelers in public spaces. In Proceedings of the 20th International ACM SIGACCESS Conference on Computers and Accessibility, Galway, Ireland, 22–24 October 2018; pp. 417–419.
- Taniberg, A.; Botin, L.; Stec, K. Context of use affects the social acceptability of gesture interaction. In Proceedings of the 10th Nordic Conference on Human-Computer Interaction, Oslo, Norway, 29 September–3 October 2018; pp. 731–735.
- Alallah, F.; Neshati, A.; Sakamoto, Y.; Hasan, K.; Lank, E.; Bunt, A.; Irani, P. Performer vs. observer: Whose comfort level should we consider when examining the social acceptability of input modalities for head-worn display? In Proceedings of the 24th ACM Symposium on Virtual Reality Software and Technology, Tokyo, Japan, 28 November–1 December 2018; pp. 1–9.
- Davis, F.D. A Technology Acceptance Model for Empirically Testing New End-User Information Systems: Theory and Results. Ph.D. Thesis, Massachusetts Institute of Technology, Cambridge, MA, USA, 1985.
- Malhotra, Y.; Galletta, D.F. Extending the technology acceptance model to account for social influence: Theoretical bases and empirical validation. In Proceedings of the 32nd Annual Hawaii International Conference on Systems Sciences, Maui, HI, USA, 5–8 January 1999; p. 14.
- Venkatesh, V.; Morris, M.G. Why don’t men ever stop to ask for directions? Gender, social influence, and their role in technology acceptance and usage behavior. MIS Q. 2000, 24, 115–139.
- Venkatesh, V.; Morris, M.G.; Davis, G.B.; Davis, F.D. User acceptance of information technology: Toward a unified view. MIS Q. 2003, 27, 425–478.
- Sehrt, J.; Braams, B.; Henze, N.; Schwind, V. Social Acceptability in Context: Stereotypical Perception of Shape, Body Location, and Usage of Wearable Devices. Big Data Cogn. Comput. 2022, 6, 100.
- Rico, J.; Brewster, S. Usable gestures for mobile interfaces: Evaluating social acceptability. In Proceedings of the SIGCHI Conference on Human Factors in Computing Systems, Atlanta, GA, USA, 10–15 April 2010; pp. 887–896.
- Hsieh, Y.-T.; Jylhä, A.; Orso, V.; Gamberini, L.; Jacucci, G. Designing a willing-to-use-in-public hand gestural interaction technique for smart glasses. In Proceedings of the 2016 CHI Conference on Human Factors in Computing Systems, San Jose, CA, USA, 7–12 May 2016; pp. 4203–4215.
- Lucero, A.; Vetek, A. NotifEye: Using interactive glasses to deal with notifications while walking in public. In Proceedings of the 11th Conference on Advances in Computer Entertainment Technology, Funchal, Portugal, 11–14 November 2014; pp. 1–10.
- Bargh, J.A. Social Psychology and the Unconscious: The Automaticity of Higher Mental Processes; Psychology Press: New York, NY, USA, 2013.
- Banaji, M.R.; Bhaskar, R.; Brownstein, M. When bias is implicit, how might we think about repairing harm? Curr. Opin. Psychol. 2015, 6, 183–188.
- Higgins, E.T. Knowledge activation: Accessibility, applicability, and salience. In Social Psychology: Handbook of Basic Principles; Higgins, E.T., Kruglanski, A., Eds.; Guilford Press: New York, NY, USA, 1996; pp. 133–168.
- Greenwald, A.G.; McGhee, D.E.; Schwartz, J.L. Measuring individual differences in implicit cognition: The implicit association test. J. Pers. Soc. Psychol. 1998, 74, 1464–1480.
- Fiske, S.T. Stereotyping, prejudice, and discrimination at the seam between the centuries: Evolution, culture, mind, and brain. Eur. J. Soc. Psychol. 2000, 30, 299–322.
- Banaji, M.R.; Hardin, C.D. Automatic stereotyping. Psychol. Sci. 1996, 7, 136–141.
- Eckes, T. Geschlechterstereotype: Von Rollen, Identitäten und Vorurteilen. In Handbuch Frauen- und Geschlechterforschung; Becker, R., Kortendiek, B., Eds.; VS Verlag für Sozialwissenschaften: Wiesbaden, Germany, 2008; pp. 171–182.
- Fiske, S.; Cuddy, A.; Glick, P. Universal dimensions of social cognition: Warmth and competence. Trends Cogn. Sci. 2007, 11, 77–83.
- Abele, A.E.; Ellemers, N.; Fiske, S.T.; Koch, A.; Yzerbyt, V. Navigating the social world: Toward an integrated framework for evaluating self, individuals, and groups. Psychol. Rev. 2021, 128, 290–314.
- Cuddy, A.; Fiske, S.; Glick, P. Warmth and competence as universal dimensions of social perception: The stereotype content model and the BIAS map. Adv. Exp. Soc. Psychol. 2008, 40, 61–149.
- Fiske, S.; Cuddy, A.; Glick, P.; Xu, J. A model of (often mixed) stereotype content: Competence and warmth respectively follow from perceived status and competition. J. Pers. Soc. Psychol. 2002, 82, 878–902.
- Lin, M.H.; Kwan, V.S.; Cheung, A.; Fiske, S.T. Stereotype content model explains prejudice for an envied outgroup: Scale of anti-Asian American stereotypes. Personal. Soc. Psychol. Bull. 2005, 31, 34–47.
- Cuddy, A.J.; Fiske, S.T. Doddering but dear: Process, content, and function in stereotyping of older persons. Ageism Stereotyping Prejud. Against Older Pers. 2002, 3, 26.
- Eckes, T. Paternalistic and Envious Gender Stereotypes: Testing Predictions from the Stereotype Content Model. Sex Roles 2002, 47, 99–114.
- Cuddy, A.J.; Fiske, S.T.; Glick, P. When professionals become mothers, warmth doesn’t cut the ice. J. Soc. Issues 2004, 60, 701–718.
- Glick, P.; Diebold, J.; Bailey-Werner, B.; Zhu, L. The Two Faces of Adam: Ambivalent Sexism and Polarized Attitudes Toward Women. Pers. Soc. Psychol. Bull. 1997, 23, 1323–1334.
- Wood, W.; Eagly, A.H. Biosocial construction of sex differences and similarities in behavior. Adv. Exp. Soc. Psychol. 2012, 46, 55–123.
- Ellemers, N. Gender stereotypes. Annu. Rev. Psychol. 2018, 69, 275–298.
- Eagly, A.H.; Wood, W. Social role theory. In Handbook of Theories of Social Psychology; SAGE: Thousand Oaks, CA, USA, 2012; Volume 2.
- Cuddy, A.; Fiske, S.; Kwan, V.; Glick, P.; Demoulin, S.; Leyens, J.P.; Bond, M.H.; Croizet, J.C.; Ellemers, N.; Sleebos, E. Stereotype content model across cultures: Towards universal similarities and some differences. Br. J. Soc. Psychol. 2009, 48, 1–33.
- Moscatelli, S.; Menegatti, M.; Ellemers, N.; Mariani, M.G.; Rubini, M. Men should be competent, women should have it all: Multiple criteria in the evaluation of female job candidates. Sex Roles 2020, 83, 269–288.
- Haines, E.L.; Deaux, K.; Lofaro, N. The times they are a-changing… or are they not? A comparison of gender stereotypes, 1983–2014. Psychol. Women Q. 2016, 40, 353–363.
- Bye, H.H.; Solianik, V.V.; Five, M.; Agai, M.S. Stereotypes of Women and Men Across Gender Subgroups. Front. Psychol. 2022, 13, 881418.
- Diekman, A.B.; Eagly, A.H. Stereotypes as dynamic constructs: Women and men of the past, present, and future. Pers. Soc. Psychol. Bull. 2000, 26, 1171–1188.
- Gustafsson Sendén, M.; Klysing, A.; Lindqvist, A.; Renström, E.A. The (not so) changing man: Dynamic gender stereotypes in Sweden. Front. Psychol. 2019, 10, 37.
- Eagly, A.H.; Nater, C.; Miller, D.I.; Kaufmann, M.; Sczesny, S. Gender stereotypes have changed: A cross-temporal meta-analysis of US public opinion polls from 1946 to 2018. Am. Psychol. 2020, 75, 301–315.
- Athenstaedt, U.; Heinzle, C.; Lerchbaumer, G. Gender subgroup self-categorization and gender role self-concept. Sex Roles 2008, 58, 266–278.
- Eckes, T. Features of men, features of women: Assessing stereotypic beliefs about gender subtypes. Br. J. Soc. Psychol. 1994, 33, 107–123.
- Wade, M.L.; Brewer, M.B. The structure of female subgroups: An exploration of ambivalent stereotypes. Sex Roles 2006, 54, 753–765.
- Friehs, M.T.; Aparicio Lukassowitz, F.; Wagner, U. Stereotype content of occupational groups in Germany. J. Appl. Soc. Psychol. 2022, 52, 459–475.
- Fiske, S.T.; Durante, F. Never trust a politician? Collective distrust, relational accountability, and voter response. In Power, Politics, and Paranoia: Why People Are Suspicious of Their Leaders; Cambridge University Press: Cambridge, MA, USA, 2014; pp. 91–105.
- Fiske, S.T.; Dupree, C. Gaining trust as well as respect in communicating to motivated audiences about science topics. Proc. Natl. Acad. Sci. USA 2014, 111, 13593–13597.
- Strinić, A.; Carlsson, M.; Agerström, J. Occupational stereotypes: Professionals warmth and competence perceptions of occupations. Pers. Rev. 2021, 51, 603–619.
- He, J.C.; Kang, S.K.; Tse, K.; Toh, S.M. Stereotypes at work: Occupational stereotypes predict race and gender segregation in the workforce. J. Vocat. Behav. 2019, 115, 103318.
- Irmen, L.; Linner, U. Die Repräsentation generisch maskuliner Personenbezeichnungen. J. Psychol. 2005, 213, 167–175.
- Purdie-Vaughns, V.; Eibach, R.P. Intersectional invisibility: The distinctive advantages and disadvantages of multiple subordinate-group identities. Sex Roles 2008, 59, 377–391.
- Glick, P. Trait-based and sex-based discrimination in occupational prestige, occupational salary, and hiring. Sex Roles 1991, 25, 351–378.
- Glick, P.; Wilk, K.; Perreault, M. Images of occupations: Components of gender and status in occupational stereotypes. Sex Roles 1995, 32, 565–582.
- White, M.J.; White, G.B. Implicit and explicit occupational gender stereotypes. Sex Roles 2006, 55, 259–266.
- Ghavami, N.; Peplau, L.A. An intersectional analysis of gender and ethnic stereotypes: Testing three hypotheses. Psychol. Women Q. 2013, 37, 113–127.
- Kang, S.K.; Bodenhausen, G.V. Multiple identities in social perception and interaction: Challenges and opportunities. Annu. Rev. Psychol. 2015, 66, 547–574.
- Klysing, A.; Lindqvist, A.; Björklund, F. Stereotype content at the intersection of gender and sexual orientation. Front. Psychol. 2021, 12, 713839.
- Rudman, L.A. Self-promotion as a risk factor for women: The costs and benefits of counterstereotypical impression management. J. Pers. Soc. Psychol. 1998, 74, 629.
- Ivens, B.S.; Leischnig, A.; Muller, B.; Valta, K. On the role of brand stereotypes in shaping consumer response toward brands: An empirical examination of direct and mediating effects of warmth and competence. Psychol. Mark. 2015, 32, 808–820.
- Kervyn, N.; Fiske, S.T.; Malone, C. Brands as intentional agents framework: How perceived intentions and ability can map brand perception. J. Consum. Psychol. 2012, 22, 166–176.
- Chattalas, M.; Kramer, T.; Takada, H. The impact of national stereotypes on the country of origin effect: A conceptual framework. Int. Mark. Rev. 2008, 25, 54–74.
- Antonetti, P.; Maklan, S. Hippies, greenies, and tree huggers: How the “warmth” stereotype hinders the adoption of responsible brands. Psychol. Mark. 2016, 33, 796–813.
- Frischknecht, R. A social cognition perspective on autonomous technology. Comput. Hum. Behav. 2021, 122, 106815.
- Hohenberger, C.; Spörrle, M.; Welpe, I.M. How and why do men and women differ in their willingness to use automated cars? The influence of emotions across different age groups. Transp. Res. Part A Policy Pract. 2016, 94, 374–385.
- Marsden, N.; Bernecker, T.; Zöllner, R.; Sußmann, N.; Kapser, S. BUGA: Log–A real-world laboratory approach to designing an automated transport system for goods in Urban Areas. In Proceedings of the 2018 IEEE International Conference on Engineering, Technology and Innovation (ICE/ITMC), Stuttgart, Germany, 17–20 June 2018; pp. 1–9.
- Pettersson, I.; Karlsson, I.M. Setting the stage for autonomous cars: A pilot study of future autonomous driving experiences. IET Intell. Transp. Syst. 2015, 9, 694–701.
- Cohen, S.A.; Hopkins, D. Autonomous vehicles and the future of urban tourism. Ann. Tour. Res. 2019, 74, 33–42.
- Taeihagh, A.; Lim, H.S.M. Governing autonomous vehicles: Emerging responses for safety, liability, privacy, cybersecurity, and industry risks. Transp. Rev. 2019, 39, 103–128.
- Hevelke, A.; Nida-Rümelin, J. Responsibility for crashes of autonomous vehicles: An ethical analysis. Sci. Eng. Ethics 2015, 21, 619–630.
- Awad, E.; Levine, S.; Kleiman-Weiner, M.; Dsouza, S.; Tenenbaum, J.B.; Shariff, A.; Bonnefon, J.-F.; Rahwan, I. Blaming humans in autonomous vehicle accidents: Shared responsibility across levels of automation. arXiv 2018, arXiv:1803.07170.
- Lee, C.; Seppelt, B.; Reimer, B.; Mehler, B.; Coughlin, J.F. Acceptance of vehicle automation: Effects of demographic traits, technology experience and media exposure. Proc. Hum. Factors Ergon. Soc. Annu. Meet. 2019, 63, 2066–2070.
- Nordhoff, S.; de Winter, J.; Payre, W.; Van Arem, B.; Happee, R. What impressions do users have after a ride in an automated shuttle? An interview study. Transp. Res. Part F Traffic Psychol. Behav. 2019, 63, 252–269.
- Panagiotopoulos, I.; Dimitrakopoulos, G. An empirical investigation on consumers’ intentions towards autonomous driving. Transp. Res. Part C Emerg. Technol. 2018, 95, 773–784.
- Hegner, S.M.; Beldad, A.D.; Brunswick, G.J. In automatic we trust: Investigating the impact of trust, control, personality characteristics, and extrinsic and intrinsic motivations on the acceptance of autonomous vehicles. Int. J. Hum.–Comput. Interact. 2019, 35, 1769–1780.
- Park, E.; Lim, J.; Cho, Y. Understanding the emergence and social acceptance of electric vehicles as next-generation models for the automobile industry. Sustainability 2018, 10, 662.
- Kapser, S.; Abdelrahman, M.; Bernecker, T. Autonomous delivery vehicles to fight the spread of COVID-19–How do men and women differ in their acceptance? Transp. Res. Part A Policy Pract. 2021, 148, 183–198.
- Kapser, S.; Abdelrahman, M. Acceptance of autonomous delivery vehicles for last-mile delivery in Germany–Extending UTAUT2 with risk perceptions. Transp. Res. Part C Emerg. Technol. 2020, 111, 210–225.
- Pani, A.; Mishra, S.; Golias, M.; Figliozzi, M. Evaluating public acceptance of autonomous delivery robots during COVID-19 pandemic. Transp. Res. Part D Transp. Environ. 2020, 89, 102600.
- Kapser, S. User Acceptance of Autonomous Delivery Vehicles—An Empirical Study in Germany. Ph.D. Thesis, University of Northumbria at Newcastle, Newcastle, UK, 2019.
- Winter, K.; Wien, J.; Molin, E.; Cats, O.; Morsink, P.; Van Arem, B. Taking the self-driving bus: A passenger choice experiment. In Proceedings of the 2019 6th International Conference on Models and Technologies for Intelligent Transportation Systems (MT-ITS), Cracow, Poland, 5–7 June 2019; pp. 1–8.
More
Information
Subjects:
Psychology
Contributors
MDPI registered users' name will be linked to their SciProfiles pages. To register with us, please refer to https://encyclopedia.pub/register
:
View Times:
903
Revisions:
3 times
(View History)
Update Date:
09 Jan 2024
Table of Contents


Notice
You are not a member of the advisory board for this topic. If you want to update advisory board member profile, please contact office@encyclopedia.pub.
OK
Confirm
Only members of the Encyclopedia advisory board for this topic are allowed to note entries. Would you like to become an advisory board member of the Encyclopedia?
Yes
No
${ textCharacter }/${ maxCharacter }
Submit
Cancel
Back
Comments
${ item }
|
${ item.createdUser.fullName }
${ item.createdAt }
${ item.vote }
${ item.reply }
Delete
${ reply.createdUser.fullName }
${ reply.createdAt }
${ reply.vote }
Delete
There is no reply to this comment~
${ item.replyTextCharacter }/${ item.replyMaxCharacter }
Submit
Cancel
More
No more~
There is no comment~
${ textCharacter }/${ maxCharacter }
Submit
Cancel
${ selectedItem.replyTextCharacter }/${ selectedItem.replyMaxCharacter }
Submit
Cancel
Confirm
Are you sure to Delete?
Yes
No