 +1 credit
| Version | Summary | Created by | Modification | Content Size | Created at | Operation |
|---|---|---|---|---|---|---|
| 1 | Fatick Nath | -- | 2340 | 2023-12-04 23:27:54 | | | |
| 2 | Jessie Wu | Meta information modification | 2340 | 2023-12-05 04:12:50 | | | | |
| 3 | Jessie Wu | + 1 word(s) | 2341 | 2023-12-05 04:13:46 | | |
Video Upload Options
Oilfield produced water (PW) is the industry’s principal source of waste byproducts. Oil-producing countries, especially those with limited water resources, face significant difficulty in treating PW for recovery and reuse. Depending on its quality and content, PW can be treated using a variety of technologies. Numerous nations are currently undertaking substantial endeavors to ascertain efficacious and cost-effective treatment methodologies in order to rehabilitate their freshwater supplies. The compositions of pollutants play a major role in the selection of acceptable methods. According to the degree of contamination and the requirement for water quality, several treatment strategies can, therefore, be used. To successfully remove pollutants and/or lessen their detrimental effects on the environment, methods comprising physical, chemical, biological, and membrane treatments have been applied.
1. Overview of Produced Water in Oil and Gas Industry
2. Sustainable Produced Water Management
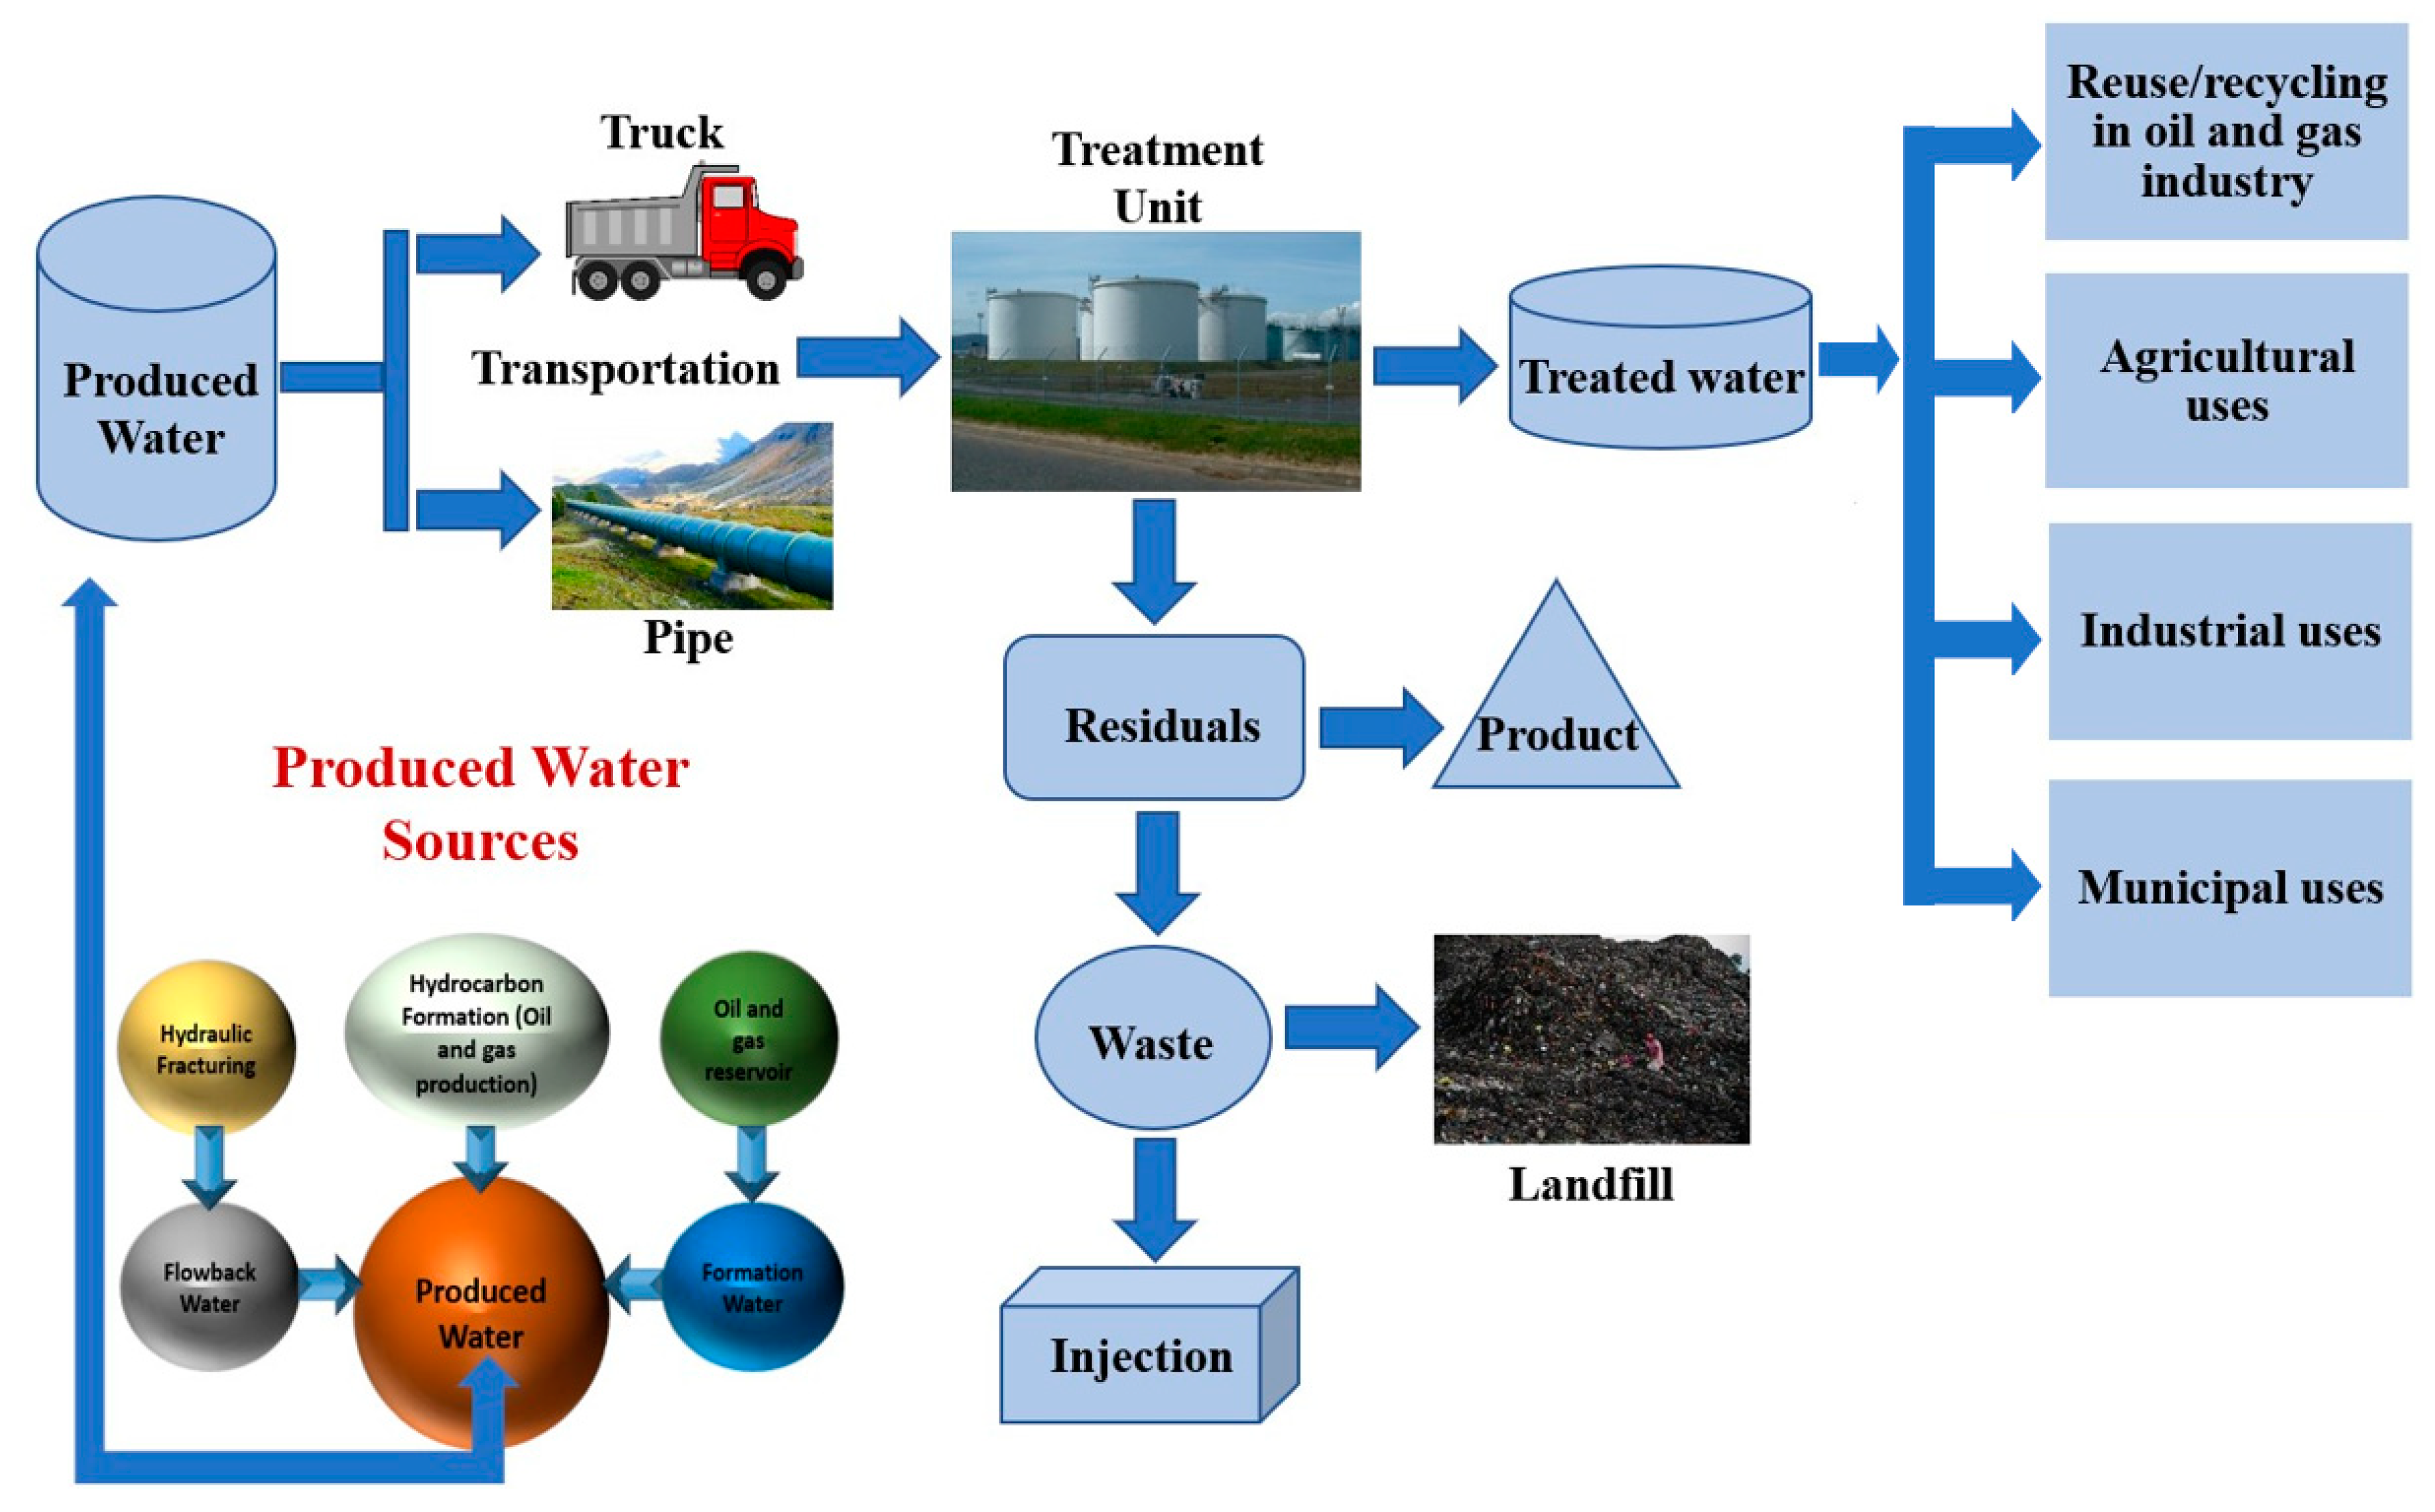
2.1. Treatment Aspects
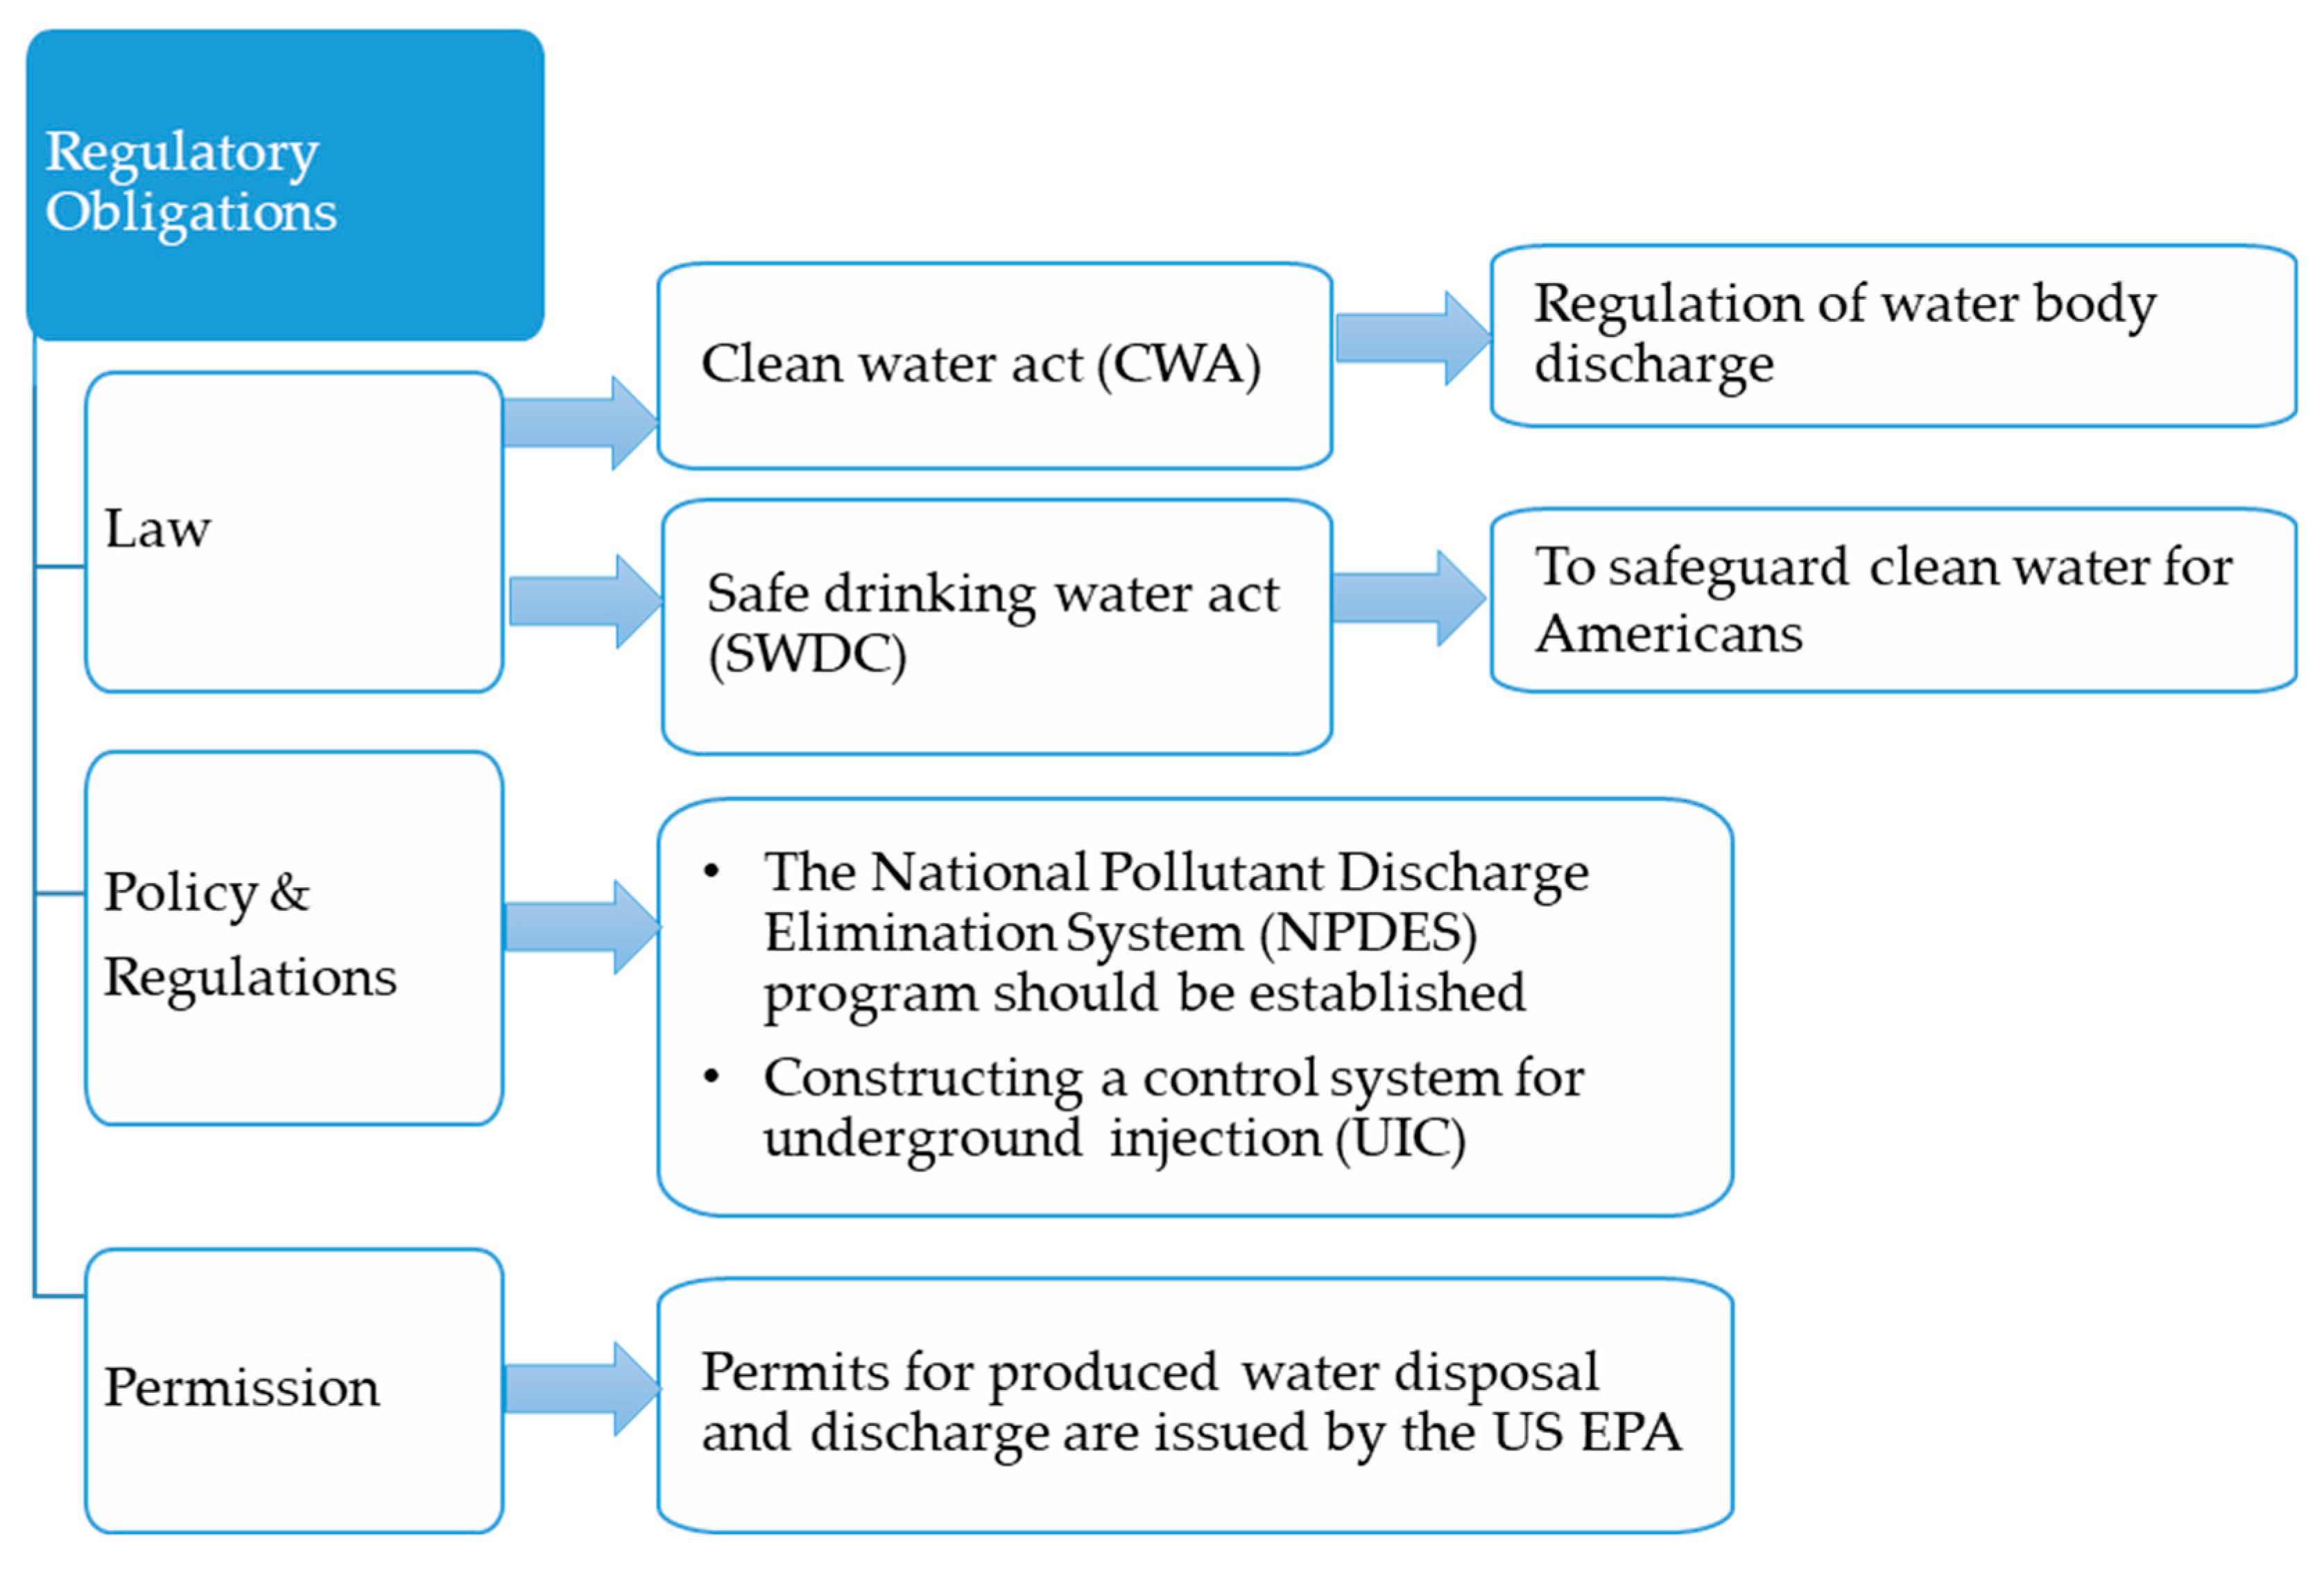
2.2. Regulatory Aspects
-
Comply with the reporting obligations specified by the appropriate environmental agencies and obtain permits prior to discharging, injecting, or storing produced water. These include NPDES (National Pollutant Discharge Elimination System) and state-issued licenses, as well as UIC (Underground Injection Control) well permits;
-
Conform with the criteria and standards for water quality that have been established by state and federal regulatory agencies. These standards establish the maximum allowable concentrations of various pollutants in the produced water and the bodies of water it may contaminate;
-
Comply with standards governing the disposal and transportation of hazardous and non-hazardous waste generated during the treatment and handling of produced water. This may include following the Resource Conservation and Recovery Act (RCRA) regulations;
-
Create and implement spill prevention and response plans to avoid inadvertent leaks of produced water or other contaminants. It is crucial to adhere to the regulations outlined in the Clean Water Act (CWA) and the Oil Pollution Act (OPA);
-
Consistently monitor and provide regulatory authorities with reports on the quantity and quality of produced water, emissions, and discharges; frequently use electronic reporting systems. It is imperative to acquire the appropriate permits for UIC wells and adhere to the prescribed guidelines for injection wells, which may encompass pressure monitoring, mechanical integrity testing, and wellbore integrity assessments;
-
In order to mitigate soil erosion and sediment discharge into water bodies, it is imperative to enforce erosion and sediment control measures mandated by regulatory agencies throughout the construction and operation phases. It is imperative to adhere to regulations pertaining to environmentally friendly completions and emission control, such as the Clean Air Act (CAA) and the implementation of best available control technology (BACT), to mitigate emissions;
-
Ensure adherence to regulations pertaining to concentrated brine disposal and Zero Liquid Discharge (ZLD) systems, which may encompass standards for permits and disposal;
-
Ensure that activities that have the potential to affect the environment or public health are duly communicated to the public and involve local stakeholders and communities in a manner consistent with regulatory requirements;
-
Adhere to the stipulations placed forth by specific regulatory authorities with regard to the financing of research and development initiatives that seek to enhance technologies for water treatment and management;
-
As required by federal and state agencies, conduct environmental impact assessments to determine the potential environmental effects of oilfield activities, such as produced water management;
-
In order to verify compliance with relevant environmental regulations, regulatory authorities should conduct routine inspections and compliance assessments of the oilfield;
-
Comply with standards governing the closure and remediation of oilfields, including produced water management facilities, to avoid long-term environmental damage.
References
- Gregory, K.B.; Vidic, R.D.; Dzombak, D.A. Water management challenges associated with the production of shale gas by hydraulic fracturing. Elements 2011, 7, 181–186.
- Kerr, R.A. Bursts Onto the Scene. Sci. Mag. 2010, 328, 1624–1626.
- Ikonnikova, S.A.; Male, F.; Scanlon, B.R.; Reedy, R.C.; McDaid, G. Projecting the Water Footprint Associated with Shale Resource Production: Eagle Ford Shale Case Study. Environ. Sci. Technol. 2017, 51, 14453–14461.
- Jiménez, S.; Micó, M.M.; Arnaldos, M.; Medina, F.; Contreras, S. State of the art of produced water treatment. Chemosphere 2018, 192, 186–208.
- Hedar, Y.; Budiyono. Pollution Impact and Alternative Treatment for Produced Water. E3S Web Conf. 2018, 31, 03004.
- Fakhru’l-Razi, A.; Pendashteh, A.; Abdullah, L.; Biak, D.; Madaeni, S.; Abidin, Z. Review of technologies for oil and gas produced water treatment. J. Hazard. Mater. 2009, 170, 530–551.
- Abousnina, R.M.; Nghiem, L.D.; Bundschuh, J. Comparison between oily and coal seam gas produced water with respect to quantity, characteristics and treatment technologies: A review. Desalin. Water Treat. 2015, 54, 1793–1808.
- Ottaviano, J.G.; Cai, J.; Murphy, R.S. Assessing the decontamination efficiency of a three-component flocculating system in the treatment of oilfield-produced water. Water Res. 2014, 52, 122–130.
- Kondash, A.; Vengosh, A. Water Footprint of Hydraulic Fracturing. Environ. Sci. Technol. Lett. 2015, 2, 276–280.
- Kondash, A.J.; Lauer, N.E.; Vengosh, A. The intensification of the water footprint of hydraulic fracturing. Sci. Adv. 2018, 5, eaax8764.
- Vidic, R.D.; Brantley, S.L.; Vandenbossche, J.M.; Yoxtheimer, D.; Abad, J.D. Impact of shale gas development on regional water quality. Science 2013, 340, 1235009.
- Mccabe, P.J. Encyclopedia of Sustainability Science and Technology; Springer: New York, NY, USA, 2012.
- Dickhout, J.M.; Moreno, J.; Biesheuvel, P.M.; Boels, L.; Lammertink, R.G.H.; de Vos, W.M. Produced water treatment by membranes: A review from a colloidal perspective. J. Colloid Interface Sci. 2017, 487, 523–534.
- Bagheri, M.; Roshandel, R.; Shayegan, J. Optimal selection of an integrated produced water treatment system in the upstream of oil industry. Process Saf. Environ. Prot. 2018, 117, 67–81.
- Ntongha, O.; and Obire, O. Impact of Oil Field Wastewater from Santa Barbara Oil Rig Location on the Microbial Population of Santa Barbara River in Bayelsa State, Nigeria. Acta Sci. Microbiol. 2022, 45–51.
- Barbot, E.; Vidic, N.S.; Gregory, K.B.; Vidic, R.D. Spatial and temporal correlation of water quality parameters of produced waters from Devonian-age shale following hydraulic fracturing. Environ. Sci. Technol. 2013, 47, 2562–2569.
- Murali Mohan, A.; Hartsock, A.; Bibby, K.J.; Hammack, R.W.; Vidic, R.D.; Gregory, K.B. Microbial community changes in hydraulic fracturing fluids and produced water from shale gas extraction. Environ. Sci. Technol. 2013, 47, 13141–13150.
- Soeder, D.J.; Kappel, W.M. Water Resources and Natural Gas Production from the Marcellus Shale; US Department of the Interior: Reston, VA, USA, 2009.
- Martin, J.P.; Hill, D.G.; Lombardi, T.E. Fractured shale gas potential in New York. Northeast. Geol. Environ. Sci. 2004, 26, 57–78.
- Bakke, T.; Klungsøyr, J.; Sanni, S. Environmental impacts of produced water and drilling waste discharges from the Norwegian offshore petroleum industry. Mar. Environ. Res. 2013, 92, 154–169.
- Gazali, A.K.; Alkali, A.N.; Mohammed, Y.; Djauro, Y.; Muhammed, D.D.; Kodomi, M. Environmental Impact of Produced Water and Driiling Waste Discharges from the Niger Delta Petroleum Industry. IOSR J. Eng. 2017, 7, 22–29.
- Robinson, D. Oil and gas: Water treatment in oil and gas production—Does it matter? Filtr. Sep. 2010, 47, 14–18.
- Baza, J.; Chard, S. Produced water report: Regulations, current practices, and research needs. In Proceedings of the WEFTEC 2019-92nd Annual Water Environment Federation’s Technical Exhibition and Conference, Chicago, IL, USA, 21–25 September 2019; pp. 2483–2491.
- Veil, J. US Produced Water Volumes and Management Practices in 2012; Report Prepared for the Groundwater Protection Council; Groundwater Protection Council: Oklahoma City, OK, USA, 2015; p. 119.
- Veil, J. Produced Water Volumes and Management Practices for 2017; Ground Water Protection Council: Oklahoma City, OK, USA, 2020; Available online: https://www.gwref.net/ (accessed on 14 August 2023).
- Costa, T.C.; Hendges, L.T.; Temochko, B.; Mazur, L.P.; Marinho, B.A.; Weschenfelder, S.E.; Florido, P.L.; da Silva, A.; Ulson de Souza, A.A.; Guelli Ulson de Souza, S.M.A. Evaluation of the technical and environmental feasibility of adsorption process to remove water soluble organics from produced water: A review. J. Pet. Sci. Eng. 2022, 208, 109360.
- PJSC Rosneft Oil Company. PJSC Rosneft Oil Company Annual Report; PJSC Rosneft Oil Company: Moscow, Russia, 2018; Available online: https://www.rosneft.com/upload/site2/document_file/a_report_2018_eng.pdf (accessed on 14 August 2023).
- ESCWA. ESCWA Water Development Report 6: The Water, Energy and Food Security Nexus in the Arab Region; ESCWA: Beirut, Lebanon, 2015.
- Petroleum Development Oman (PDO). Sustainability Report; Petroleum Development Oman (PDO): Muscat, Oman, 2018; Available online: https://www.pdo.co.om/en/news/publications/Publications%20Doc%20Library/PDO%20SR%202018_EA.pdf (accessed on 12 August 2023).
- Petrobras. Sustentabilidade; Petrobras: Rio de Janeiro, Brazil, 2017; Available online: https://sustentabilidad.ypf.com/assets/docs/en/YPF-Sustainability-report-2017.pdf (accessed on 12 August 2023).
- Petrobras. Sustentabilidade; Petrobras: Rio de Janeiro, Brazil, 2018; Available online: https://api.mziq.com/mzfilemanager/v2/d/25fdf098-34f5-4608-b7fa-17d60b2de47d/fd23adf5-6801-fcb1-c0fd-2c699bed5887?origin=1 (accessed on 12 August 2023).
- Saudi Aramco. This Is Energy, This Is Aramco. 2019. Available online: https://www.aramco.com/-/media/publications/corporate-reports/saudi-aramco-ara-2019-english.pdf (accessed on 12 May 2023).
- Cruz, H.; Law, Y.Y.; Guest, J.S.; Rabaey, K.; Batstone, D.; Laycock, B.; Verstraete, W.; Pikaar, I. Mainstream Ammonium Recovery to Advance Sustainable Urban Wastewater Management. Environ. Sci. Technol. 2019, 53, 11066–11079.
- Gerritsen, M.G.; Durlofsky, L.J. Modeling fluid flow in oil reservoirs. Annu. Rev. Fluid Mech. 2005, 37, 211–238.
- White, C.M.; Mungal, M.G. Mechanics and prediction of turbulent drag reduction with polymer additives. Annu. Rev. Fluid Mech. 2008, 40, 235–256.
- Barati, R.; Liang, J.T. A review of fracturing fluid systems used for hydraulic fracturing of oil and gas wells. J. Appl. Polym. Sci. 2014, 131, 1–11.
- Stringfellow, W.T.; Domen, J.K.; Camarillo, M.K.; Sandelin, W.L.; Borglin, S. Physical, chemical, and biological characteristics of compounds used in hydraulic fracturing. J. Hazard. Mater. 2014, 275, 37–54.
- Kahrilas, G.A.; Blotevogel, J.; Stewart, P.S.; Borch, T. Biocides in hydraulic fracturing fluids: A critical review of their usage, mobility, degradation, and toxicity. Environ. Sci. Technol. 2015, 49, 16–32.
- Xu, L.; Fu, Q. Ensuring better well stimulation in unconventional oil and gas formations by optimizing surfactant additives. In Proceedings of the Society of Petroleum Engineers Western Regional Meeting, Bakersfield, CA, USA, 21–23 March 2012; pp. 949–955.
- Lester, Y.; Ferrer, I.; Thurman, E.M.; Sitterley, K.A.; Korak, J.A.; Aiken, G.; Linden, K.G. Characterization of hydraulic fracturing flowback water in Colorado: Implications for water treatment. Sci. Total Environ. 2015, 512–513, 637–644.
- Nicot, J.P.; Scanlon, B.R. Water use for shale-gas production in Texas, U.S. Environ. Sci. Technol. 2012, 46, 3580–3586.
- Raimi, D. Comment on “The intensification of the water footprint of hydraulic fracturing”. Sci. Adv. 2020, 6, aav2110.
- Scanlon, B.R.; Reedy, R.C.; Nicot, J.P. Comparison of water use for hydraulic fracturing for unconventional oil and gas versus conventional oil. Environ. Sci. Technol. 2014, 48, 12386–12393.
- Gallegos, T.J.; Varela, B.A.; Haines, S.S.; Engle, M.A. Hydraulic fracturing water use variability in the United States and potential environmental implications. Water Resour. Res. 2015, 51, 5839–5845.
- Gallegos, T.; Varela, B. Trends in Hydraulic Fracturing Distributions and Treatment Fluids, Additives, Proppants, and Water Volumes Applied to Wells Drilled in the United States from 1947; USGS: Reston, VA, USA, 2014. Available online: https://pubs.usgs.gov/sir/2014/5131/ (accessed on 24 August 2023).
- Walker, E.L.; Anderson, A.M.; Read, L.K.; Hogue, T.S. Water Use for Hydraulic Fracturing of Oil and Gas in the South Platte River Basin, Colorado. J. Am. Water Resour. Assoc. 2017, 53, 839–853.
- Lin, Z.; Lin, T.; Lim, S.; Hove, M.; Schuh, W. Impacts of Bakken Shale Oil Development on Regional Water Uses and Supply. JAWRA J. Am. Water Resour. Assoc. 2017, 54, 225–239.
- da Motta, A.R.P.; Borges, C.P.; Kiperstok, A.; Esquerre, K.P.; Araujo, P.M.; da Paz Nogueira Branco, L. Treatment of petroleum produced water for oil removal by membrane separation processes: Review. Sanit. Environ. Eng. 2013, 18, 15–26.
- Weschenfelder, S.E.; Mello, A.C.C.; Borges, C.P.; Campos, J.C. Oilfield produced water treatment by ceramic membranes: Preliminary process cost estimation. Desalination 2015, 360, 81–86.
- Al-Ghouti, M.A.; Al-Kaabi, M.A.; Ashfaq, M.Y.; Da’na, D.A. Produced water characteristics, treatment and reuse: A review. J. Water Process Eng. 2019, 28, 222–239.
- Masooleh, M.S.; Bazgir, S.; Tamizifar, M.; Nemati, A. Adsorption of Petroleum Hydrocarbons on Organoclay. J. Appl. Chem. Res. 2010, 4, 19–23.
- Chang, H.; Li, T.; Liu, B.; Vidic, R.D.; Elimelech, M.; Crittenden, J.C. Potential and implemented membrane-based technologies for the treatment and reuse of flowback and produced water from shale gas and oil plays: A review. Desalination 2019, 455, 34–57.
- Igunnu, E.T.; Chen, G.Z. Produced water treatment technologies. Int. J. Low-Carbon Technol. 2012, 9, 157–177.
- Liu, Y.; Lu, H.; Li, Y.; Xu, H.; Pan, Z.; Dai, P.; Wang, H.; Yang, Q. A review of treatment technologies for produced water in offshore oil and gas fields. Sci. Total Environ. 2021, 775, 145485.
- Garland, E. Environmental regulatory framework in Europe: An update. In Proceedings of the SPE/EPA/DOE Exploration and Production Environmental Conference, Galveston, TX, USA, 7–9 March 2005.


