Submitted Successfully!
To reward your contribution, here is a gift for you: A free trial for our video production service.
Thank you for your contribution! You can also upload a video entry or images related to this topic.
Version Summary Created by Modification Content Size Created at Operation
1 -- 3828 2023-11-10 14:21:38 |
2 Reference format revised. + 3 word(s) 3831 2023-11-13 03:49:09 |

Video Upload Options

Do you have a full video?

Confirm

Are you sure to Delete?
Cite
If you have any further questions, please contact Encyclopedia Editorial Office.
Danilova, E.Y.; Maslova, A.O.; Stavrianidi, A.N.; Nosyrev, A.E.; Maltseva, L.D.; Morozova, O.L. Chronic Kidney Disease Urine Metabolomics. Encyclopedia. Available online: https://encyclopedia.pub/entry/51425 (accessed on 31 July 2024).
Danilova EY, Maslova AO, Stavrianidi AN, Nosyrev AE, Maltseva LD, Morozova OL. Chronic Kidney Disease Urine Metabolomics. Encyclopedia. Available at: https://encyclopedia.pub/entry/51425. Accessed July 31, 2024.
Danilova, Elena Y., Anna O. Maslova, Andrey N. Stavrianidi, Alexander E. Nosyrev, Larisa D. Maltseva, Olga L. Morozova. "Chronic Kidney Disease Urine Metabolomics" Encyclopedia, https://encyclopedia.pub/entry/51425 (accessed July 31, 2024).
Danilova, E.Y., Maslova, A.O., Stavrianidi, A.N., Nosyrev, A.E., Maltseva, L.D., & Morozova, O.L. (2023, November 10). Chronic Kidney Disease Urine Metabolomics. In Encyclopedia. https://encyclopedia.pub/entry/51425
Danilova, Elena Y., et al. "Chronic Kidney Disease Urine Metabolomics." Encyclopedia. Web. 10 November, 2023.
Chronic Kidney Disease Urine Metabolomics
Edit

One of the primary challenges regarding chronic kidney disease (CKD) diagnosis is the absence of reliable methods to detect early-stage kidney damage. A metabolomic approach is expected to broaden the current diagnostic modalities by enabling timely detection and making the prognosis more accurate. Analysis performed on urine has several advantages, such as the ease of collection using noninvasive methods and its lower protein and lipid content compared with other bodily fluids. 

chronic kidney disease metabolomic biomarkers

1. Introduction

Chronic kidney disease (CKD) is a pathophysiological condition in which kidney function gradually declines. Ongoing damage to kidney cells impairs blood filtration, eventually leading to a chronic and intractable form of CKD. This condition has been identified as a leading cause of death worldwide [1], and regardless of the etiology, the decline in kidney function significantly affects quality of life and increases the risk of mortality [2]. The wide spread of CKD and its negative impact on a patient’s life quality makes CKD a socially significant pathology [3]. Systematic reviews and population-based studies indicate that CKD affects 1% of the pediatric population and has a global prevalence of 11–13%, which exceeds that of diabetes mellitus [4]. Chronic kidney disease (CKD) can lead to a variety of complications. These include cardiovascular disease, electrolyte and acid-base disturbances, anemia, mineral and bone disease, and volume excess [5][6]. The incidence of subsequent renal replacement therapy in pediatric CKD practice varies from 15–30 patients per million children in Eastern Europe to 100 per million children in Finland and the USA. Despite the prevalence of renal pathologies, the diagnosis of CKD is often complicated by the limitations of current approaches and the “blind spot” phenomenon. Currently, CKD can only be diagnosed in its advanced stages because there are no reliable methods for detecting the early stages or the “blind spot” of ongoing kidney damage. Late diagnosis increases the risk of complications and reduces the effectiveness of treatment [7].

2. Analytical Methods in CKD Metabolomics Studies

Modern analytical methods improve the search for CKD markers and expand the range of biomarkers detected in biological samples. “Omics” technologies are part of a high-throughput approach that has emerged in the last two decades. The types of detected molecules form the “four big omics” (i.e., proteomics, genomics, transcriptomics, and metabolomics) [8]. Metabolomic analysis is an extended analysis of low molecular weight (80–1200 Da) metabolite compounds in various biological samples. Using advanced statistical processing, the metabolite data are linked to biological systems’ structures, functions, and dynamics. The significant feature of obtained metabolomic profiles is their contiguity to the phenotype. A fundamental understanding of the pathophysiological process in relation to the phenotype should also be helpful in the development of therapeutic and prognostic methods.
In general, metabolomic studies can be performed using targeted or non-targeted approaches [9][10]. The former is focused on the search and analysis of a preselected set of compounds, while the latter includes a broader range of metabolites. Recent trends lean toward the use of non-targeted methods coupled with machine learning [11], and thus this classification is not present in all works. Both targeted and non-targeted approaches aim to identify discrimination features that can distinguish studied sample groups. The results can be used to develop new diagnostic or staging tools, as well as to explore new hypotheses about the etiopathogenesis of the disease [12].

2.1. NMR Spectroscopy

Nuclear magnetic resonance (NMR) analysis could be performed on different nuclei. Biological samples are usually analyzed on the isotopes of the most abundant elements in biomolecules: 1H, 13C, 14N, and 35P. One of the first works that showed a connection between the essential marker trimethylamine N-oxide (TMAO) and CKD used a combination of 1H-, 13-C-, and 14N-NMR spectroscopy [13]. But today, only 1H-NMR spectroscopy has gained popularity in urine metabolomics due to having the highest abundance of 1H in all metabolites of all other nuclei and, consequently, the highest signal intensity.
The analysis of urine samples by 1H NMR raises the problem of solvent signal suppression due to the high water content in the probe. The dilution grade in urine is higher than in serum and other biofluids; thus, water signals interfere more with metabolite spectra. Therefore, the matrix effect is crucial to overcome in urine NMR spectroscopy analysis. The most common suppression method in urine CKD metabolomics is presaturation [3][14][15][16][17][18][19], which narrows signals and enhances the sensitivity and resolution of the spectrum. Presaturation could precede water signal elimination from the spectra [20] but also could be performed exclusively. For instance, in some works, presaturation was carried out using a 1H-nuclear Overhauser effect spectroscopy (NOESY) experiment [17][18]. Water signal removal improves the detection of low-concentration metabolites, and thus many works include this stage and often combine it with the Carr–Purcell–Meiboom–Gill (CPMG) spin-echo sequence [3][15]. In CKD, albuminuria is a common accompanying pathological condition. Thus, obstructing inhomogeneities caused by high protein content in a sample are also topical to overcome. CPMG minimizes the loss of phase coherence caused by inhomogeneities and removes the broad signals of the macromolecules, such as proteins and lipids.
Moreover, an additional increase in signal intensity can be achieved by the cryoprobe technique combined with transmit coil decoupling using inverse detection (TCI). The main advantage of cryoprobes is that they can significantly increase the sensitivity of NMR measurements by reducing thermal noise and improving the signal-to-noise ratio (SNR). Furthermore, TCI enhances the sensitivity and selectivity of the detection. A combination of a cryoprobe and TCI was applied in the Finnish Diabetic Nephropathy study [17] and an etiology-centered study of CKD [16].
Another feature of NMR studies is the dimension, or the number of independent variables measured during the experiment. Despite the multidimensional NMR resolving power, one-dimensional (1D) NMR with a NOESY-type pulse sequence is more prevalent as a faster and simpler experiment type [16][18][19][20]. Two-dimensional NMR (2D-NMR) was used in the CKD progression study [21], and the two-dimensional (2D) 1H J-resolved experiment was used for finding the biomarkers of both acute and chronic kidney disease [22].
Urine NMR analysis is a promising way to identify and analyze new marker molecules. The additional possibility to combine the identification of compounds of different classes creates great advantages for application in metabolomics research. The method’s modifications increase the detection’s resolution, sensitivity, and selectivity. However, there are disadvantages to the essence of the NMR method.

2.2. Mass Spectrometry-Based Methods

Mass spectrometry-based methods comprise another common group of methods in metabolomic studies. The types of coupled MS could be divided into groups according to compound separation techniques. The most prevalent ones when considering types of metabolomics analysis are capillary electrophoresis (CE), gas chromatography (GC), and liquid chromatography (LC).
For analysis by gas chromatography-mass spectrometry (GC-MS), a sample must be prepared by being transferred to the gas phase through physical (micro solid-phase extraction from the vapor phase, evaporation, and steam extraction from the sample without additional concentration) or chemical (derivatization of compounds) methods. The chosen liquid-liquid extraction method without derivatization results in a limited number of volatile compounds, usually thermostable ones [23]. Clinical laboratories are much more likely to have access to tandem GC-MS. Therefore, the resulting panels of biomarkers may be easier to implement as an addition to existing diagnostic methods. The most robust approach in sample preparation could be performed if the headspace method was chosen. Headspace GC analyzes only the vapor phase above the sample; thus, the additional derivatization stage is unnecessary. Metabolite concentrations in the vapor phase are low, and thus high sensitivity and mass resolution time-of-flight mass spectrometry (TOF-MS) is chosen [24][25]. The derivatization step can also help overcome low sensitivity and enhance signals. The popular type of derivatization in urine metabolomics studies is trimethylsilyl derivatives [9][26].
In CKD metabolomic studies, the separation in the liquid phase could be performed by reversed-phase (RP) liquid chromatography-mass spectrometry (LC-MS), hydrophilic interaction liquid chromatography-mass spectrometry (HILIC-LC-MS), and capillary electrophoresis-mass spectrometry (CE-MS) methods. The two last approaches conform to the polar metabolites’ separation, while RP LC-MS is designed for nonpolar metabolite separation. There was no prevalence in any chromatography method in the considered metabolomic studies, as CKD’s markers belong to many different compound classes.
As in NMR metabolomic studies, a significant problem in method development is a high dilution of urine samples and, consequently, a low concentration of metabolites. To overcome this in tandem MS methods, the samples could be dried and reconstituted in a smaller amount of solvent [27][28], or solid-phase microextraction could be performed [29]. Furthermore, resolution and sensitivity enhancement could be achieved by different MS instrumentation. The prevalent amount of CKD metabolomic works were made using time-of-flight mass spectrometry (TOF-MS) [10][24][27][30] and quadrupole time-of-flight mass spectrometry (Q-TOF-MS) [31][32][33][34], which is characterized by high sensitivity, fast scanning speeds, and accurate mass measurements. However, in one of the works, both Q-TOF-MS and reconstitution techniques were performed [28]. While less popular, there are still other mass spectrometer types: the triple quadrupole mass spectrometer (TQ-MS) [10], Orbitrap MS [20], and Q-Exactive Focus mass spectrometer [35][36].
Also, the problem of a high protein presence in the urine of CKD patients was already mentioned. To overcome this, in tandem, MS or flow-injection MS methodic protein is precipitated by acetonitrile, methanol, or their water solutions being added in the sample, followed by centrifugation. To make the sample extra purified, the ultrafiltration stage is included in the sample preparation [30][35].
Metabolomic studies, especially in large cohorts, require a robust and simple sample preparation method. The answer to this question was proposed in a “dilute-and-shoot” approach. The “dilute-and-shoot” approach in metabolomics has been used for many years and can be described as a specific type of sample preparation method in mass spectrometry-based metabolomics, where the sample is diluted and directly injected into the mass spectrometer without further cleanup or extraction steps. Kwan et al. used a method close to this approach in the CRIC study, which included 1001 participants altogether [32].
After the sample preparation and chromatographic separation steps, the MS detection stage occurs in tandem MS methods. In MS, molecules are identified and quantified by measuring the signal level of the mass-to-charge ratio of the ions (m/z) derived from those molecules. There are many techniques for producing ions in MS. Usually, in urine metabolOne of the latest works in the scope used heated electrospray ionization (HESI) [36].
Compound identification complemented by databases (e.g., NIST) is the most typical approach for GC-MS experiments. In liquid chromatography, the identification of compounds is a more complex issue, and universal bases do not exist, as for GC. However, in some works, databases developed within the laboratory used research [31].
Another essential question is the verification of the obtained panel of markers. To solve this problem, a combination of different analytical approaches could be applied. For instance, the panel of markers combinates from both methods’ data, and then markers giving the statistically significant difference between groups are verified and chosen [3]
Mass spectrometry-based methods win over NMR in terms of sensitivity and are the perfect tools for metabolomic studies. GC-MS techniques may be easier to implement in clinical laboratories, but analyzing non-volatile metabolites could be associated with a time-consuming derivatization process. However, compound identification in MS analysis is not as straightforward as in NMR, and the high dilution factor also plays a role.

3. Biomarkers and Pathways

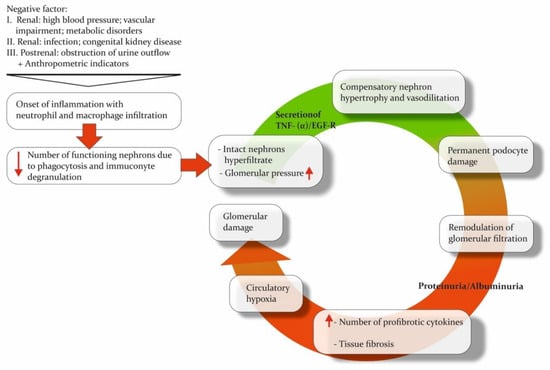
3.1. Pathogenesis of CKD

Regardless of the etiology of the damaging factor, CKD is based on similar pathogenetic mechanisms: loss of functional nephrons, damage to the convoluted tubules, inflammation, and fibrosis. An inflammatory reaction develops in the kidney parenchyma after exposure to any negative factor. This reaction leads to neutrophilic and macrophage infiltration and the proliferation of mesangial cells [37]. At the same time, the decrease in the number of functioning nephrons leads to the development of a hyperfiltration process in the intact nephrons. These changes compensate for the reduction in the number of active nephrons while at the same time significantly increasing the workload of the functioning nephrons [38]. The resulting raised glomerular pressure and hyperfiltration trigger the secretion of tumor necrosis factor-alpha/epithelial growth factor receptor (TNF-a/EGF-R), the activation of which induces nephron hypertrophy [38][39]. Nephron hypertrophy allows glomerular pressure to decrease by increasing the filtering area [40]. However, this could also result in damage to podocytes and remodeling of the filtration barrier, which raises its permeability and causes clinical manifestations of albuminuria or proteinuria [41]. Albumin and its complement pass through the filtration barrier, along with immune cells infiltrating damaged tissue. These processes stimulate the release of profibrotic cytokines by glomerular cells, leading to the maintenance of a pro-inflammatory microenvironment and the initiation of fibrosis [42][43][44][45]. The extensive growth of connective tissue leads to tissue and circulatory hypoxia, which increases damage to the glomerular and tubular apparatus of the kidney, ultimately completing the “vicious circle” of CKD pathogenesis (Figure 1) [46][47].
Figure 1. The “vicious circle” of CKD. Pathogenetic mechanisms underlying chronic kidney disease inevitably form a circle, leading to major organ damage. The direction of the red arrows shows the up- or down-regulation of processes or the increase/decrease in the number of cells or other functional units.
Changes in the composition of biological fluids and tissues provide an opportunity to use certain protein and non-protein molecules associated with specific pathways in the pathogenesis of CKD as biomarkers. In biopsy material [48][49][50] and, more commonly, in biological fluids, the concentration of biomarkers can be measured directly. Biofluids can reflect both the pathophysiological processes occurring directly in the kidneys and systemic changes [51].
Blood and urine can be collected in a sufficient volume for multiple tests simultaneously through minimally invasive techniques, offering a notable benefit to patients by alleviating discomfort associated with repeated collection of biomaterials and to researchers through the decreased cost of sampling procedures. Numerous studies have shown an association between the progression of CKD and the concentration of marker molecules in the blood or urine. These include structural protein (such as various types of collagens) biomarkers for tubular damage, inflammation, fibrosis, and hypoxia [52][53][54].

3.2. Markers of CKD

As previously mentioned, chronic kidney disease (CKD) is a polyetiological disease. The primary issue with CKD is that the inflammatory response and impaired renal function are accompanied by processes that partially sustain them. CKD is linked to various osmolytes and uremic solutes, which are associated with biochemical pathways in the body.

Uremic solutes are toxic compounds. They are associated with uremia and subsequent changes in organ function. Robert D. Mair and colleagues performed urine metabolomic analysis by using LC-MS to study the clearance of uremic solutes [55]. However, this approach required urine and plasma samples to calculate the fractional clearance formula. Specifically, in patients with advanced disease, the most significant changes in clearance compared with control samples were observed for p-cresol sulfate, indoxyl sulfate, hippurate, and phenylacetylglutamine.

This is consistent with the results of another study in which elevated indoxyl sulfate levels in urine were also correlated with elevated serotonin sulfate levels. The authors suggested that both markers could be considered significant signals for the early diagnosis of CKD [56]. However, it is uncertain whether a single molecule can definitively resolve the issue of delayed CKD diagnosis. Targeting analysis of compounds related to indoxyl sulfate metabolism would be valuable to confirm these findings. 

Osmolytes are the compounds involved in cellular osmotic regulation, which alters CKD. Ryan B. Gil and colleagues confirmed the altered concentration of uremic toxins (e.g., hippuric acid, indoxyl sulfate, and p-cresol sulfate) and included osmolytes in the developed diagnostic panel [14]. Two of the most important protective compounds from the osmotic stress effect are betaine and myo-inositol. These molecules showed the best prognostic value, also agreeing with eGFR. The confirming transcriptomic analysis accompanied these results on a murine CKD model.

In addition to osmotic stress, kidney tissue is also affected by oxidative stress during the development of CKD. Markers of this process were observed in the Balkan Endemic Nephropathy (BEN) study. Additionally, the uremic toxin p-cresol was detected in the urine of a group of patients.

Amino acids (AAs) undergo filtration and reabsorption in the kidney. Altered reabsorption of AAs in the proximal tubule may explain the increased urinary levels and decreased serum levels of AAs in patients with chronic kidney disease (CKD). With progressive renal dysfunction, the urinary levels of AAs increase, indicating impairment of both glomerular and tubular structures, even in the early stages of CKD. In the study by Galavan et al., phenylalanine was also included in the metabolomic profile of CKD [56]. This amino acid has been observed by researchers investigating different subtypes of CKD. This can be explained by the data published this year on phenylalanine hydroxylase (PAH) activity. PAH is commonly found in the kidney, liver, and pancreas. 

3.3. Markers for CKD Subtypes

Diabetic kidney disease (DKD) is a highly prevalent form of CKD and is most commonly studied in the context of urinary metabolomics. However, several challenges are involved in formulating the format of a DKD study. Diabetes mellitus is a lifelong endocrine disease, and the manifestation of CKD can be detected at any time and at different rates. As a result, highly sensitive progression markers are essential.
Progression markers of DKD were examined in various experimental models. One approach involved annually evaluating the slope of a clinical parameter such as eGFR [9][27][32][57], time until the end stage [57], and time until incident kidney failure with replacement therapy [32]. An alternative method involved dividing the study cohort into groups based on the stage of DKD before comparing the samples [18].
These results are consistent with the discovery of 3-hydroxyisobutyrate (3-HIBA) metabolite, which was identified as a catabolic intermediate of BCAA in a study of CRIC participants with diabetes [32]. Impairment in BCAA catabolism plays a significant role in the pathogenesis of type 2 diabetes and obesity [58]. In the work by Chasapi et al., 3-methyl-2-oxovalerate, a compound involved in BCAA catabolism, served as a diagnostic element to differentiate hypertensive nephrosclerosis from diabetic nephropathy [16]. The changes in the TCA cycle and BCAA catabolism could be associated with the decline of mitochondrial functions, angiogenesis, or the development of insulin resistance and ketoacidosis in diabetic patients [32]. However, in the non-diabetic cohort, both the individual and total levels of BCAAs showed a moderate probability of early-stage cardiovascular, metabolic, and renal disease, with the strongest likelihood being for the latter [59]
But not only BCAA amino metabolism has been mentioned in recent works. Other amino acid pathways have been included in metabolomic diagnostic panels. Taherkhani et al. underlined the importance of aromatic amino acid metabolism in the early stage of contrast-induced nephropathy [26][60][61]. However, in the work of J.R. Lucio-Gutiérrez, et al., compounds related to amino acid metabolism and biosynthesis were associated with moderate and severe DKD [18].
The TCA cycle in mitochondria has adenosine triphosphate (ATP) production function and regulates glucose, fatty acid, and amino acid metabolism [61][62]. It was shown that deterioration in mitochondrial processes accompanies non-diabetic CKD [14] and DKD [9][18][32]. TCA cycle impairment could also be related to regulating inflammation and oxidative stress [60][61].
Compounds related to fatty acid metabolism are also common in DKD diagnostic panels. Elevated albumin excretion and fatty acid loads filtrated by the glomerulus lead to the reabsorption of a bounded free acid surplus with albumin in the renal tubules [63]. Other processes connected with fatty acids’ metabolism and mentioned in the literature are kidney function maintenance [64], podocyte apoptosis by reactive oxygen species (ROS) formation [65], and keto acid metabolism [64]. Linoleic acid and γ-linolenic acid uremic concentrations have a dramatic difference in the ADKD group in comparison with the simple DM and NADKD groups [35]
Another significant feature, as mentioned previously, is the rate at which chronic kidney disease (CKD) develops. Hirakawa et al. designed a marker panel for the rapid decline in DKD, using a combination of non-targeted metabolomics and advanced machine learning analysis [27]. These methods improved the data scope that could be extracted from patient samples. The urinary threonic acid was found to be a better marker of rapid decline in DKD. The role of threonic acid in pathogenesis is unclear due to the limited metabolomic panels reporting on it [27]. The study’s main strength is the high number of recruited patients, making the results especially significant. In another smaller cohort, some patients exhibited rapid progression of kidney dysfunction and changes in phospholipid metabolism. This could be due to the involvement of LPC (16:0 and 18:0) in the metabolic shift during DKD progression. 

3.4. Markers of Acute Kidney Injury

Acute kidney injury (AKI) is defined as a rapid decline in kidney function. AKI can be viewed as a potential risk factor for the development of CKD and a consequence of CKD. However, AKI and CKD may coexist and interact in a bidirectional fashion. AKI can accelerate the progression of CKD, while CKD can increase one’s predisposition to AKI. This interaction can lead to a cycle in which AKI worsens CKD, increasing the risk of future AKI episodes. Both conditions may have similar symptoms, and diagnosing AKI can be as complex as diagnosing CKD.
Chen Chaoyi et al. found that a diagnostic panel for AKI that included xenobiotic metabolism played a critical role in disease manifestation [28]. Samples from healthy patients could be differentiated from those with AKI by identifying compounds related to xenobiotic metabolism, such as cytochrome P450 and arginine and proline metabolism [28].

3.5. Markers of Renal Impairment in Children

Chronic kidney disease (CKD) in children shares the same diagnostic problems but has additional limitations in treatment and transplantation. However, research on pediatric cohorts is limited. In papers describing metabolomic profiles in children, the number of samples is exceptionally small, and population studies are lacking.
Diagnostic metabolomic panels typically include markers associated with the TCA cycle and amino acid and fatty acid metabolism, as noted above. This is also true for studies based on the results of pediatric cohort analyses [10][19][31][66][67].
Maciozsek et al. performed a metabolomic analysis to investigate significant variations in biochemical pathways in children who had been diagnosed with renal dysplasia [10]. The results showed a decrease in the levels of acylcarnitines, indoxyl sulfate, xanthine, glutamine, and aconitate, accompanied by increased levels of lactate, dimethylguanosine, and guanidinosuccinate in the patients’ urine. Based on the collected data, the authors concluded that the regulatory processes of glycolysis (the Warburg effect), the ornithine cycle, the tricarboxylic acid cycle, purine metabolism, and fatty acid biosynthesis are disrupted in children with renal dysplasia [10]

4. Conclusions

CKD is a challenging disease. Because of its specific pathological course, inflammation that starts in one part of the organ gradually spreads to functional kidney tissues. The existing diagnostic methods are insufficient, resulting in a delay in detecting this process. However, there is a promising opportunity for diagnostic method development based on a metabolomic approach. Typically, urinary metabolic studies in CKD patients utilize NMR and tandem MS techniques. However, not every medical center is equipped to perform analysis using expensive MS and NMR analyzers. These instruments’ limited availability and high cost hamper the widespread use of metabolomic screening methods. This poses a challenge in developing and optimizing methods that align with the specific characteristics of the clinical laboratory. In addition, matrix effects and high initial sample dilution must be taken into account when developing urinalysis methods for metabolomics.
The metabolomic approach presents vast potential for advancing personalized medicine related to CKD. However, additional research is needed to address the challenges of cost, availability, validation, and standardization of urine metabolomic analysis to maximize the benefits of metabolomics in the diagnosis and prognosis of CKD. 

References

  1. Cockwell, P.; Fisher, L.A. The global burden of chronic kidney disease. Lancet 2020, 395, 662–664.
  2. Webster, A.C.; Nagler, E.V.; Morton, R.L.; Masson, P. Masson, Chronic Kidney Disease. Lancet 2017, 389, 1238–1252.
  3. Taherkhani, A.; Yekta, R.F.; Mohseni, M.; Saidijam, M.; Oskouie, A.A. Chronic kidney disease: A review of proteomic and metabolomic approaches to membranous glomerulonephritis, focal segmental glomerulosclerosis, and IgA nephropathy biomarkers. Proteome. Sci. 2019, 17, 7.
  4. Hill, N.R.; Fatoba, S.T.; Oke, J.L.; Hirst, J.A.; O’Callaghan, C.A.; Lasserson, D.S.; Hobbs, F.D.R. Global Prevalence of Chronic Kidney Disease—A Systematic Review and Meta-Analysis. PLoS ONE 2016, 11, e0158765.
  5. Lowe, K.M.; Cruz, J.B.; Jones, K.M. Complications in Patients with Chronic Kidney Disease. Crit. Care Nurs. Clin. North. Am. 2022, 34, 395–407.
  6. Yan, M.T.; Chao, C.T.; Lin, S.H. Chronic Kidney Disease: Strategies to Retard Progression. Int. J. Mol. Sci. 2021, 22, 10084.
  7. Sanchez-Niño, M.D.; Sanz, A.B.; Ramos, A.M.; Fernandez-Fernandez, B.; Ortiz, A. Clinical proteomics in kidney disease as an exponential technology: Heading towards the disruptive phase. Clin. Kidney. J. 2017, 10, 188–191.
  8. Karczewski, K.J.; Snyder, M.P. Integrative omics for health and disease. Nat. Rev. Genet. 2018, 19, 299–310.
  9. Liu, J.-J.; Liu, S.; Gurung, R.L.; Ching, J.; Kovalik, J.-P.; Tan, T.Y.; Lim, S.C. Urine Tricarboxylic Acid Cycle Metabolites Predict Progressive Chronic Kidney Disease in Type 2 Diabetes. J. Clin. Endocrinol. Metab. 2018, 103, 4357–4364.
  10. Macioszek, S.; Wawrzyniak, R.; Kranz, A.; Kordalewska, M.; Struck-Lewicka, W.; Dudzik, D.; Biesemans, M.; Maternik, M.; Żurowska, A.M.; Markuszewski, M.J. Comprehensive Metabolic Signature of Renal Dysplasia in Children. A Multiplatform Metabolomics Concept. Front. Mol. Biosci. 2021, 8, 665661.
  11. Lee, A.M.; Hu, J.; Xu, Y.; Abraham, A.G.; Xiao, R.; Coresh, J.; Rebholz, C.; Chen, J.; Rhee, E.P.; Feldman, H.I.; et al. Using Machine Learning to Identify Metabolomic Signatures of Pediatric Chronic Kidney Disease Etiology. J. Am. Soc. Nephrol. 2022, 33, 375–386.
  12. Jacob, M.; Lopata, A.L.; Dasouki, M.; Rahman, A.M.A. Metabolomics toward personalized medicine. Mass Spectrom. Rev. 2019, 38, 221–238.
  13. Bell, J.D.; Lee, J.A.; Lee, H.A.; Sadler, P.J.; Wilkie, D.R.; Woodham, R.H. Nuclear magnetic resonance studies of blood plasma and urine from subjects with chronic renal failure: Identification of trimethylamine-N-oxide. Biochim. Biophys. Acta 1991, 1096, 101–107.
  14. Gil, R.B.; Ortiz, A.; Sanchez-Niño, M.D.; Markoska, K.; Schepers, E.; Vanholder, R.; Glorieux, G.; Schmitt-Kopplin, P.; Heinzmann, S.S. Increased urinary osmolyte excretion indicates chronic kidney disease severity and progression rate. Nephrol. Dial. Transplant. 2018, 33, 2156–2164.
  15. Dalili, N.; Chashmniam, S.; Khoormizi, S.M.H.; Salehi, L.; Jamalian, S.A.; Nafar, M.; Kalantari, S. Urine and serum NMR-based metabolomics in pre-procedural prediction of contrast-induced nephropathy. Intern. Emerg. Med. 2020, 15, 95–103.
  16. Chasapi, S.A.; Karagkouni, E.; Kalavrizioti, D.; Vamvakas, S.; Zompra, A.; Takis, P.G.; Goumenos, D.S.; Spyroulias, G.A. NMR-Based Metabolomics in Differential Diagnosis of Chronic Kidney Disease (CKD) Subtypes. Metabolites 2022, 12, 490.
  17. Mutter, S.; Valo, E.; Aittomäki, V.; Nybo, K.; Raivonen, L.; Thorn, L.M.; Forsblom, C.; Sandholm, N.; Würtz, P.; Groop, P.H. Urinary metabolite profiling and risk of progression of diabetic nephropathy in 2670 individuals with type 1 diabetes. Diabetologia 2022, 65, 140–149.
  18. Lucio-Gutiérrez, J.R.; Cordero-Pérez, P.; Farías-Navarro, I.C.; Tijerina-Marquez, R.; Sánchez-Martínez, C.; Ávila-Velázquez, J.L.; García-Hernández, P.A.; Náñez-Terreros, H.; Coello-Bonilla, J.; Pérez-Trujillo, M.; et al. Using nuclear magnetic resonance urine metabolomics to develop a prediction model of early stages of renal disease in subjects with type 2 diabetes. J. Pharm. Biomed. Anal. 2022, 219, 114885.
  19. Muhle-goll, C.; Eisenmann, P.; Luy, B.; Kölker, S.; Tönshoff, B.; Fichtner, A.; Westhoff, J.H. Urinary NMR Profiling in Pediatric Acute Kidney Injury—A Pilot Study. Int. J. Mol. Sci. 2020, 21, 1187.
  20. Cheng, L.; Wang, L.; Chen, B.; Wang, C.; Wang, M.; Li, J.; Gao, X.; Zhang, Z.; Han, L. A multiple-metabolites model to predict preliminary renal injury induced by iodixanol based on UHPLC/Q-Orbitrap-MS and 1H-NMR. Metabolomics 2022, 18, 85.
  21. Zhang, W.R.; Parikh, C.R. Biomarkers of Acute and Chronic Kidney Disease. Annu. Rev. Physiol. 2019, 81, 309–333.
  22. Eckardt, K.U.; Coresh, J.; Devuyst, O.; Johnson, R.J.; Köttgen, A.; Levey, A.S.; Levin, A. Evolving importance of kidney disease: From subspecialty to global health burden. Lancet 2013, 382, 158–169.
  23. Ordodi, V.L.; Hădărugă, N.G.; Hădărugă, D.I.; Lukinich-Gruia, A.T.; Mărgineanu, M.; Tatu, C.A.; Păunescu, V. Urine Metabolomic Signature of People Diagnosed with Balkan Endemic Nephropathy and Other Types of Chronic Kidney Disease Compared with Healthy Subjects in Romania. Metabolites 2023, 13, 609.
  24. Ligor, T.; Zawadzka, J.; Strączyński, G.; Paredes, R.M.G.; Wenda-Piesik, A.; Ratiu, I.A.; Muszytowski, M. Searching for Potential Markers of Glomerulopathy in Urine by HS-SPME-GC × GC TOFMS. Molecules 2021, 26, 1817.
  25. Shao, M.; Lu, H.; Yang, M.; Liu, Y.; Yin, P.; Li, G.; Wang, Y.; Chen, L.; Chen, Q.; Zhao, C.; et al. Serum, and urine metabolomics reveal potential biomarkers of T2DM patients with nephropathy. Ann. Transl. Med. 2020, 8, 199.
  26. Taherkhani, A.; Nafar, M.; Arefi-Oskouei, A.; Broumandnia, N.; Parvin, M.; Mahmoudieh, L.; Kalantari, S. Metabolomic Analysis of Membranous Glomerulonephritis: Identification of a Diagnostic Panel and Pathogenic Pathways. Arch. Med. Res. 2019, 50, 159–169.
  27. Hirakawa, Y.; Yoshioka, K.; Kojima, K.; Yamashita, Y.; Shibahara, T.; Wada, T.; Nangaku, M.; Inagi, R. Potential progression biomarkers of diabetic kidney disease determined using comprehensive machine learning analysis of non-targeted metabolomics. Sci. Rep. 2022, 12, 16287.
  28. Chen, C.; Zhang, P.; Bao, G.; Fang, Y.; Chen, W. Discovery of potential biomarkers in acute kidney injury by ultra-high-performance liquid chromatography-tandem quadrupole time-of-flight mass spectrometry (UPLC-Q/TOF–MS). Int. Urol. Nephrol. 2021, 53, 2635–2643.
  29. Piedrafita, A.; Balayssac, S.; Mayeur, N.; Gazut, S.; Grossac, J.; Buleon, M.; Alves, M.; Klein, J.; Minville, V.; Marcheix, B.; et al. The tryptophan pathway and nicotinamide supplementation in ischaemic acute kidney injury. Clin. Kidney J. 2021, 14, 2490–2496.
  30. Saito, R.; Hirayama, A.; Akiba, A.; Kamei, Y.; Kato, Y.; Ikeda, S.; Kwan, B.; Pu, M.; Natarajan, L.; Shinjo, H.; et al. Urinary Metabolome Analyses of Patients with Acute Kidney Injury Using Capillary Electrophoresis-Mass Spectrometry. Metabolites 2021, 11, 671.
  31. Wang, S.; Xiao, C.; Liu, C.; Li, J.; Fang, F.; Lu, X.; Zhang, C.; Xu, F. Identification of Biomarkers of Sepsis-Associated Acute Kidney Injury in Pediatric Patients Based on UPLC-QTOF/MS. Inflammation 2020, 43, 629–640.
  32. Kwan, B.; Fuhrer, T.; Zhang, J.; Darshi, M.; Van Espen, B.; Montemayor, D.; de Boer, I.H.; Dobre, M.; Hsu, C.Y.; Kelly, T.N.; et al. Metabolomic Markers of Kidney Function Decline in Patients with Diabetes: Evidence from the Chronic Renal Insufficiency Cohort (CRIC) Study. Am. J. Kidney Dis. 2020, 76, 511–520.
  33. Kim, Y.; Lee, J.; Kang, M.S.; Song, J.; Kim, S.G.; Cho, S.; Huh, H.; Lee, S.; Park, S.; Jo, H.A.; et al. Urinary metabolite profile predicting the progression of chronic kidney disease. Kidney 2023, 4, 1048–1057.
  34. Yoshioka, K.; Hirakawa, Y.; Kurano, M.; Ube, Y.; Ono, Y.; Kojima, K.; Iwama, T.; Kano, K.; Hasegawa, S.; Inoue, T.; et al. Lysophosphatidylcholine mediates fast decline in kidney function in diabetic kidney disease. Kidney Int. 2022, 101, 510–526.
  35. Feng, Q.; Li, Y.; Yang, Y.; Feng, J. Urine Metabolomics Analysis in Patients with Normoalbuminuric Diabetic Kidney Disease. Front. Physiol. 2020, 11, 578799.
  36. Bai, Y.; Zhang, H.; Wu, Z.; Huang, S.; Luo, Z.; Wu, K.; Hu, L.; Chen, C. Use of ultra high-performance liquid chromatography with high resolution mass spectrometry to analyze urinary metabolome alterations following acute kidney injury in post-cardiac surgery patients. J. Mass Spectrom. Adv. Clin. Lab. 2022, 24, 31–40.
  37. Lv, W.; Booz, G.W.; Wang, Y.; Fan, F.; Roman, R.J. Inflammation and renal fibrosis: Recent developments on key signaling molecules as potential therapeutic targets. Eur. J. Pharmacol. 2018, 820, 65–76.
  38. Chagnac, A.; Zingerman, B.; Rozen-Zvi, B.; Herman-Edelstein, M. Consequences of Glomerular Hyperfiltration: The Role of Physical Forces in the Pathogenesis of Chronic Kidney Disease in Diabetes and Obesity. Nephron 2019, 143, 38–42.
  39. Lindhardt, M.; Persson, F.; Currie, G.; Pontillo, C.; Beige, J.; Delles, C.; Von Der Leyen, H.; Mischak, H.; Navis, G.; Noutsou, M.; et al. Proteomic prediction and Renin angiotensin aldosterone system Inhibition prevention of early diabetic nephropathy in TYpe 2 diabetic patients with normoalbuminuria (PRIORITY): Essential study design and rationale of a randomised clinical multicentre trial. BMJ Open 2016, 6, e010310.
  40. Kim, K.; Aronov, P.; Zakharkin, S.O.; Anderson, D.; Perroud, B.; Thompson, I.M.; Weiss, R.H. Urine metabolomics analysis for kidney cancer detection and biomarker discovery. Mol. Cell Proteom. 2009, 8, 558–570.
  41. Romagnani, P.; Remuzzi, G.; Glassock, R.; Levin, A.; Jager, K.J.; Tonelli, M.; Massy, Z.; Wanner, C.; Anders, H.J. Chronic kidney disease. Nat. Rev. Dis. Primers 2017, 3, 17088.
  42. Humphreys, B.D. Mechanisms of Renal Fibrosis. Annu. Rev. Physiol. 2018, 80, 309–326.
  43. Wang, Y.N.; Ma, S.X.; Chen, Y.Y.; Chen, L.; Liu, B.L.; Liu, Q.Q.; Zhao, Y.Y. Chronic kidney disease: Biomarker diagnosis to therapeutic targets. Clin. Chim. Acta 2019, 499, 54–63.
  44. Schnaper, H.W. The Tubulointerstitial Pathophysiology of Progressive Kidney Disease. Adv. Chronic. Kidney Dis. 2017, 24, 107–116.
  45. Duffield, J.S. Cellular and molecular mechanisms in kidney fibrosis. J. Clin. Investig. 2014, 124, 2299–2306.
  46. Fu, Q.; Colgan, S.P.; Shelley, C.S. Hypoxia: The Force that Drives Chronic Kidney Disease. Clin. Med. Res. 2016, 14, 15–39.
  47. Tanaka, S.; Tanaka, T.; Nangaku, M. Hypoxia and Dysregulated Angiogenesis in Kidney Disease. Kidney Dis. 2015, 1, 80–89.
  48. Carbonare, L.D.; Valenti, M.T.; Giannini, S.; Gallieni, M.; Stefani, F.; Ciresa, R.; Politi, C.; Fusaro, M. Bone Biopsy for Histomorphometry in Chronic Kidney Disease (CKD): State-of-the-Art and New Perspectives. J. Clin. Med. 2021, 10, 4617.
  49. Misra, B.B.; Upadhayay, R.P.; Cox, L.A.; Olivier, M. Optimized GC–MS metabolomics for the analysis of kidney tissue metabolites. Metabolomics 2018, 14, 75.
  50. Hanifa, M.A.; Skott, M.; Maltesen, R.G.; Rasmussen, B.S.; Nielsen, S.; Frøkiær, J.; Ring, T.; Wimmer, R. Tissue, urine and blood metabolite signatures of chronic kidney disease in the 5/6 nephrectomy rat model. Metabolomics 2019, 15, 112.
  51. Mussap, M.; Noto, A.; Fanos, V.; Van Den Anker, J.N. Emerging Biomarkers and Metabolomics for Assessing Toxic Nephropathy and Acute Kidney Injury (AKI) in Neonatology. Biomed. Res. Int. 2014, 2014, 602526.
  52. Gupta, J.; Mitra, N.; Kanetsky, P.A.; Devaney, J.; Wing, M.R.; Reilly, M.; Shah, V.O.; Balakrishnan, V.S.; Guzman, N.J.; Girndt, M.; et al. Association between albuminuria; kidney function, and inflammatory biomarker profile in CKD in CRIC. Clin. J. Am. Soc. Nephrol. 2012, 7, 1938–1946.
  53. Nkuipou-Kenfack, E.; Duranton, F.; Gayrard, N.; Argilés, À.; Lundin, U.; Weinberger, K.M.; Dakna, M.; Delles, C.; Mullen, W.; Husi, H.; et al. Assessment of metabolomic and proteomic biomarkers in detection and prognosis of progression of renal function in chronic kidney disease. PLoS ONE 2014, 9, e96955.
  54. Uwaezuoke, S.N.; Ayuk, A.C.; Muoneke, V.U.; Mbanefo, N.R. Chronic kidney disease in children: Using novel biomarkers as predictors of disease. Saudi. J. Kidney Dis. Transpl. 2018, 29, 775–784.
  55. Mair, R.D.; Lee, S.; Plummer, N.S.; Sirich, T.L.; Meyer, T.W. Impaired tubular secretion of organic solutes in advanced chronic kidney disease. J. Am. Soc. Nephrology 2021, 32, 2877.
  56. Glavan, M.R.; Socaciu, C.; Socaciu, A.I.; Gadalean, F.; Cretu, O.M.; Vlad, A.; Muntean, D.M.; Bob, F.; Milas, O.; Suteanu, A.; et al. Untargeted Metabolomics by Ultra-High-Performance Liquid Chromatography Coupled with Electrospray Ionization-Quadrupole-Time of Flight-Mass Spectrometry Analysis Identifies a Specific Metabolomic Profile in Patients with Early Chronic Kidney Disease. Biomedicines 2023, 11, 1057.
  57. Zhang, J.; Fuhrer, T.; Ye, H.; Kwan, B.; Montemayor, D.; Tumova, J.; Darshi, M.; Afshinnia, F.; Scialla, J.J.; Anderson, A.; et al. High-Throughput Metabolomics and Diabetic Kidney Disease Progression: Evidence from the Chronic Renal Insufficiency (CRIC) Study. Am. J. Nephrol. 2022, 53, 215–225.
  58. Vanweert, F.; Schrauwen, P.; Phielix, E. Role of branched-chain amino acid metabolism in the pathogenesis of obesity and type 2 diabetes-related metabolic disturbances BCAA metabolism in type 2 diabetes. Nutr. Diabetes 2022, 12, 35.
  59. Masania, J.; Faustmann, G.; Anwar, A.; Hafner-Giessauf, H.; Rajpoot, N.; Grabher, J.; Rajpoot, K.; Tiran, B.; Obermayer-Pietsch, B.; Winklhofer-Roob, B.M.; et al. Urinary Metabolomic Markers of Protein Glycation, Oxidation, and Nitration in Early-Stage Decline in Metabolic, Vascular, and Renal Health. Oxid. Med. Cell Longev. 2019, 2019, 4851323.
  60. Mills, E.L.; Kelly, B.; Logan, A.; Costa, A.S.H.; Varma, M.; Bryant, C.E.; Tourlomousis, P.; Däbritz, J.H.M.; Gottlieb, E.; Latorre, I.; et al. Succinate Dehydrogenase Supports Metabolic Repurposing of Mitochondria to Drive Inflammatory Macrophages. Cell 2016, 167, 457–470.e13.
  61. Chouchani, E.T.; Pell, V.R.; Gaude, E.; Aksentijević, D.; Sundier, S.Y.; Robb, E.L.; Logan, A.; Nadtochiy, S.M.; Ord, E.N.J.; Smith, A.C.; et al. Ischaemic accumulation of succinate controls reperfusion injury through mitochondrial ROS. Nature 2014, 515, 431–435.
  62. Ye, Z.; Wang, S.; Zhang, C.; Zhao, Y. Coordinated Modulation of Energy Metabolism and Inflammation by Branched-Chain Amino Acids and Fatty Acids. Front. Endocrinol. 2020, 11, 559087.
  63. Reiss, A.B.; De Leon, J.; Pan, X. The Roles of Fatty Acids and Apolipoproteins in the Kidneys. Metabolites 2022, 12, 462.
  64. Sun, Y.; Zhou, C.; Chen, Y.; He, X.; Gao, F.; Xue, D. Quantitative increase in short-chain fatty acids, especially butyrate protects kidney from ischemia/reperfusion injury. J. Investig. Med. 2022, 70, 29–35.
  65. Cui, F.Q.; Wang, Y.F.; Gao, Y.B.; Meng, Y.; Cai, Z.; Shen, C.; Liu, Z.Q.; Jiang, X.C.; Zhao, W.J.; Zhao, R. Effects of BSF on Podocyte Apoptosis via Regulating the ROS-Mediated PI3K/AKT Pathway in DN. J. Diabetes Res. 2019, 2019, 9512406.
  66. Franiek, A.; Sharma, A.; Cockovski, V.; Wishart, D.S.; Zappitelli, M.; Blydt-Hansen, T.D. Urinary metabolomics to develop predictors for pediatric acute kidney injury. Pediatr. Nephrol. 2022, 37, 2079–2090.
  67. Scalabre, A.; Clément, Y.; Guillière, F.; Ayciriex, S.; Gaillard, S.; Demède, D.; Bouty, A.; Lanteri, P.; Mure, P.Y. Early detection of ureteropelvic junction obstruction in neonates with prenatal diagnosis of renal pelvis dilatation using 1H NMR urinary metabolomics. Sci. Rep. 2022, 12, 13406.
More
Information
Contributors MDPI registered users' name will be linked to their SciProfiles pages. To register with us, please refer to https://encyclopedia.pub/register : , , , , ,
View Times: 251
Revisions: 2 times (View History)
Update Date: 13 Nov 2023
1000/1000
Video Production Service