Submitted Successfully!
To reward your contribution, here is a gift for you: A free trial for our video production service.
Thank you for your contribution! You can also upload a video entry or images related to this topic.
Version Summary Created by Modification Content Size Created at Operation
1 -- 1627 2023-08-14 04:20:12 |
2 layout Meta information modification 1627 2023-08-14 08:26:06 |

Video Upload Options

Do you have a full video?

Confirm

Are you sure to Delete?
Cite
If you have any further questions, please contact Encyclopedia Editorial Office.
Shi, Y.; Wang, D.; Wang, X.; Chen, B.; Ding, C.; Gao, S. Sensing Travel Source–Sink Spatiotemporal Ranges. Encyclopedia. Available online: https://encyclopedia.pub/entry/48013 (accessed on 30 June 2024).
Shi Y, Wang D, Wang X, Chen B, Ding C, Gao S. Sensing Travel Source–Sink Spatiotemporal Ranges. Encyclopedia. Available at: https://encyclopedia.pub/entry/48013. Accessed June 30, 2024.
Shi, Yan, Da Wang, Xiaolong Wang, Bingrong Chen, Chen Ding, Shijuan Gao. "Sensing Travel Source–Sink Spatiotemporal Ranges" Encyclopedia, https://encyclopedia.pub/entry/48013 (accessed June 30, 2024).
Shi, Y., Wang, D., Wang, X., Chen, B., Ding, C., & Gao, S. (2023, August 14). Sensing Travel Source–Sink Spatiotemporal Ranges. In Encyclopedia. https://encyclopedia.pub/entry/48013
Shi, Yan, et al. "Sensing Travel Source–Sink Spatiotemporal Ranges." Encyclopedia. Web. 14 August, 2023.
Sensing Travel Source–Sink Spatiotemporal Ranges
Edit

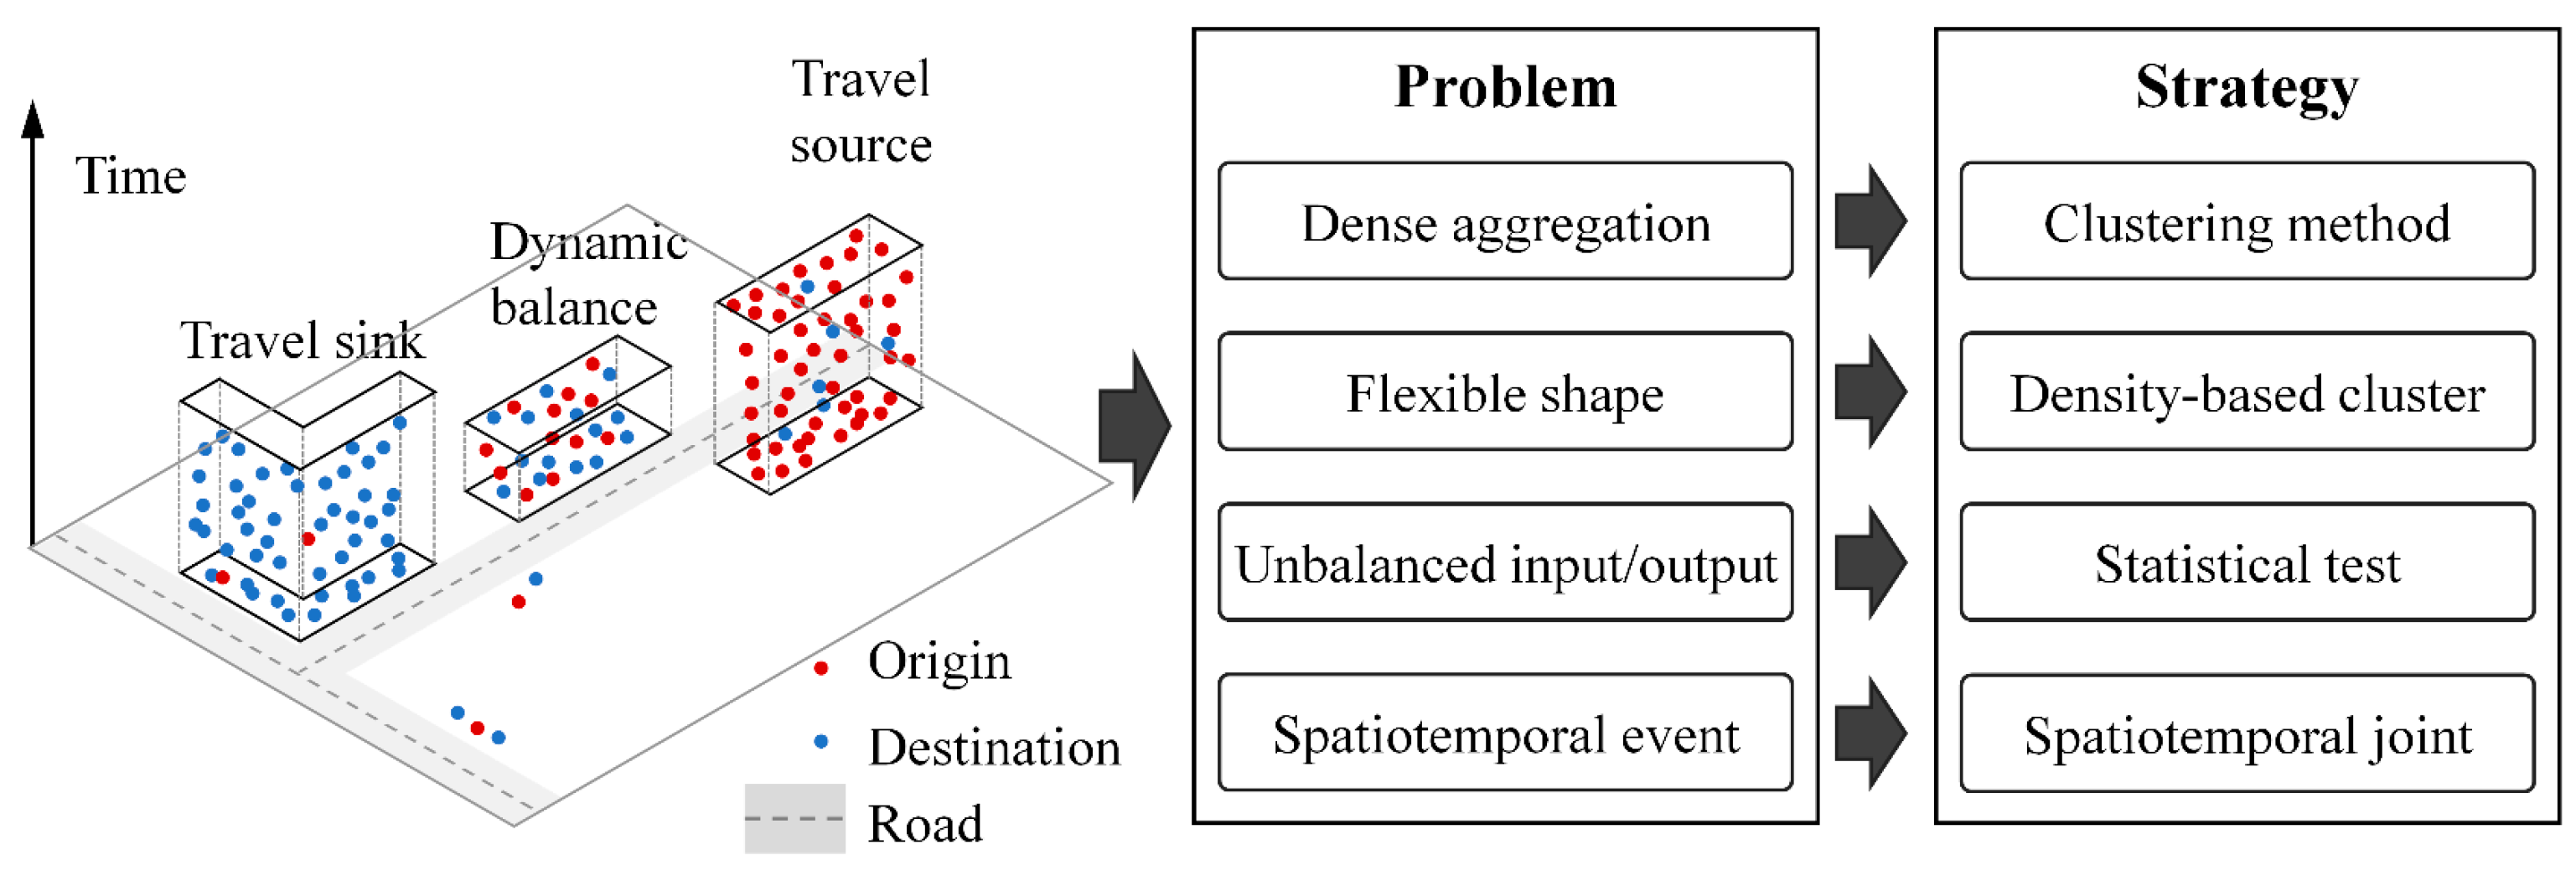
Urban remote sensing is providing increasing theoretical and empirical evidence for addressing urban issues, such as traffic systems, medical health, and green spaces. Plentiful image remote sensing technologies have effectively supported the large-scale detection of urban facility distribution. However, cities do not entail only the coverage distribution of buildings, impervious surfaces, parks, and other facilities on the land, but also complex human activities among these urban facilities.  Correspondingly, the sensing of human activity phenomena is an emerging exploration in urban remote sensing. The travel source–sink phenomenon is a typical urban traffic anomaly that reflects the imbalanced dissipation and aggregation of human mobility activities. It is useful for pertinently balancing urban facilities and optimizing urban structures to accurately sense the spatiotemporal ranges of travel source–sinks, such as for public transportation station optimization, sharing resource configurations, or stampede precautions among moving crowds. 

urban remote sensing urban human mobility spatiotemporal cluster

1. Introduction

To date, population patterns and facilities have become more concentrated and complex and need to be considered in terms of sustainable urbanization. Unfortunately, the imbalanced relationship between human activities and facility resources can lead to persistent congestion and high energy consumption, which brings enormous challenges to sustainability in highly urbanized development [1][2]. With the revival of the sharing concept, the public has realized that public transportation, such as buses, taxis, and shared bicycles, has an important role in saving transportation resources and relieving intensive transportation [3][4]. Empirical studies have shown that public transportation effectively reduces urban traffic congestion and resource waste [5][6]. The basis for ensuring the sustainability of public transportation is the dynamic balance of public transportation and resource recycling [7].
As a highly variable urban subsystem, transportation is more susceptible to imbalanced human–land relationships [8][9]. A large number of anomalous dissipations or aggregations may emerge among human individuals commuting through different urban areas. This significantly imbalanced phenomenon in the number of people entering and exiting in a short period is called a travel source–sink [10], which may occur due to the attraction of major activities or sudden disasters. The travel source and sink of taxis represent areas where human departure and arrival preferences are different, which is conducive to the timely adjustment of taxis’ supply to improve the travel efficiency in demand-excess areas, and reduce taxi resource waste in supply excess areas [11]. The consequences of shared bicycles’ travel source–sink patterns are even worse, because they lack one-to-one drivers to dispatch each bicycle to urgently requisite areas in real time. Therefore, a large number of flexible, dockless shared bicycles often appear to show an anomalous scarcity or accumulation phenomena in important travel areas, such as residences, workplaces, or transit hubs [12]. Travel source–sink areas and periods of sharing transportation resources can clearly indicate the target extents that need to be reallocated by external manual forces, providing accurate references and insights into unusual events for maintaining urban traffic health. It is important to optimize the sustainable circulation of limited transportation resources, which can further promote the sustainable urban development goals of cities and communities given current global concerns.
Encouragingly, urban remote sensing is providing increasing theoretical and empirical evidence for addressing urban issues, such as traffic systems, medical health, and green spaces [13][14][15]. Plentiful image remote sensing technologies have effectively supported the large-scale detection of urban facility distribution [16]. However, cities do not entail only the coverage distribution of buildings, impervious surfaces, parks, and other facilities on the land, but also complex human activities among these urban facilities [17][18]. Correspondingly, the sensing of human activity phenomena is an emerging exploration in urban remote sensing [19][20]. Floating car trajectory is considered to be generalized remote sensing that senses human activities and maps human–land relationships with the help of positioning satellites, which has shown an important potential in urban structure analyses [18], vitality monitoring [21], functional area identification [22], and other applications. However, existing studies have mostly treated travel source–sink detection as a spatial count problem of geographic units with a specified shape [10][23], which makes it hard to distinguish shape-flexible travel source–sink patterns from dynamic, balanced hotspots. In fact, a travel source–sink area can be regarded as a dense aggregation area of a single variate, whose number is plenarily dominant relative to another variate. Thus, as shown in Figure 1, travel source–sink ranges can be detected through a bivariate cluster with a significantly biased single variate.
Figure 1. The structure of the problem and strategy for travel source–sink detection.

2. Sensing Travel Source–Sink Spatiotemporal Ranges

A large amount of available floating car trajectory data has been utilized to extract human travel origin and destination (OD) and to measure the source–sink level of a selected area [10]. According to different spatial extraction strategies, the existing travel source–sink detection methods can be divided into unit feature measurement-based and point event clustering-based methods.
Unit feature measurement-based methods first use time slices and road networks or spatial grids to divide a study area into geographic basic units. Based on this, a statistical index of these geographic basic units is constructed to measure the imbalanced degree between inflow and outflow. Liu et al. [10] evenly divided a study area into 1 km grids to calculate the time series of the difference between the inflow and outflow of each grid, and then the k-means algorithm [24] was used to classify the spatial grids into six typical source–sink patterns. Gao et al. [25] focused on the imbalanced distribution of bicycle-sharing supply and demand around subway stations. Based on the outflow and inflow, a ratio index of grids was constructed to cluster the source–sink areas into five different patterns. In addition to spatial grids, administrative districts [17], functional areas [22], and blocks [9] are also commonly used as spatial units for measuring human mobility. For example, Fang et al. [23] used mobile phone signal data received by towers to calculate cumulative net flow, further revealing the temporal stability of the sources and sinks of different signal towers. Dividing geographic units is a common preprocessing approach before sensing geographical phenomena [26]. However, as shown in Figure 2, the pre-set boundaries of geographic basic units are prone to rigidly dividing continuous intensive source–sink areas, resulting in a serious underestimation of the source or sink level. At the same time, how to determine the size of geographic basic units and the threshold for identifying a source–sink area is a supervise-hard problem, which brings obstacles to the generalizability and interpretability of unit feature measurement-based methods.
Figure 2. Geographic basic unit boundaries lead to source–sink underestimation.
Point event clustering-based methods avoid the difficulties of spatiotemporal division by aggregating OD point positions to form continuous dense areas or periods with significantly imbalanced inflow and outflow. Existing univariate trajectory point event clustering has been widely used in many scenarios, such as travel hotspot extraction [27], accident-prone area assessment [28], and traffic congestion detection [29]. Clustering-based source–sink detection methods belong to binary variable clustering tasks and can be used to detect symbiotic or imbalanced relationships between two variables. When the travel flows from different sources are treated as binary variables for clustering, an imbalanced flow relationship indicates significant competition between two types of flows, while a similar flow relationship indicates that they are in a coordinated, symbiotic relationship [30][31]. A large number of spatial statistical clustering methods have been utilized to aggregate different types of flow aggregation [30][31][32][33], while other methods are still rare. Similarly, performing clustering with O points and D points as binary variables can detect imbalanced relationships between inflow and outflow, which is useful for discovering potential interest areas with scarce or abundant transportation resources. Liu et al. [34] constructed a spatial scan statistic in a road network and used a Monte Carlo simulation to evaluate the significance of the source–sink area aggregation via multi-directional optimization operations, eventually extracting the volcano and black hole patterns formed by the imbalanced distribution of motor vehicle OD points in the urban road network space. However, the computational cost of a Monte Carlo simulation and multi-directional optimization operations is too high for computers [31]. Density-based clustering algorithms may be a possible choice, because density calculation and core point extension can be rapidly performed with the help of spatial indexing techniques. However, several pre-set critical parameters may unconsciously affect the clustering detection results of density-based clustering. Although there are interactive parameter recommendation schemes, this is still a manual process and is limited in terms of estimating the migration at different study areas [35]. Pei et al. [36] extended the DBSCAN algorithm [37], which is applicable to two types of point data, and found three kinds of taxi OD density relationships using a spatial point database.
Existing point event clustering-based methods [29][30][31][32][33][34][36] provide encouraging references for identifying OD distribution imbalances; however, there are still several challenges in quickly and adaptively identifying travel source–sink areas with any shape in a complicated urban space. Firstly, spatial statistical-based clustering methods [30][33] do not perform well in detecting arbitrarily shaped OD clustering areas, such as linear, T-shaped, or cross-shaped areas, which always appear in a traffic network space [31]. In addition, how these methods can efficiently process large spatial databases has not been properly addressed. Secondly, density-based clustering methods can overcome the problem of identifying clusters of any shape by treating trajectory points as dense-level test objects, but how to avoid multiple sensitive parameters is still a challenge, especially when analysts lack clear prior knowledge about the OD point datasets being used. Finally, the source–sink temporal feature is ignored by existing point event clustering-based methods, which project OD points over a long period onto a spatial surface [29][36]. Utilizing spatial clustering to detect source–sink areas will result in OD points in the same source or sink area, which will not be continuous and tight in timestamps. Only by accurately indicating the life period and space location of source–sink areas can the optimization of anomalous imbalanced traffic phenomena be effectively supported.

References

  1. Wang, M.; Debbage, N. Urban Morphology and Traffic Congestion: Longitudinal Evidence from US Cities. Comput. Environ. Urban Syst. 2021, 89, 101676.
  2. Cao, C.; Zhen, F.; Huang, X. How Does Perceived Neighborhood Environment Affect Commuting Mode Choice and Commuting CO2 Emissions? An Empirical Study of Nanjing, China. Int. J. Environ. Res. Public Health 2022, 19, 7649.
  3. Coretti Sanchez, N.; Martinez, I.; Alonso Pastor, L.; Larson, K. On the Simulation of Shared Autonomous Micro-Mobility. Commun. Transp. Res. 2022, 2, 100065.
  4. Gao, K.; Yang, Y.; Gil, J.; Qu, X. Data-Driven Interpretation on Interactive and Nonlinear Effects of the Correlated Built Environment on Shared Mobility. J. Transp. Geogr. 2023, 110, 103604.
  5. Nieuwenhuijsen, M.J. Urban and Transport Planning Pathways to Carbon Neutral, Liveable and Healthy Cities; A Review of the Current Evidence. Environ. Int. 2020, 140, 105661.
  6. Zhao, X.; Ke, Y.; Zuo, J.; Xiong, W.; Wu, P. Evaluation of Sustainable Transport Research in 2000-2019. J. Clean Prod. 2020, 256, 120404.
  7. Bardaka, E.; Hajibabai, L.; Singh, M.P.; Murukannaiah, P.K. Reimagining Ride Sharing: Efficient, Equitable, Sustainable Public Microtransit. IEEE Internet Comput. 2020, 24, 38–44.
  8. Wang, Y.; Tong, D.; Li, W.; Liu, Y. Optimizing the Spatial Relocation of Hospitals to Reduce Urban Traffic Congestion: A Case Study of Beijing. Trans. GIS 2019, 23, 365–386.
  9. Liu, B.; Deng, M.; Yang, J.; Shi, Y.; Huang, J.; Li, C.; Qiu, B. Detecting Anomalous Spatial Interaction Patterns by Maximizing Urban Population Carrying Capacity. Comput. Environ. Urban Syst. 2021, 87, 101616.
  10. Liu, Y.; Wang, F.; Xiao, Y.; Gao, S. Urban Land Uses and Traffic ‘Source-Sink Areas’: Evidence from GPS-Enabled Taxi Data in Shanghai. Landsc. Urban Plan. 2012, 106, 73–87.
  11. Liu, Z.; Li, J.; Wu, K. Context-Aware Taxi Dispatching at City-Scale Using Deep Reinforcement Learning. IEEE Trans. Intell. Transp. Syst. 2022, 23, 1996–2009.
  12. Jia, R.; Chamoun, R.; Wallenbring, A.; Advand, M.; Yu, S.; Liu, Y.; Gao, K.; Jia, R.; Chamoun, R.; Wallenbring, A.; et al. A Spatio-Temporal Deep Learning Model for Short-Term Bike-Sharing Demand Prediction. Electron. Res. Arch. 2023, 31, 1031–1047.
  13. Cai, Y.; Zhang, M.; Lin, H. Estimating the Urban Fractional Vegetation Cover Using an Object-Based Mixture Analysis Method and Sentinel-2 MSI Imagery. IEEE J. Sel. Top. Appl. Earth Observ. Remote Sens. 2020, 13, 341–350.
  14. Guo, Y.; Wu, C.; Du, B.; Zhang, L. Density Map-Based Vehicle Counting in Remote Sensing Images with Limited Resolution. ISPRS-J. Photogramm. Remote Sens. 2022, 189, 201–217.
  15. Chen, J.; Dai, X.; Guo, Y.; Zhu, J.; Mei, X.; Deng, M.; Sun, G. Urban Built Environment Assessment Based on Scene Understanding of High-Resolution Remote Sensing Imagery. Remote Sens. 2023, 15, 1436.
  16. Yao, S.; Li, L.; Cheng, G.; Zhang, B. Analyzing Long-Term High-Rise Building Areas Changes Using Deep Learning and Multisource Satellite Images. Remote Sens. 2023, 15, 2427.
  17. Liu, X.; Gong, L.; Gong, Y.; Liu, Y. Revealing Travel Patterns and City Structure with Taxi Trip Data. J. Transp. Geogr. 2015, 43, 78–90.
  18. Xu, J.; Liu, J.; Xu, Y.; Lv, Y.; Pei, T.; Du, Y.; Zhou, C. Identification of Spatial and Functional Interactions in Beijing Based on Trajectory Data. Appl. Geogr. 2022, 145, 102744.
  19. Liu, Y.; Liu, X.; Gao, S.; Gong, L.; Kang, C.; Zhi, Y.; Chi, G.; Shi, L. Social Sensing: A New Approach to Understanding Our Socioeconomic Environments. Ann. Assoc. Am. Geogr. 2015, 105, 512–530.
  20. Liu, Q.; Huan, W.; Deng, M. A Method with Adaptive Graphs to Constrain Multi-View Subspace Clustering of Geospatial Big Data from Multiple Sources. Remote Sens. 2022, 14, 4394.
  21. Zhang, Z.; Zhang, Y.; He, T.; Xiao, R. Urban Vitality and Its Influencing Factors: Comparative Analysis Based on Taxi Trajectory Data. IEEE J. Sel. Top. Appl. Earth Observ. Remote Sens. 2022, 15, 5102–5114.
  22. Pan, G.; Qi, G.; Wu, Z.; Zhang, D.; Li, S. Land-Use Classification Using Taxi GPS Traces. IEEE Trans. Intell. Transp. Syst. 2013, 14, 113–123.
  23. Fang, Z.; Yang, X.; Xu, Y.; Shaw, S.-L.; Yin, L. Spatiotemporal Model for Assessing the Stability of Urban Human Convergence and Divergence Patterns. Int. J. Geogr. Inf. Sci. 2017, 31, 2119–2141.
  24. Macqueen, J. Some Methods for Classification and Analysis of Multivariate Observations. In Proceedings of the Fifth Berkeley Symposium on Mathematical Statistics and Probability, Oakland, CA, USA, 27 December–7 January 1967; pp. 281–297.
  25. Gao, Y.; Song, C.; Guo, S.; Pei, T. Spatial-temporal Characteristics and Influencing Factors of Source and Sink of Dockless Sharing Bicycles Connected to Subway Stations. J. Geo-Inf. Sci. 2021, 23, 155–170.
  26. Openshaw, S. The Modifiable Areal Unit Problem. Concepts and Techniques in Modern Geography; GeoBooks: Norwich, UK, 1984; p. 38.
  27. Zhao, P.; Qin, K.; Ye, X.; Wang, Y.; Chen, Y. A Trajectory Clustering Approach Based on Decision Graph and Data Field for Detecting Hotspots. Int. J. Geogr. Inf. Sci. 2017, 31, 1101–1127.
  28. Steenberghen, T.; Dufays, T.; Thomas, I.; Flahaut, B. Intra-Urban Location and Clustering of Road Accidents Using GIS: A Belgian Example. Int. J. Geogr. Inf. Sci. 2004, 18, 169–181.
  29. Shi, Y.; Wang, D.; Tang, J.; Deng, M.; Liu, H.; Liu, B. Detecting Spatiotemporal Extents of Traffic Congestion: A Density-Based Moving Object Clustering Approach. Int. J. Geogr. Inf. Sci. 2021, 35, 1449–1473.
  30. Tao, R.; Thill, J.-C. Flow Cross K-Function: A Bivariate Flow Analytical Method. Int. J. Geogr. Inf. Sci. 2019, 33, 2055–2071.
  31. Liu, W.; Liu, Q.; Yang, J.; Deng, M. A Network-Constrained Clustering Method for Bivariate Origin-Destination Movement Data. Int. J. Geogr. Inf. Sci. 2023, 37, 767–787.
  32. Liu, Q.; Yang, J.; Deng, M.; Liu, W.; Xu, R. BiFlowAMOEBA for the Identification of Arbitrarily Shaped Clusters in Bivariate Flow Data. Int. J. Geogr. Inf. Sci. 2022, 36, 1784–1808.
  33. Gao, Y.; Li, T.; Wang, S.; Jeong, M.-H.; Soltani, K. A Multidimensional Spatial Scan Statistics Approach to Movement Pattern Comparison. Int. J. Geogr. Inf. Sci. 2018, 32, 1304–1325.
  34. Liu, Q.; Wu, Z.; Deng, M.; Liu, W.; Liu, Y. Network-Constrained Bivariate Clustering Method for Detecting Urban Black Holes and Volcanoes. Int. J. Geogr. Inf. Sci. 2020, 34, 1903–1929.
  35. Song, C.; Pei, T.; Ma, T.; Du, Y.; Shu, H.; Guo, S.; Fan, Z. Detecting Arbitrarily Shaped Clusters in Origin-Destination Flows Using Ant Colony Optimization. Int. J. Geogr. Inf. Sci. 2019, 33, 134–154.
  36. Pei, T.; Wang, W.; Zhang, H.; Ma, T.; Du, Y.; Zhou, C. Density-Based Clustering for Data Containing Two Types of Points. Int. J. Geogr. Inf. Sci. 2015, 29, 175–193.
  37. Ester, M.; Kriegel, H.P.; Sander, J.; Xiaowei, X. A Density-Based Algorithm for Discovering Clusters in Large Spatial Databases with Noise. KDD 1996, 96, 226–231.
More
Information
Subjects: Others
Contributors MDPI registered users' name will be linked to their SciProfiles pages. To register with us, please refer to https://encyclopedia.pub/register : , , , , ,
View Times: 133
Revisions: 2 times (View History)
Update Date: 14 Aug 2023
1000/1000
Video Production Service