Your browser does not fully support modern features. Please upgrade for a smoother experience.
Submitted Successfully!
 +1 credit
Thank you for your contribution! You can also upload a video entry or images related to this topic.
For video creation, please contact our Academic Video Service.
| Version | Summary | Created by | Modification | Content Size | Created at | Operation |
|---|---|---|---|---|---|---|
| 1 | Giuseppe Cantisani | -- | 3255 | 2023-08-11 15:25:12 | | | |
| 2 | Rita Xu | Meta information modification | 3255 | 2023-08-15 04:12:39 | | |
Video Upload Options
We provide professional Academic Video Service to translate complex research into visually appealing presentations. Would you like to try it?
Cite
If you have any further questions, please contact Encyclopedia Editorial Office.
Cantisani, G.; Del Serrone, G.; Mauro, R.; Peluso, P.; Pompigna, A. Traffic Stream Analysis by Radar Sensors. Encyclopedia. Available online: https://encyclopedia.pub/entry/47968 (accessed on 27 June 2026).
Cantisani G, Del Serrone G, Mauro R, Peluso P, Pompigna A. Traffic Stream Analysis by Radar Sensors. Encyclopedia. Available at: https://encyclopedia.pub/entry/47968. Accessed June 27, 2026.
Cantisani, Giuseppe, Giulia Del Serrone, Raffaele Mauro, Paolo Peluso, Andrea Pompigna. "Traffic Stream Analysis by Radar Sensors" Encyclopedia, https://encyclopedia.pub/entry/47968 (accessed June 27, 2026).
Cantisani, G., Del Serrone, G., Mauro, R., Peluso, P., & Pompigna, A. (2023, August 11). Traffic Stream Analysis by Radar Sensors. In Encyclopedia. https://encyclopedia.pub/entry/47968
Cantisani, Giuseppe, et al. "Traffic Stream Analysis by Radar Sensors." Encyclopedia. Web. 11 August, 2023.
Copy Citation
Traffic flow measurement technologies, such as detection stations, radar guns, or video cameras, have been used over the years to detect the level of traffic and the operating conditions. This type of sensor can record a large amount of data which is useful to evaluate and monitor road traffic conditions, and it is possible to identify free-moving and constrained vehicles by processing the collected data.
traffic radar sensors
two-lane roads
free-moving and constrained vehicles
1. Introduction
Two-lane highways are a crucial part of the road network in many countries and are widely used for both systematic and non-systematic daily travel. Often, these roads make up the most extensive sub-network in a country’s transportation system, enabling higher-level infrastructures, such as freeways, railways, ports, and airports, to be reached even in the most remote areas [1]. As urbanization spreads and traffic demand increases, two-lane highways face new challenges that require innovative and cost-effective solutions to improve operational and safety performance [2]. This goal can be achieved through the access to high-resolution data encompassing those recorded by the widespread of cost-effective traffic monitoring systems, such as radar sensors [3]. The traffic control units are local traffic controllers which generate a complete overview of traffic, weather and road conditions, using the sensors connected to it [4]. Advanced signal processing algorithms, indeed, provide detailed and precise data, regardless of the sensing technology employed (traffic sensors: inductive, sunk into the road, or microwave, installed above the road; video cameras: numberplate recognition and Closed-Circuit TeleVision (CCTV); weather sensors, etc.) [5]. In addition to the advanced technological aspect, these sensors are easy to install on the roadside, non-intrusive, high performance, low power, and provide a large amount of information to be processed. These characteristics make them advantageous systems for monitoring the network. Thus, researchers can conduct comprehensive analyses of driver behavior in diverse traffic and road conditions over extended time periods.
One of the critical issues of two-lane highways is that passing occurs in the opposing lane of traffic, which has serious implications for traffic operation and safety. The limited passing opportunities result in a high level of interaction between vehicles, especially with the slow-moving ones. Therefore, it is essential to develop comprehensive models and metrics for performance analyses on this type of road, and to identify deficiencies and improve performances. Car-following models, within which each vehicle tries to maintain a desired time headway and speed behind the lead vehicle, attempt to simulate these interactions: drivers, in fact, continuously adjust their speeds based on their perceptions of the surroundings, the proximity to the desired speed, and the dynamics of the relationship with the lead vehicle [6]. The possibility of maintaining the desired speed depends on the presence of slower vehicles and on the option to overtake using the opposite lane. This interaction is particularly acute when both traffic flow and the percentage of slower vehicles increase, leading to vehicle platoons [7].
Understanding platooning behavior is crucial to modeling and analyzing traffic flow on two-lane highways accurately, as platoons can significantly affect operational performance and traffic flow. A platoon can be defined as a group of vehicles that travel together on the road, where following drivers adjust their speed, spacing, and acceleration according to the lead vehicle. As a result of these behavior dynamics, vehicles in the traffic stream can be grouped into two categories:
-
A single vehicle or a platoon leader, which maintains a sufficiently large spatial and temporal headway with respect to the preceding vehicle, avoiding any influence from it and be able to travel at its desired or maximum speed at that moment.
-
A platoon follower, which is unable to proceed at the desired speed and adjusts its driving behavior to follow the preceding vehicle (the platoon leader or another platoon component), while maintaining a reduced spatial and temporal detachment under its influence.
Passing lanes can mitigate the platoon impact on two-lane highways with high traffic levels, but they are not always available. For this reason, drivers may become frustrated and tend to accept smaller gaps in the opposing traffic to perform risky passing maneuvers, which can lead to head-on collisions. The average time that all vehicles delayed while traveling in platoons due to their inability to overtake was introduced in the 1985 edition of Highway Capacity Manual (HCM) [8] in terms of headways less than critical values. Even though threshold values have changed over the years and a new concept of Follower Density (FD) was introduced in the last edition [9], the threshold time headway for characterizing a vehicle in a non-free condition, i.e., constrained in a platoon, is a crucial element for analyzing two-lane roads according to the HCM.
Time headway is a common parameter for studying vehicle behavior in a single-lane traffic stream, and the threshold value is an extremely widespread approach to distinguish free-moving vehicles from platooned vehicles. As shown in Figure 1, the time headway hti of vehicle i + 1 is defined as the absolute passing time of vehicle i + 1 minus the absolute passing time of vehicle i, traveling in front of vehicle i + 1 (a); hti is the sum of the time gap gti and the occupation time ρi, where gti is the time between the rear of the lead vehicle and the front of the following vehicle and ρi is the time for the entire vehicle to pass the section. Headway can also be referred to in terms of distances between vehicles (b), and this is called spatial headway or spacing hsi, which is the distance from the front of one vehicle to the front of the previous one; hsi is equal to space gap gsi in addition to the length of the vehicle li.
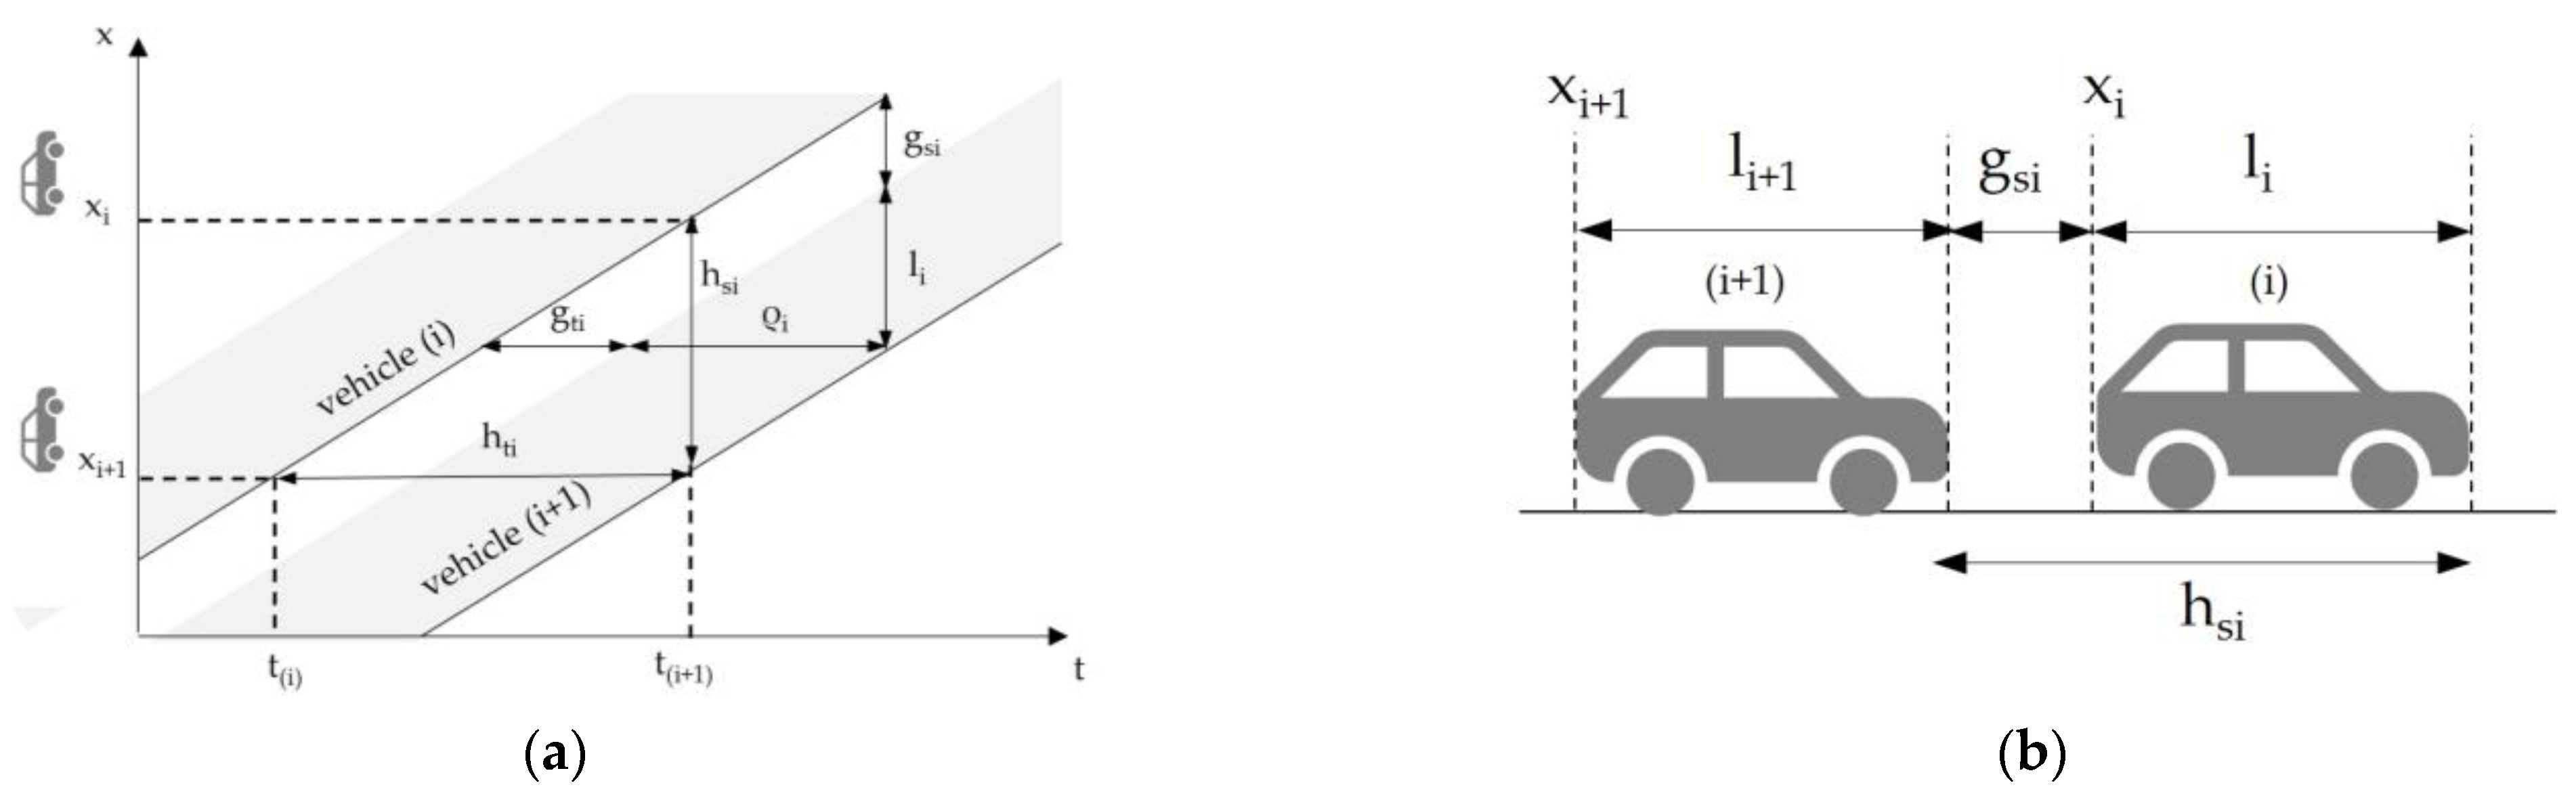
Figure 1. Time (a) and space (b) headways.
Different studies have proposed critical headway values to define vehicles that can travel at their desired speeds under free-flowing conditions. These vehicles are important for various applications in traditional traffic analyses and intelligent transportation systems [10][11]. In this variety of works and values, researchers can distinguish two approaches to identify the threshold time headway in a single-line traffic stream, which refer to two different objectives and can be swayed toward two opposite extremes:
-
The ones oriented toward identifying the Level Of Service (LOS) through the calculation of a Percentage of Time Spent Following (PTSF) in a platoon, the FD of vehicles in platoons, or even the Percentage of Followers (PF) in platoons. A not quite high value has to be taken, to avoid penalizing the analysis of traffic conditions by assigning the role of follower vehicles to those that are not actually impacted in their movements.
-
The ones oriented toward defining Free-Flow Speed (FFS) or Operating Speed (V85), setting a threshold to be used as a filter to screen conditioned vehicles and select only those that can be considered in free movement. In this case, the value must be not quite low, to avoid considering vehicles that are included within a platoon.
2. Road Sensor Technology for Monitoring Vehicle Traffic
The management and monitoring activities of a road network require managers to collect data regarding the operational and actual conditions of the infrastructure. To date, scientific literature indicates that there are several data collection techniques, which can be briefly distinguished into static and dynamic ones [12]. The first technique uses devices installed in a fixed section of the road, and information, such as speed, volume, and traffic density, are collected for the entire vehicular flow [13][14]. In contrast, the second method consists mainly of probe vehicles, which have on-board GPS devices capable of sending real-time and high-frequency data about their motion [13]. It is shown that probe vehicles have the advantage of providing travel information along the entire road infrastructure; however, this information comes only from vehicles equipped with innovative devices, while the static technologies are limited to the survey section but provide information on the entire vehicular fleet [15][16].
3. Vehicular Conditioning
As stated in the Introduction section, a considerable amount of research has been conducted in the last 60 years to determine the threshold headway that identifies free-moving vehicles and separates constrained and non-constrained traffic situations for vehicles traveling on the same lane. Below, researchers present a chronological review of the main works that have addressed this issue, outlining the primary objectives of each study and the threshold values identified or suggested over time.
Miller (1961) [17] proposed a random queue model, using data from the Swedish State Roads Institute collected on a straight section of a two-lane road. The study concluded that free-flow conditions are established when the traffic flow rate is very low and vehicles can overtake freely, with a headway value of 8 s. When time intervals are less than 8 s, the study considered a second criterion based on the relative velocities between consecutive vehicles to determine constrained conditions in moving queues.
Wasielewski [18] examined a semi-Poisson time headway distribution model, suggesting a 6–8 s headway for two-lane roads and a 4 s headway for freeways.
Radwan and Kalevela (1985) [19] identified a headway greater than 6.5 s to classify non-following conditions between different classes of vehicles.
McLean (1989) [20] stated that drivers on two-lane roads are affected by the presence of the vehicle ahead of them for headways of 9 s or less.
Lam et al., (1990) [21] compared operating speeds on dry and wet pavements of two-lane rural highways in New York state. They filtered free-moving vehicles considering vehicles with a minimum time gap of about 6 s or those heading a platoon of vehicles.
In 1991, Pursula and Enberg [22] conducted an analysis of speed-flow relationships, time headways, and platooning of traffic on two-lane rural roads in Finland. They used the platoon criterion of a 5 s time headway between successive vehicles for characteristics and level-of-service estimation.
Bennet et al., in 1994 [23] investigated critical headways at 58 study sites in New Zealand using different techniques to find the threshold. They identified a value between 3.0 and 4.5, recommending a value of 4.5 s to ensure that few following vehicles are misclassified as free.
Gattis et al., in 1997 [24] studied the behaviors of motorists. They considered a threshold headway value of 5 s between vehicles for platoon formation. They reviewed other studies by Messer and Morrall (1983) [25], Hoban (1983) [26], Guell and Virkler (1988) [27] in which the headway time used to define delay at two-lane highways varies from 3.5 s to 6 s and observed that a headway greater than 3 s may indicate a reduced desire to pass.
Dijker et al., in 1998 [28] analyzed differences in car following between congested and non-congested flows on Dutch roads and identified a critical gap value of 3.5 s for passenger cars and 5 s for trucks.
Vogel in 2002 [29] introduced a method that allows for establishing a threshold for free vehicles and determining how strongly the speed of the lead vehicle influences the speed of the following vehicle at a given headway in urban areas. The results suggested a time headway of 6 s as optimal for distinguishing between free and following vehicles for roads where traffic operates under capacity.
Van As in 2003 [30] selected 3.5 s as the threshold value to separate followers from platoon leaders on two-lane undivided roads in South Africa. Fifty percent of following vehicles have a headway of less than 3.5 s, 80% less than 4 s, and 99% less than 6 s.
Susarak et al., in 2004 [31] introduced platoon characteristics to measure traffic circulation quality on Tomey Express near Tokyo. They investigated new platoon criteria and platoon behavior and determined a critical headway relative speed method and exponential model. Based on the results on 18 sites, they defined a headway threshold of 3 s for passenger cars and 4 s for heavy vehicles.
In 2005, Fitzpatrick et al. [32] calculated free-flow speed at 79 tangent sites in suburban/urban and rural areas in six U.S. states by considering free-flowing vehicles as having at least a 5 s headway.
In 2005, Tseng et al. [33] determined the free-flow speed on Taiwan’s rural and suburban highways by considering vehicles traveling with a headway greater than 5 s as vehicles in free-flow condition.
Figueroa and Tarko in 2005 [34] identified a headway greater than or equal to 5 s as the point at which vehicles travel in free-flow conditions on the tangent segment and horizontal curve, considering 158 spots on U.S. two-lane rural highway segments.
Al-Kaisy and Karjala in 2008 [35] presented an empirical investigation into performance indicators on two-lane rural highways using field data from four study sites in the state of Montana. They calculated the free-flow speed by averaging the speed of all free-moving vehicles traveling with headways greater than 8 s, and the percent of follower vehicles was calculated considering vehicles traveling with headways less than 3 s.
Al-Kaisy and Durbin in 2009 [36] investigated vehicular platoons on two-lane highways in Montana. The results showed that the increase in speeds is more notable at short headways, and it diminishes when headways reach a value in the range of 5 to 7 s.
Lay in 2009 [37] suggested that drivers are affected by the presence of the vehicle ahead for headways of 9 s or less. Thus, he argued that the critical headway is still a matter of some debate with values quoted between 2.5 and 9 s, and with a best estimate of 4 s, and most in the range from 3.0 to 4.5 s.
Al-Kaisy and Karjala in 2010 [10] examined car-following interaction and the definition of free-moving vehicles on two-lane rural highways at eight study sites in Montana State. Empirical observations suggest that the car-following interactions on two-lane rural highways generally cease beyond a headway value of 6 s.
Hashim in 2011 [38] analyzed speed characteristics on two-lane rural highways in Egypt and investigated the relationship between 85th percentile speed and headways. A headway value of 5 s revealed the threshold between constrained vehicles and free-moving vehicles.
Lobo et al., in 2011 [39] conducted a study on Portuguese two-lane rural roads to define a gap value between two successive vehicles from which the vehicles can be considered as traveling in a non-platoon condition. They found a free gap of 6 s and highlighted the possible differences that may occur from site to site as a reflection of road geometry and from area to area (city, state, or country) as a function of general driver behavior.
In 2013, Semeida [40] posited that vehicles travel in free-flow conditions with a time headway of at least 8 s when developing new models to evaluate the level of service and capacity of rural multi-lane highways in Egypt.
Robertson et al., in 2014 [41] collected and studied traffic from different sites on freeways and multilane highways within the state of Texas for Level of Service models. Analyzing data from radar devices, they considered no free-flow conditions if the headway is 5 s or greater.
In 2015, Penmetsa et al. [42] studied two-lane intercity highways under mixed traffic conditions in India. It was assumed that vehicles traveling in the same lane with a relative speed of 2 km/h or less were in the car-following model. The gap corresponding to a 50% probability of not following was chosen as the critical gap, which was found to be 2.6 s; a following probability of about 80% considers vehicles with a headway of less than 4 s and 100% less than 5.5 s.
Boora et al., in 2018 [43] identified a headway value of 10 s for free-flow conditions. They introduced a headway and relative speed distribution analysis to define a second criterion for following behavior based on the speed difference between consecutive vehicles. A range of −7 to +15 km/h for the speed difference between the leader and follower was defined by data to identify followers and non-followers among vehicles with a headway of less than 10 s. Then, considering an acceptance curve method and a probability of 50%, a critical headway of 4.2 s was indicated.
Saha et al., in 2019 [44] investigated platoon phenomena on two-lane highways with heterogeneous traffic in northeast India to establish a headway threshold for free-moving vehicles. Their investigation indicated a value of about 6 s under which vehicles form platoons and that few drivers move in a platoon by choice even if they have a gap of more than 6 s and passing opportunities.
Al-Kaisy et al., in 2019 [45] presented an empirical investigation into car-following interactions from 15 study sites in Idaho, Montana, and Oregon. They argued that more aggressive drivers may start to interact with the lead vehicle and adjust their speeds when they are very close to the lead vehicle, while on the other hand, more cautious drivers may start to interact with the lead vehicle and adjust their speeds at a relatively large distance from the lead vehicle. Values for the critical headway are expected in a range that includes aggressive and cautious drivers, are site-specific, with a lower limit generally between 1 and 2 s and an upper limit between 6 and 7 s. Calculating the number of following vehicles in the whole transition range, they identified the cut-off value for platooning as the value to which an equivalent number of vehicles with smaller headways corresponds. Cut-off values from 15 sites range between 1.98 s and 3.85 s, and the author finally indicated a comprehensive critical headway value for identifying a vehicle in a following status as 2.5 s. The research work by Al-Kaisy et al. [45] was included in the project NCHRP 17-65-Improved Analysis of Two-Lane Highway Capacity and Operational Performance [25], a project approved by the TRB Committee on Highway Capacity and Quality of Service (ACP40) in 2019 for inclusion in the HCM.
Figure 2 depicts a graphical representation of the critical headway values for the platoon formation threshold identified in the reviewed past studies, ranging from a minimum of 2.5 s to a maximum of 9 s. The graph shows the survival function trend based on the literature values, which is the probability trend of finding values greater than or equal to a certain headway in the examined literature works. The continuous function is the trend of the survival function of the normal distribution that fits the data, with a mean of 5.29 s and a standard deviation of 1.68 s.
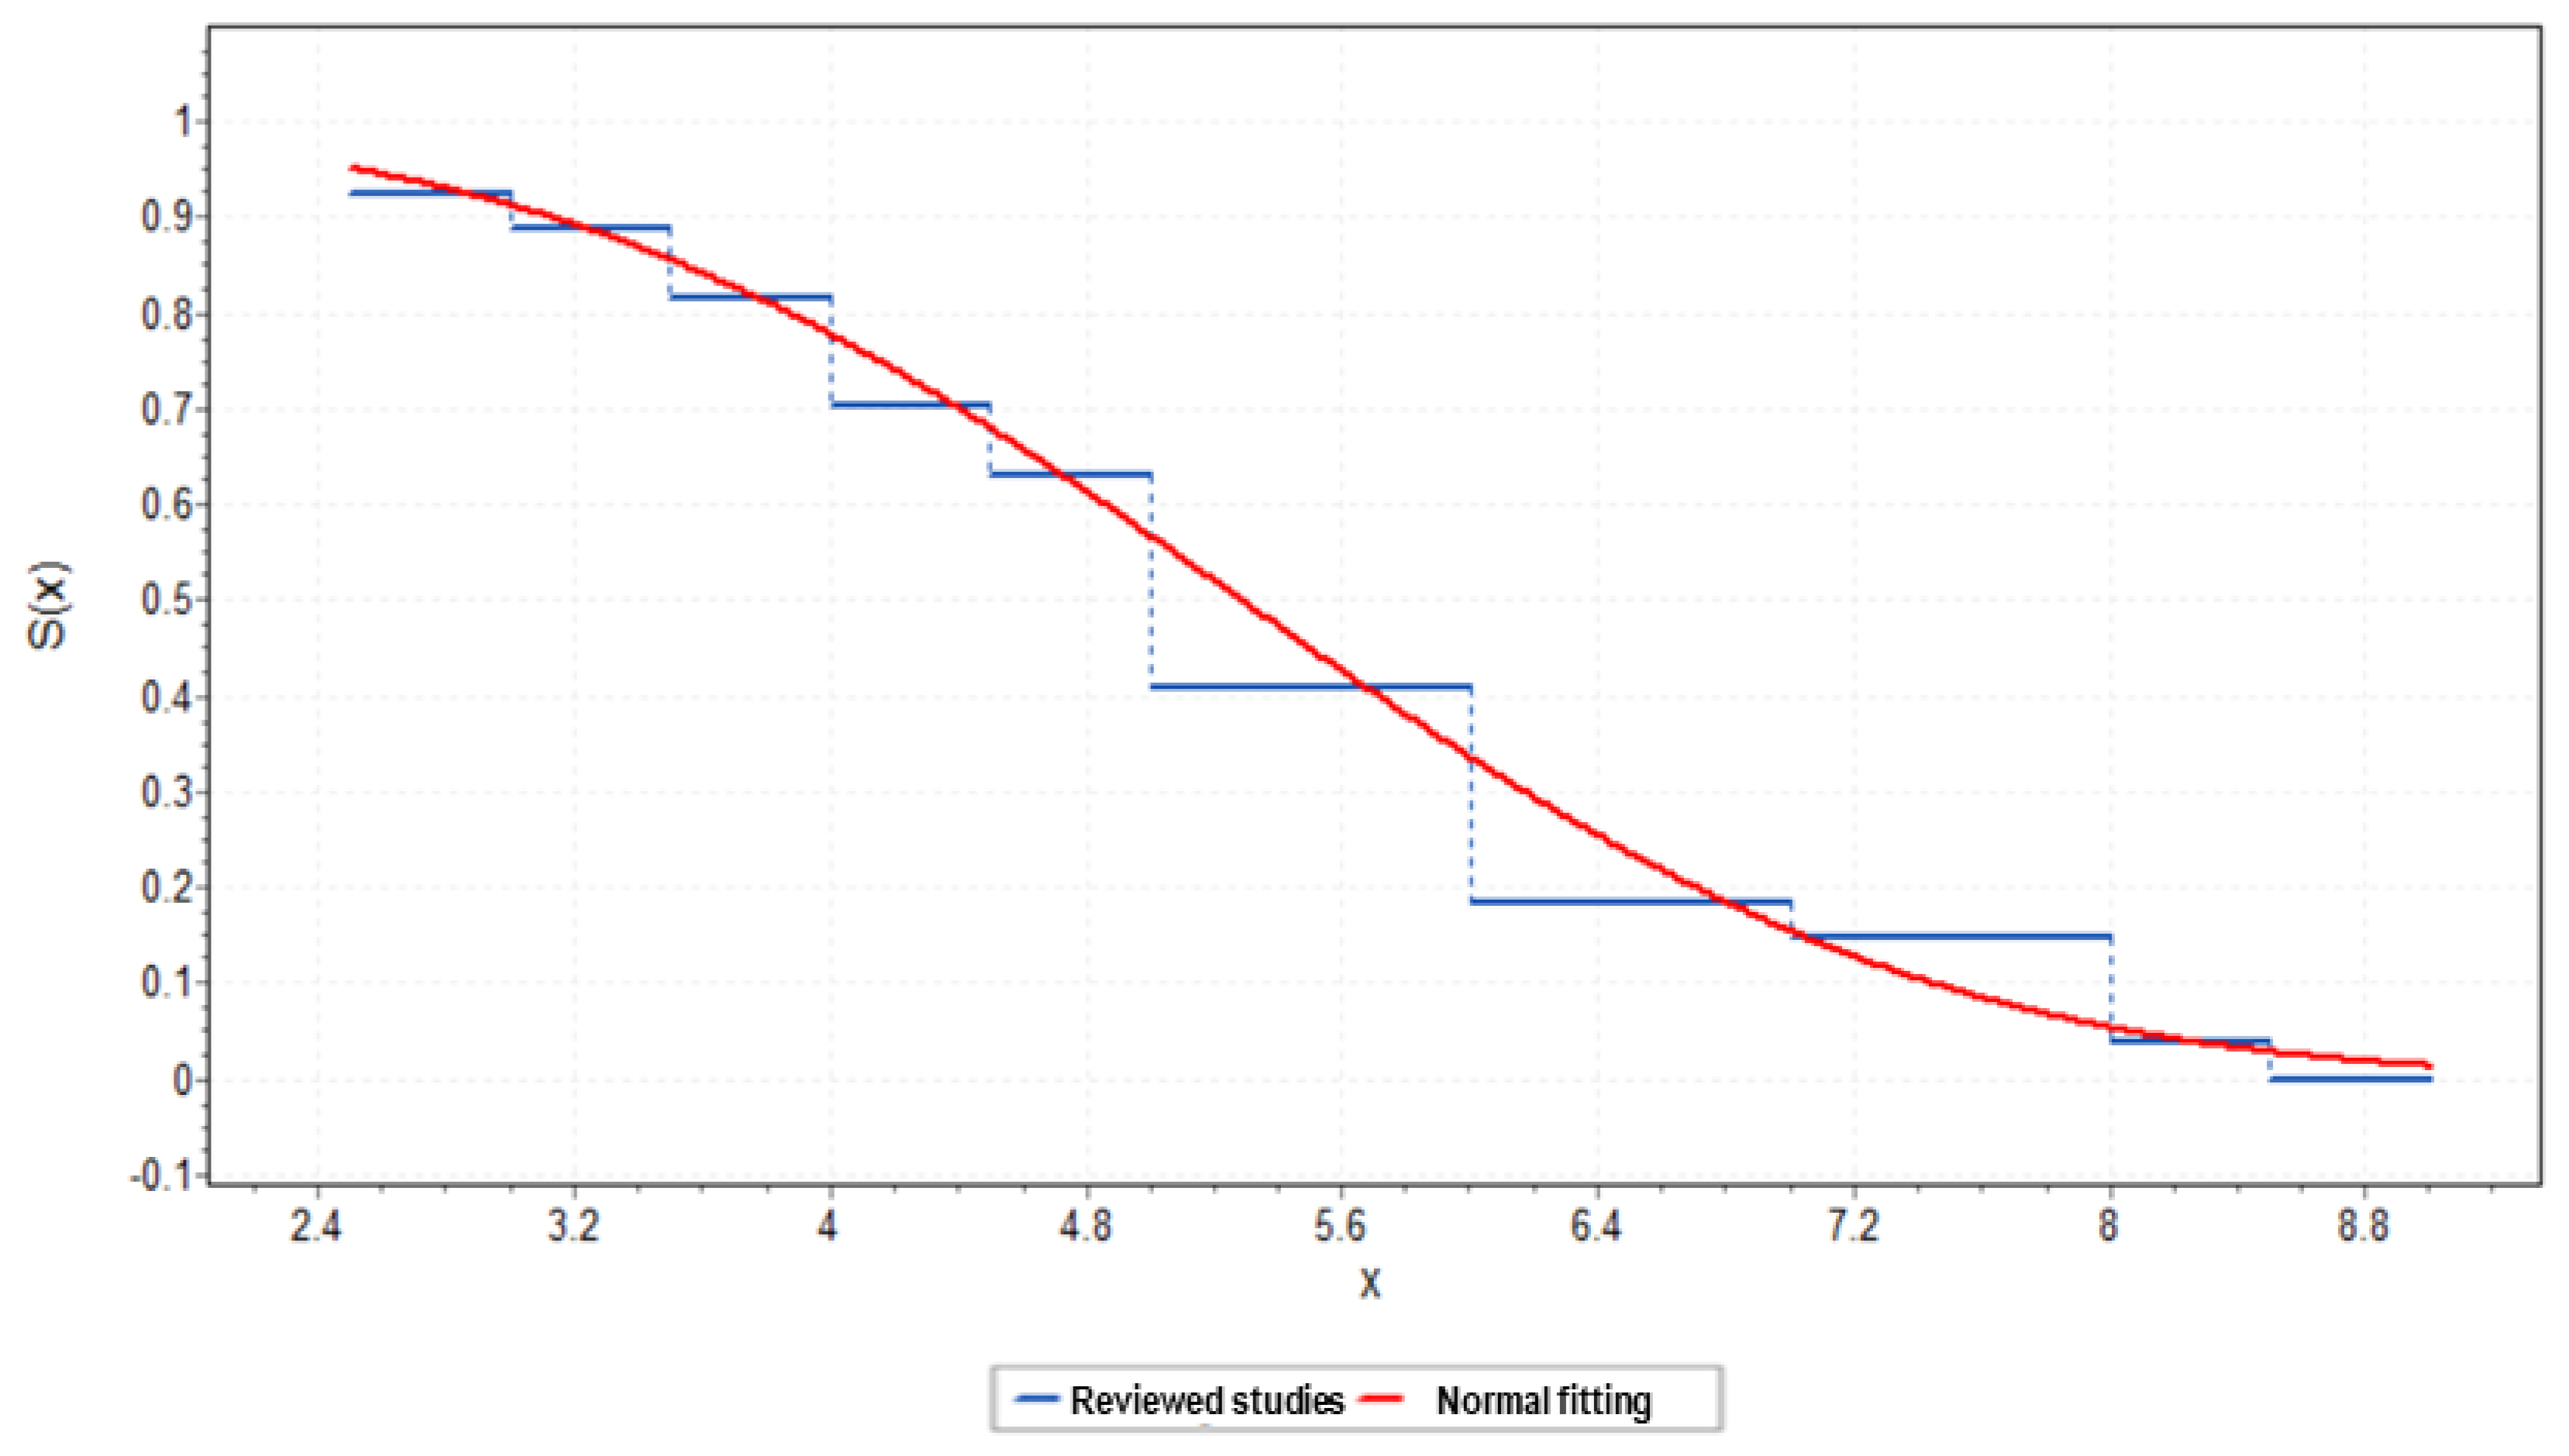
Figure 2. Survival function of the critical headway values for the platoon formation threshold identified in the reviewed studies: sampled and normal fitted trends.
At this point, it is crucial to consider the various editions of the HCM and their distinct characteristics concerning the formation and impact of platoons on traffic quality and Level of Service determination for two-lane roads. The 1985 edition of the HCM [8] introduced the concept of Percent Time Delay (PTD), which stands for the percentage of time all vehicles are delayed while traveling in platoons due to their inability to overtake. However, obtaining real-time PTD measurements is impractical; therefore, the percentage of vehicles that travel behind a platoon leader at speeds lower than their desired speed and at headways less than a critical value is often used as a surrogate measure to determine the percentage of delays. The initial threshold introduced by the HCM was 5 s, which was maintained in subsequent editions of 1994 [46] and 1997 [47] guidelines for two-lane roads. In the 2000 edition of the HCM [48], PTD was renamed PTSF, which represents the freedom to maneuver, comfort, and convenience of travel by quantifying the percentage of travel time that vehicles must travel in platoons behind slower vehicles due to the inability to pass. The surrogate measure for PTSF is the percentage of vehicles traveling with headways less than a threshold. In this case, the suggested critical value was lowered to 3 s. This critical threshold value of 3 s remained unchanged in subsequent editions of 2010 [49] and 2016 [50], until the latest edition of 2022 [9], which presents a new methodological framework to analyze the quality of service of two-lane highways based on the Al-Kaisy et al. [45] and NCHRP 17-65 [25] studies. The HCM 2022 methodology [9] introduced FD as a new service measure, which is described as the number of vehicles in a follower state per mile per lane. FD overcomes the previous issues with PTSF performance measure since it can be directly measured in situ. In this context, a follower vehicle is defined by a headway equal to or less than 2.5 s, and FD is the service measure for all two-lane highway configurations.
References
- Al-Kaisy, A. Two-Lane Highways: Indispensable Rural Mobility. Encyclopedia 2022, 2, 625–631.
- Mauro, R.; Pompigna, A. A Statistically Based Model for the Characterization of Vehicle Interactions and Vehicle Platoons Formation on Two-Lane Roads. Sustainability 2022, 14, 4714.
- Cantisani, G.; Del Serrone, G.; Peluso, P. Reliability of Historical Car Data for Operating Speed Analysis along Road Networks. Sci 2022, 4, 18.
- Tyburski, R. A review of road sensor technology for monitoring vehicle traffic. Inst. Transp. Eng. J. 1988, 59, 27–29.
- Klein, L. Sensor Technologies and Data Requirements for ITS Applications; Artech House: Boston, MA, USA, 2001.
- Saifuzzaman, M.; Zheng, Z. Incorporating Human-Factors in Car-Following Models: A Review of Recent Developments and Research Needs. Transp. Res. Part C Emerg. Technol. 2014, 48, 379–403.
- Del Serrone, G.; Cantisani, G.; Grilli, R.; Peluso, P. Effectiveness of Climbing Lanes for Slow-Moving Vehicles When Riding Uphill: A Microsimulation Study. Vehicles 2023, 5, 744–760.
- Transportation Research Board; National Research Council. Highway Capacity Manual; Transportation Research Board: Washington, DC, USA; National Research Council: Washington, DC, USA, 1985.
- Transportation Research Board; National Research Council. Highway Capacity Manual; Transportation Research Board: Washington, DC, USA; National Research Council: Washington, DC, USA, 2022.
- Al-Kaisy, A.; Karjala, S. Car-Following Interaction and the Definition of Free-Moving Vehicles on Two-Lane Rural Highways. J. Transp. Eng. 2010, 136, 925–931.
- Guerrieri, M.; Mauro, R. A Concise Introduction to Traffic Engineering; Springer: Berlin, Germany, 2021.
- Del Serrone, G.; Cantisani, G.; Peluso, P. Speed Data Collection Methods: A Review. Transp. Res. Procedia 2023, 69, 512–519.
- Ajmar, A.; Arco, E.; Boccardo, P.; Perez, F. Floating Car Data (FCD) for Mobility Applications. Int. Arch. Photogramm. Remote Sens. Spatial Inf. Sci. 2019, 42, 1517–1523.
- Chase, R.T.; Williams, B.M.; Rouphail, N.M.; Kim, S. Comparative Evaluation of Reported Speeds from Corresponding Fixed-Point and Probe-Based Detection Systems. Transp. Res. Rec. J. Transp. Res. 2012, 2308, 110–119.
- Findley, D.J.; Cunningham, C.M.; Hummer, J.E. Comparison of Mobile and Manual Data Collection for Roadway Components. Transp. Res. Part C Emerg. Technol. 2011, 19, 521–540.
- Prabha, R.; Kabadi, M.G. Overview of Data Collection Methods for Intelligent Transportation Systems. Int. J. Eng. Sci. IJES 2016, 5, 16–20.
- Miller, A.J. A Queueing Model for Road Traffic Flow. J. R. Stat. Soc. Ser. B 1961, 23, 64–75.
- Wasielewski, P. Integral Equation for the Semi-Poisson Headway Distribution Model. Transp. Sci. 1974, 8, 237–247.
- Radwan, A.E.; Kalevela, S. Investigation of the effect of change in vehicular characteristics on highway capacity and level of service. Transp. Res. Rec. 1985, 1005, 65–71.
- McLean, J.R. Two-Lane Highway Traffic Operations: Theory and Practice; Gordon & Breach: London, UK; New York, NY, USA, 1989.
- Lamm, R.; Choueiri, E.M.; Mailaender, T. Comparison of operating speeds on dry and wet pavements of two-lane rural highways. Transp. Res. Rec. 1990, 1280, 199–207.
- Pursula, M.; Enberg, A. Characteristics and level-of-service estimation of traffic flow on two-lane rural roads in Finland. Transp. Res. Rec. 1991, 1320, 135–143.
- Bennett, C.R.; Dunn, R.C.M. Critical Headways on Two-Lane Highways in New Zealand. In Proceedings of the Second International Symposium on Highway Capacity, Sydney, Australia, 9–13 August 1994; Volume 1, pp. 91–100.
- Gattis, J.L.; Alguire, M.S.; Townsend, K.; Rao, S. Rural Two-Lane Passing Headways and Platooning. Transp. Res. Rec. 1997, 1579, 27–34.
- Washburn, S.; Al-Kaisy, A.; Luttinen, T.; Dowling, R.; Watson, D.; Jafari, A.; Bian, Z.; Elias, A. Improved Analysis of Two-Lane Highway Capacity and Operational Performance; Final Report Project NCHRP 17-65, National Cooperative Highway Research Program, Web-Only Document, No. 255; Transportation Research Board: Washington, DC, USA, 2018.
- Hoban, C.J. Towards a Review of the Concept of Level of Service for Two-Lane Roads. Aust. Road Res. 1983, 13, 216–218.
- Guell, D.L.; Virkler, M.R. Capacity Analysis of Two-Lane Highways. Transp. Res. Rec. 1998, 1194, 199–203.
- Dijker, T.; Bovy, P.H.; Vermijs, R.G. Car-Following under Congested Conditions: Empirical Findings. Transp. Res. Rec. 1998, 1644, 20–28.
- Vogel, K. What Characterizes a “Free Vehicle” in an Urban Area? Transp. Res. Part F Traffic Psychol. Behav. 2002, 5, 15–29.
- Van As, C. The Development of an Analysis Method for the Determination of Level of Service of Two-Lane Undivided Highways in South Africa; Project Summary; South African National Roads Agency Limited: Pretoria, South Africa, 2003.
- Surasak, T.; Okura, I.; Nakamura, F. Measuring level of services on multi-lane expressways by platoon parameters. J. Infrastruct. Plan. Man. JSCE 2004, 2004, 23–32.
- Fitzpatrick, K.; Miaou, S.P.; Brewer, M.; Carlson, P.; Wooldridge, M.D. Exploration of the Relationship between Operating Speed and Roadway Features on Tangent Sections. J. Transp. Eng. 2005, 131, 261–269.
- Tseng, P.; Lin, F.; Shieh, S.-L. Estimation of Free-Flow Speeds for Multilane Rural and Suburban Highways. Transportation 2005, 6, 1484–1495.
- Medina, A.M.F.; Tarko, A.P. Speed Factors on Two-Lane Rural Highways in Free-Flow Conditions. Transp. Res. Rec. 2005, 1912, 39–46.
- Al-Kaisy, A.; Karjala, S. Indicators of performance on two-lane rural highways: Empirical investigation. Transp. Res. Rec. 2008, 2071, 87–97.
- Al-Kaisy, A.; Durbin, C. Platooning on Two-Lane Two-Way Highways: An Empirical Investigation. J. Adv. Transp. 2009, 43, 71–88.
- Lay, M.G. Handbook of Road Technology, 4th ed.; Spon Press: New York, NY, USA, 2009.
- Hashim, I.H. Analysis of speed characteristics for rural two-lane roads: A field study from Minoufiya Governorate, Egypt. Ain Shams Eng. J. 2011, 2, 43–52.
- Lobo, A.; Jacques, M.; Rodrigues, C.; Couto, A. Free-gap evaluation for two-lane rural highways. Transp. Res. Rec. 2011, 2223, 9–17.
- Semeida, A.M. New models to evaluate the level of service and capacity for rural multi-lane highways in Egypt. Alex. Eng. J. 2013, 52, 455–466.
- Robertson, J.; Fitzpatrick, K.; Park, E.S.; Iragavarapu, V. Determining level of service on freeways and multilane highways with higher speeds. Transp. Res. Rec. 2014, 2461, 85–93.
- Penmetsa, P.; Ghosh, I.; Chandra, S. Evaluation of Performance Measures for Two-Lane Intercity Highways under Mixed Traffic Conditions. J. Transp. Eng. 2015, 141, 04015021.
- Boora, A.; Ghosh, I.; Chandra, S.; Rani, K. Measurement of free-flow conditions on multilane intercity highways under heterogeneous traffic conditions. J. S. Afr. Inst. Civ. Eng. 2018, 60, 2–9.
- Saha, P.; Roy, R.; Sarkar, A.K.; Pal, M. Preferred Time Headway of Drivers on Two-Lane Highways with Heterogeneous Traffic. Transp. Lett. 2019, 11, 200–207.
- Al-Kaisy, A.; Jafari, A.; Washburn, S. Following Status and Percent Followers on Two-Lane Highways: Empirical Investigation. Civ. Eng. Res. J. 2019, 7, 61–70.
- Transportation Research Board; National Research Council. Highway Capacity Manual; Transportation Research Board: Washington, DC, USA; National Research Council: Washington, DC, USA, 1994.
- Transportation Research Board; National Research Council. Highway Capacity Manual; Transportation Research Board: Washington, DC, USA; National Research Council: Washington, DC, USA, 1997.
- Transportation Research Board; National Research Council. Highway Capacity Manual; Transportation Research Board: Washington, DC, USA; National Research Council: Washington, DC, USA, 2020.
- Transportation Research Board; National Research Council. Highway Capacity Manual; Transportation Research Board: Washington, DC, USA; National Research Council: Washington, DC, USA, 2010.
- Transportation Research Board; National Research Council. Highway Capacity Manual; Transportation Research Board: Washington, DC, USA; National Research Council: Washington, DC, USA, 2016.
More
Information
Subjects:
Transportation
Contributors
MDPI registered users' name will be linked to their SciProfiles pages. To register with us, please refer to https://encyclopedia.pub/register
:
View Times:
1.0K
Revisions:
2 times
(View History)
Update Date:
15 Aug 2023
Table of Contents


Notice
You are not a member of the advisory board for this topic. If you want to update advisory board member profile, please contact office@encyclopedia.pub.
OK
Confirm
Only members of the Encyclopedia advisory board for this topic are allowed to note entries. Would you like to become an advisory board member of the Encyclopedia?
Yes
No
${ textCharacter }/${ maxCharacter }
Submit
Cancel
Back
Comments
${ item }
|
${ item.createdUser.fullName }
${ item.createdAt }
${ item.vote }
${ item.reply }
Delete
${ reply.createdUser.fullName }
${ reply.createdAt }
${ reply.vote }
Delete
There is no reply to this comment~
${ item.replyTextCharacter }/${ item.replyMaxCharacter }
Submit
Cancel
More
No more~
There is no comment~
${ textCharacter }/${ maxCharacter }
Submit
Cancel
${ selectedItem.replyTextCharacter }/${ selectedItem.replyMaxCharacter }
Submit
Cancel
Confirm
Are you sure to Delete?
Yes
No