Your browser does not fully support modern features. Please upgrade for a smoother experience.
Submitted Successfully!
 +1 credit
Thank you for your contribution! You can also upload a video entry or images related to this topic.
For video creation, please contact our Academic Video Service.
| Version | Summary | Created by | Modification | Content Size | Created at | Operation |
|---|---|---|---|---|---|---|
| 1 | Ramez Alkhatib | -- | 2839 | 2023-08-08 12:11:50 | | | |
| 2 | Dean Liu | -10 word(s) | 2829 | 2023-08-09 02:14:43 | | |
Video Upload Options
We provide professional Academic Video Service to translate complex research into visually appealing presentations. Would you like to try it?
Cite
If you have any further questions, please contact Encyclopedia Editorial Office.
Jalloul, R.; Chethan, H.K.; Alkhatib, R. Types of Breast Cancer Imaging. Encyclopedia. Available online: https://encyclopedia.pub/entry/47783 (accessed on 26 July 2026).
Jalloul R, Chethan HK, Alkhatib R. Types of Breast Cancer Imaging. Encyclopedia. Available at: https://encyclopedia.pub/entry/47783. Accessed July 26, 2026.
Jalloul, Reem, H. K. Chethan, Ramez Alkhatib. "Types of Breast Cancer Imaging" Encyclopedia, https://encyclopedia.pub/entry/47783 (accessed July 26, 2026).
Jalloul, R., Chethan, H.K., & Alkhatib, R. (2023, August 08). Types of Breast Cancer Imaging. In Encyclopedia. https://encyclopedia.pub/entry/47783
Jalloul, Reem, et al. "Types of Breast Cancer Imaging." Encyclopedia. Web. 08 August, 2023.
Copy Citation
Cancer is an incurable disease based on unregulated cell division. Breast cancer is the most prevalent cancer in women worldwide, and early detection can lower death rates. Medical images can be used to find important information for locating and diagnosing breast cancer. The best information for identifying and diagnosing breast cancer comes from medical pictures.
breast cancer
medical images
machine learning
1. Introduction
The second-leading cause of mortality is breast cancer, which is the cancer type that is most frequently diagnosed. In 2020, more than 2 million new cases of breast cancer were discovered, making it the most diagnosed disease in the world, according to the World Health Organization (WHO). A total of 626,700 women lose their lives to cancer-related conditions every year. Breast cancer is the most common malignancy in women and the second leading cause of death, and if it is not caught early enough, it can be fatal [1]. If the cancer is found before it expands to a size of 10 mm, the patient has an 85% probability of going into complete remission. Cohort studies show that 30% of breast cancer cases are identified when the tumor is 30 mm. Breast cancer is usually detected during screening when the tumor is at least 20 mm in size [2]. Therefore, encouraging early diagnosis of breast cancer is crucial. A positive clinical breast examination (CBE) and breast self-examination (BSE) may warrant early intervention. Healthcare professionals conduct a CBE as part of routine medical examinations to look for breast lesions. BSE also includes a patient physical examination to look for any physical changes and breast appearance. Women may take charge of their health thanks to the BSE technique. The World Health Organization recommends that at-risk women learn more about BSE [3]. Screening procedures are used to create medical images of the breasts. Professionals with human skills, such as radiologists and doctors, typically interpret these images. Medical imaging’s poor diagnostic accuracy is caused by a lack of technological expertise and expertise in analyzing such images.
Breast cancer has two types, benign (not hazardous) and cancer (malignant) and falls into two groups: normal or aberrant. Benign conditions are thought to be non-cancerous or not life-threatening. But occasionally, it might progress to cancer status. Cancer begins with unnatural cell development and has the potential to spread or infiltrate neighboring tissue quickly. The nuclei of malignant tissue are typically substantially larger than those of normal tissue, which can be fatal in later stages. If malignancy is discovered, tissue is often collected from a surgical biopsy, and less frequently from a tiny needle or larger cardiac biopsy for microscopic examination. Examining current investigative data and extracting pertinent information from earlier data are the key components of an early and precise diagnosis of this disease. Machine learning (ML) algorithms and medical imaging support the procedure. Various deep learning and machine learning techniques have been created to help clinicians understand medical images. Over the past ten years, the development of machine and deep learning models has attracted much attention. Pre-trained networks can be used to install models because they are freely available.
Artificial intelligence (AI) has advanced quickly in recent years. AI aids and assists medical professionals in recognizing and forecasting illness risk more quickly and precisely, enabling early disease identification. Artificial intelligence (AI), a rapidly expanding phenomenon, may soon lead to significant developments in various industries, including medical education.
2. Artificial Intelligence and Machine Learning Techniques
To anticipate, characterize, or respond to an issue, models must be created using Machine Learning (ML), a subsection of Artificial Intelligence (AI) (Figure 1). Machine learning is a term used to describe a group of techniques that “detect patterns in data, use the uncovered patterns to predict future data or other outcomes of interest”. ML approaches learn directly from data, eliminating the need for numerous expert rules or precisely representing every environmental element. Due to its independence from typical ML extraction techniques and capacity to focus on a complicated hierarchy of image attributes, Deep Learning (DL) is a subclass of Machine Learning (ML) and AI. Computers read data from photos and apply deep learning methods to various previously used computer models to make significant gains. Many medical specialties, particularly radiology and pathology, have used these algorithms to fulfill tasks. Their performance has occasionally been on par with that of human professionals. According to [4], DL can extract information from medical images similar to human analysis and offer details on molecular status, prognosis, and therapy sensitivity. Convolutional neural networks, deep Boltzmann machines, and deep neural networks are popular DL methods.
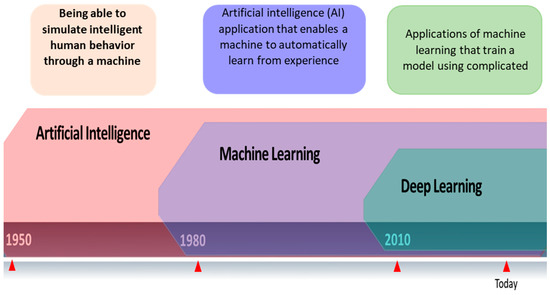
Figure 1. Relationship between artificial intelligence, machine learning, and deep learning.
It is possible to distinguish between supervised, unsupervised, and agent-based machine learning techniques.
-
Supervised learning: In supervised machine learning (ML), every issue may be viewed as the learning of a parametrized function, also referred to as a “model”, that maps inputs (i.e., predictor variables) to outputs (i.e., “target variables”). The purpose of supervised learning is to utilize an algorithm to extract the parameters of those functions from the given data. It is possible to think of supervised learning as using logistic and linear regressions. The majority of ML approaches fall within this category. SVM, DT, Clustering-NN, and K-means are examples of supervised machine learning methods.
-
Unsupervised learning: ML issues are often far more difficult to solve if the target variables are unavailable. Unsupervised learning uses the common dimensionality reduction and clustering tasks to find correlations or patterns in the data without providing any direction for the “correct” answer.
- gent-based learning: Between guided and unguided learning: It is a collection of machine learning techniques where learning occurs by replicating the activities and communications of a single autonomous agent or a group of autonomous agents. To effectively learn, carefully determine values (or preferences), and employ inquiry procedures, one must deal with problems that regularly arise in real life. It is necessary to develop generalizable models because these general unsupervised approaches rely on target obtain variables for which there is little information. Only by experimenting can one detect essential parts of the surroundings. In this context, a specific example of a problem with decision-making over time is reinforcement learning.
3. Types of Breast Cancer Imaging
Medical imaging, which frequently employs a range of modalities, including MRI, CT, PET, mammography, radiographic ultrasonography, and duplex ultrasound, is the most efficient way to find breast cancer. Medical images help in disease diagnosis, pathological lesion detection, patient therapeutic care, and the assumption of many disorders. Medical image analysis is one application where ML and AI have been quite successful recently. By using image processing and machine learning techniques for the early identification and diagnosis of malignancies, it is now possible to increase the accuracy of breast cancer diagnosis.
3.1. Mammography Images
Mammography is a type of medical imaging that uses a low-dose X-ray system and is mainly used to test for breast cancer. It can be used to find malignant tumors inside the breast. Mammograms help diagnose breast cancer in persons with odd symptoms or breast nodules; even while screening, mammography helps determine the cancer risk in women without overt symptoms. According to the American Cancer Society, every woman over 40 should obtain a mammogram once a year. On a mammography, dense breast tissue may appear white or light grey. Mammograms of younger women may be easier to view since they appear to have larger breasts. They may spot added in situ lesions and reduce invasive tumors compared to MRI and ultrasounds. Mammography remains the gold standard for community breast cancer screening [5]. Mammography is the most reliable and accurate screening technique. Mammography is still used with MRI and ultrasound, especially with high breast tissue density, but it cannot replace mammography. Mammograms can be viewed in various ways to give more details before detection or diagnosis. The two most common mammography views are cardio-caudal (CC) and mediolateral oblique (MLO). The breast is squashed between two paddles in the CC view mammography, which is taken horizontally from an upward projection at a C-arm angle of e 0°. This reveals the glandular tissue, the surrounding fatty tissue, and the outermost edge of the chest muscle. The breast is squashed diagonally between the paddles in the MLO view of mammography, which is captured at a 45-degree angle from the side of the C-arm. As a result, more breast tissue is visible than in other views.
Mammography Datasets
Several datasets are available to the public, and they differ in terms of their size, resolution, image format, and the types of images they contain (such as Full-Field Digital Mammography (FFDM), Film Mammography (FM), or Screen-Film Mammography (SFM), and the kinds of abnormalities they contain). DDSM breasts, Mini-MIAS, the Curated Breast Imaging Subset of DDSM (CBIS-DDSM), and BCDR are a few examples of public datasets.
-
The digital database for screening mammography (DDSM) comprises 2620 mammograms scanned from film which were then separated into 43 volumes (Figure 2). For each example, there are four breast mammograms since the Mediolateral Oblique (MLO) and Cranio-Caudal projections were used to photograph each breast side. The dataset includes pixel-level annotations for the suspicious regions and the ground truth. The breast density score for each patient was calculated using the ACR BI-RADS (American College of Radiology Breast Imaging Reporting and Data System). The file for each case also contains information about the size and resolution of each scanned image. JPEG (Joint Photographic Experts Group) format, available in various formats and resolutions, was used for the images.
-
The Curated Breast Imaging Subset of the DDSM (CBIS-DDSM) is an upgraded version of the DDSM that includes bounding boxes for the region of interest (ROI), updated mass segmentation, and decompressed pictures. The data were picked and reviewed by mammographers with the necessary training, and the images are in the Digital Imaging and Communication in Medicine (DICOM) format. The collection is 163.6 GB in size and contains 6775 studies. There were 10,239 images in total, all mammography scans with associated mask images. CSV files are associated with the dataset that includes the patients’ pathological data. A mass training set, a mass testing set, a training set for calcification, and a testing set for calcification make up the dataset’s four CSV files. The mass testing set only includes images for 378 cancers, whereas the dataset consists of images of 1318 tumors. Images for 1622 calcifications are included in the calcification training set, whereas photos for 326 calcifications are included in the calcification testing set.
-
IN Breast: Breast consists of 410 images and 115 cases. In 90 of the 115 cases, there was malignancy in both breasts. The dataset represents the four types of breast illnesses: breast bulk, breast calcification, breast asymmetries, and breast distortions. Images of (CC) and (MLO) views, stored in DICOM format, are included in the dataset. The dataset also offers the breast density score from the Breast Imaging-Reporting and Data System (BI-RADS).
-
Mini-MIAS: The dataset includes ground truth indicators for potential abnormalities and 322 digital films. The collection contains five types of abnormalities: masses, architectural distortion, asymmetry, and normal. Ultimately, 1024 by 1024 pixels) were used as the final resolution for the images. The images are accessible to everyone on the University of Essex’s Pilot European Image Processing Archive (PEIPA).
-
BCD: The BCDR consists of two mammographic repositories:
- ○
-
The BCDR-FM and the Film Mammography-based Repository.
- ○
-
The BCDR-DM, or Full Field Digital Mammography-based Repository.
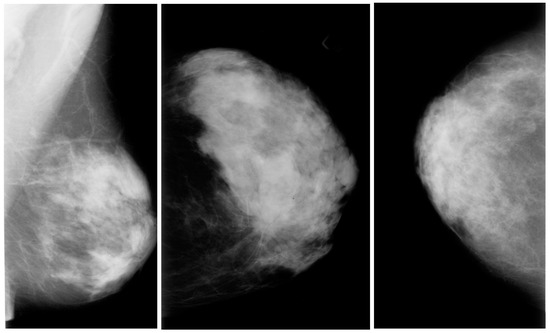
Figure 2. Mammography images from the DDSM dataset from Kaggle.
The BCDR repositories include normal and atypical breast cancer cases and the clinical information needed to treat them. The 1010 cases in the BCDR-FM are split between 998 females and 12 males. Additionally, it contains 104 detected lesions and 3703 mammographic pictures in the two perspectives, MLO and CC, from 1125 investigations.
3.2. Ultrasound Images
Another type of medical imaging technique for finding tumors is breast ultrasonography (Figure 3). The comprehensive medical images of the breast produced by ultrasound are created using sound wave techniques. This method is considered suitable and safe for pregnant women who cannot utilize X-rays or CT scans and nursing mothers. Additionally, pregnant women and nursing mothers who cannot use X-rays or CT scans are considered suitable and safe candidates for ultrasound.
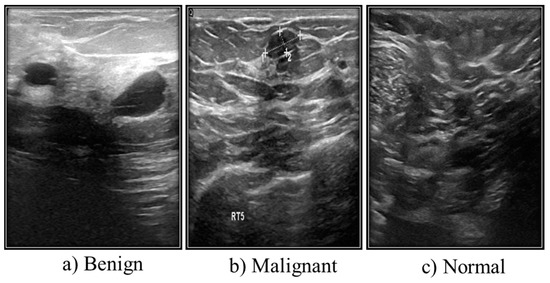
Figure 3. Different types of ultrasound images from Kaggle.
Ultrasound Dataset
Grayscale images make up the majority of ultrasound (US) images stored in a DICOM format at Baheya Hospital. The three categories of the US dataset are benign, malignant, and normal. A total of 1100 images were initially acquired. After preprocessing, 780 of the dataset’s initial 1080 images remained. The LOGIQ E9 ultrasound system and the LOGIQ E9 Agile ultrasound system are used in the scanning procedure. High-quality radiology, cardiology, and vascular care imaging routinely use these approaches. They create images with a 1280 × 1024 resolution. ML6-15-D linear probe transducers operate at 1–5 MHz (Table 1).
Table 1. Table of three classes of ultrasound breast images.
| Case | Number of Images |
|---|---|
| Benign | 487 |
| Malignant | 210 |
| Normal | 133 |
| Total | 780 |
3.3. Magnetic Resonance Imaging (MRI)
Along with ultrasound and mammography, magnetic resonance imaging (MRI) is an early cancer cell detection method. Magnetic fields are used in MRI to produce incredibly accurate three-dimensional (3D) transverse images. A considerable radiation dose is required for a human body MRI to provide precise 3D breast images. Therefore, the diseased area changes rather noticeably when researchers use an MRI, and no malignancy is found that cannot be seen in any other method. Breast MRI is important for the early detection of breast cancer, in part because it provides quick diffusion-weighted imaging and T2- and T1-weighted CE (contrast-enhanced) imaging, which can be used to characterize lesions further. Breast MRI is essential in identifying complications in women at high risk of breast cancer, among other factors.
-
High risk of developing breast cancer.
-
Evaluation of the staging period.
-
Neoadjuvant chemotherapy (NAC) follow-up.
-
Evaluation of an auxiliary lymph node region when mammography could not identify the primary location.
A breast MRI takes thirty to forty minutes, following best practices and benchmark procedures.
MRI Datasets
-
Breast–MRI–NACT–Pilot dataset: The database for this dataset is 19.5 GB in size and contains 99,058 MRI images for 64 patients.
-
Mouse–Mammary: This dataset has 23,487 Images, the database is 8.6 GB, and there are 32 patients.
3.4. Histopathological Images
The standard for diagnosing cancer has not altered, despite the fast advancements in medical technology. The tissues involved in disease are portrayed in microscopic detail in histopathological image analysis (Figure 4). The pathologists’ experience and factors such as fatigue and a decline in brain function impact the histopathological investigation’s lengthy and highly skilled process.
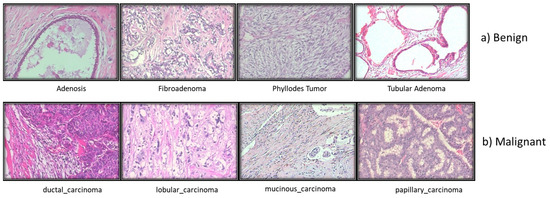
Figure 4. Different types of Breast histopathology images.
Dataset for Breast Cancer Histopathological Images
The majority of studies on BC histopathology image analysis, according to the literature, are based on small datasets that are often not shared with the scientific community. At four distinct magnifications (40×, 100×, 200×, and 400×), 82 patients provided 7909 microscopic photos of breast tumor tissue that were clinically realistic. These images were collected for BreaKHis. It now has 2480 benign samples and 5429 cancerous ones. All information was made anonymous. Hematoxylin and eosin (HE)-stained breast tissue biopsy slides were used to create the samples. Pathologists from the P&D Lab obtained the samples through surgical (open) biopsy (SOB), prepared them for histological analysis, and labeled them.
3.5. Thermography Images
Thermal imaging (Figure 5) often called breast thermography, is created under a microscope. This makes it possible to examine how cells, tissues, and organs’ microscopic anatomy relates to their structural and functional makeup. Finding breast changes that might be symptoms of breast cancer is routinely performed using this painless, non-invasive method [6]. A thermal infrared camera that converts infrared light into electrical impulses and displays it as a thermogram can be used to diagnose breast cancer by identifying body sections that suggest an unusual temperature shift. Thermography is the name of this technique. Thermal imaging employs sensitive and high-resolution thermal cameras and is a promising early diagnosis technique. Thermal imaging, in conjunction with artificial intelligence (AI), is a successful technique for identifying early-stage breast cancer and is projected to have very high levels of prediction.
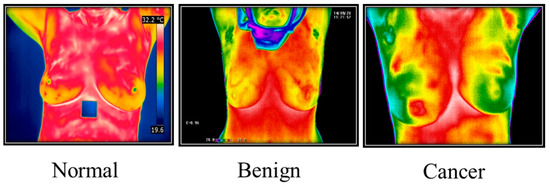
Figure 5. Thermography Images from Irthermo database.
3.6. Positron Emission Tomography (PET)
Breast PET, also known as Positron Emission Tomography, is a medical imaging method used to visualize and identify metabolic activity in breast tissue. This technique involves introducing a small amount of a radioactive tracer, typically a sugar-based compound, into the patient’s bloodstream. The tracer accumulates in regions with higher metabolic activity, such as cancerous cells, emitting positrons (positively charged particles). When these positrons interact with electrons in the tissue, they produce gamma rays, which are then detected by the PET scanner to generate images.
Machine learning plays a crucial role in breast PET imaging, particularly in improving image quality, enhancing cancer detection accuracy, and aiding in diagnosis. However, compared to other imaging techniques, nuclear medicine modalities such as PET or scintigraphy have been considered less effective in evaluating early-stage breast cancer. Additionally, publicly available breast PET datasets are not as abundant as datasets for other medical imaging modalities.
It is important to emphasize that the successful application of machine learning in breast PET heavily depends on access to high-quality and well-annotated datasets. Having access to such datasets is vital for training accurate and reliable machine learning models for breast PET imaging analysis (Figure6) [7].
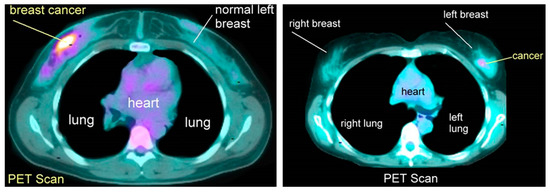
Figure 6. Positron emission tomography scan images.
References
- Arevalo, J.; Gonzalez, F.A.; Ramos-Pollan, R.; Oliveira, J.L.; Guevara Lopez, M.A. Representation learning for mammography mass lesion classification with convolutional neural networks. Comput. Methods Programs Biomed. 2016, 127, 248–257.
- Roslidar, R.; Rahman, A.; Muharar, R.; Syahputra, M.R.; Arnia, F.; Syukri, M.; Pradhan, B.; Munadi, K. A Review on Recent Progress in Thermal Imaging and Deep Learning Approaches for Breast Cancer Detection. IEEE Access 2020, 8, 116176–116194.
- Lancet, T. Breastfeeding: Achieving the new normal. Lancet 2016, 387, 404.
- Erickson, B.J.; Korfiatis, P.; Akkus, Z.; Kline, T.L. Machine learning for medical imaging. Radiographics 2017, 37, 505–515.
- Shen, L.; Margolies, L.R.; Rothstein, J.H.; Fluder, E.; McBride, R.; Sieh, W. Deep Learning to Improve Breast Cancer Detection on Screening Mammography. Sci. Rep. 2019, 9, 12495.
- Hossam, A.; Harb, H.M.; Abd, H.M.; Kader, E. Automatic Image Segmentation Method for Breast Cancer Analysis Using Thermography. JES J. Eng. Sci. 2018, 46, 12–32.
- Robert, M.; Miller, J. About Cancer. Available online: http://www.aboutcancer.com/breast_pet_scans.htm (accessed on 17 July 2023).
More
Information
Contributors
MDPI registered users' name will be linked to their SciProfiles pages. To register with us, please refer to https://encyclopedia.pub/register
:
View Times:
639
Revisions:
2 times
(View History)
Update Date:
09 Aug 2023
Table of Contents


Notice
You are not a member of the advisory board for this topic. If you want to update advisory board member profile, please contact office@encyclopedia.pub.
OK
Confirm
Only members of the Encyclopedia advisory board for this topic are allowed to note entries. Would you like to become an advisory board member of the Encyclopedia?
Yes
No
${ textCharacter }/${ maxCharacter }
Submit
Cancel
Back
Comments
${ item }
|
${ item.createdUser.fullName }
${ item.createdAt }
${ item.vote }
${ item.reply }
Delete
${ reply.createdUser.fullName }
${ reply.createdAt }
${ reply.vote }
Delete
There is no reply to this comment~
${ item.replyTextCharacter }/${ item.replyMaxCharacter }
Submit
Cancel
More
No more~
There is no comment~
${ textCharacter }/${ maxCharacter }
Submit
Cancel
${ selectedItem.replyTextCharacter }/${ selectedItem.replyMaxCharacter }
Submit
Cancel
Confirm
Are you sure to Delete?
Yes
No