 +1 credit
| Version | Summary | Created by | Modification | Content Size | Created at | Operation |
|---|---|---|---|---|---|---|
| 1 | Ernest N. Kamavuako | -- | 4264 | 2023-07-14 13:34:15 | | | |
| 2 | Lindsay Dong | Meta information modification | 4264 | 2023-07-18 02:53:34 | | |
Video Upload Options
Food and fluid intake monitoring are essential for reducing the risk of dehydration, malnutrition, and obesity. The existing research has been preponderantly focused on dietary monitoring, while fluid intake monitoring, on the other hand, is often neglected. Food and fluid intake monitoring can be based on wearable sensors, environmental sensors, smart containers, and the collaborative use of multiple sensors. Vision-based intake monitoring methods have been widely exploited with the development of visual devices and computer vision algorithms. Vision-based methods provide non-intrusive solutions for monitoring. They have shown promising performance in food/beverage recognition and segmentation, human intake action detection and classification, and food volume/fluid amount estimation. However, occlusion, privacy, computational efficiency, and practicality pose significant challenges.
1. Introduction
2. Overview of Vision-Based Intake Monitoring
2.1. Active and Passive Methods
2.2. Environmental Settings
2.3. Privacy Issue
3. Viewing Angles and Devices in Monitoring Systems
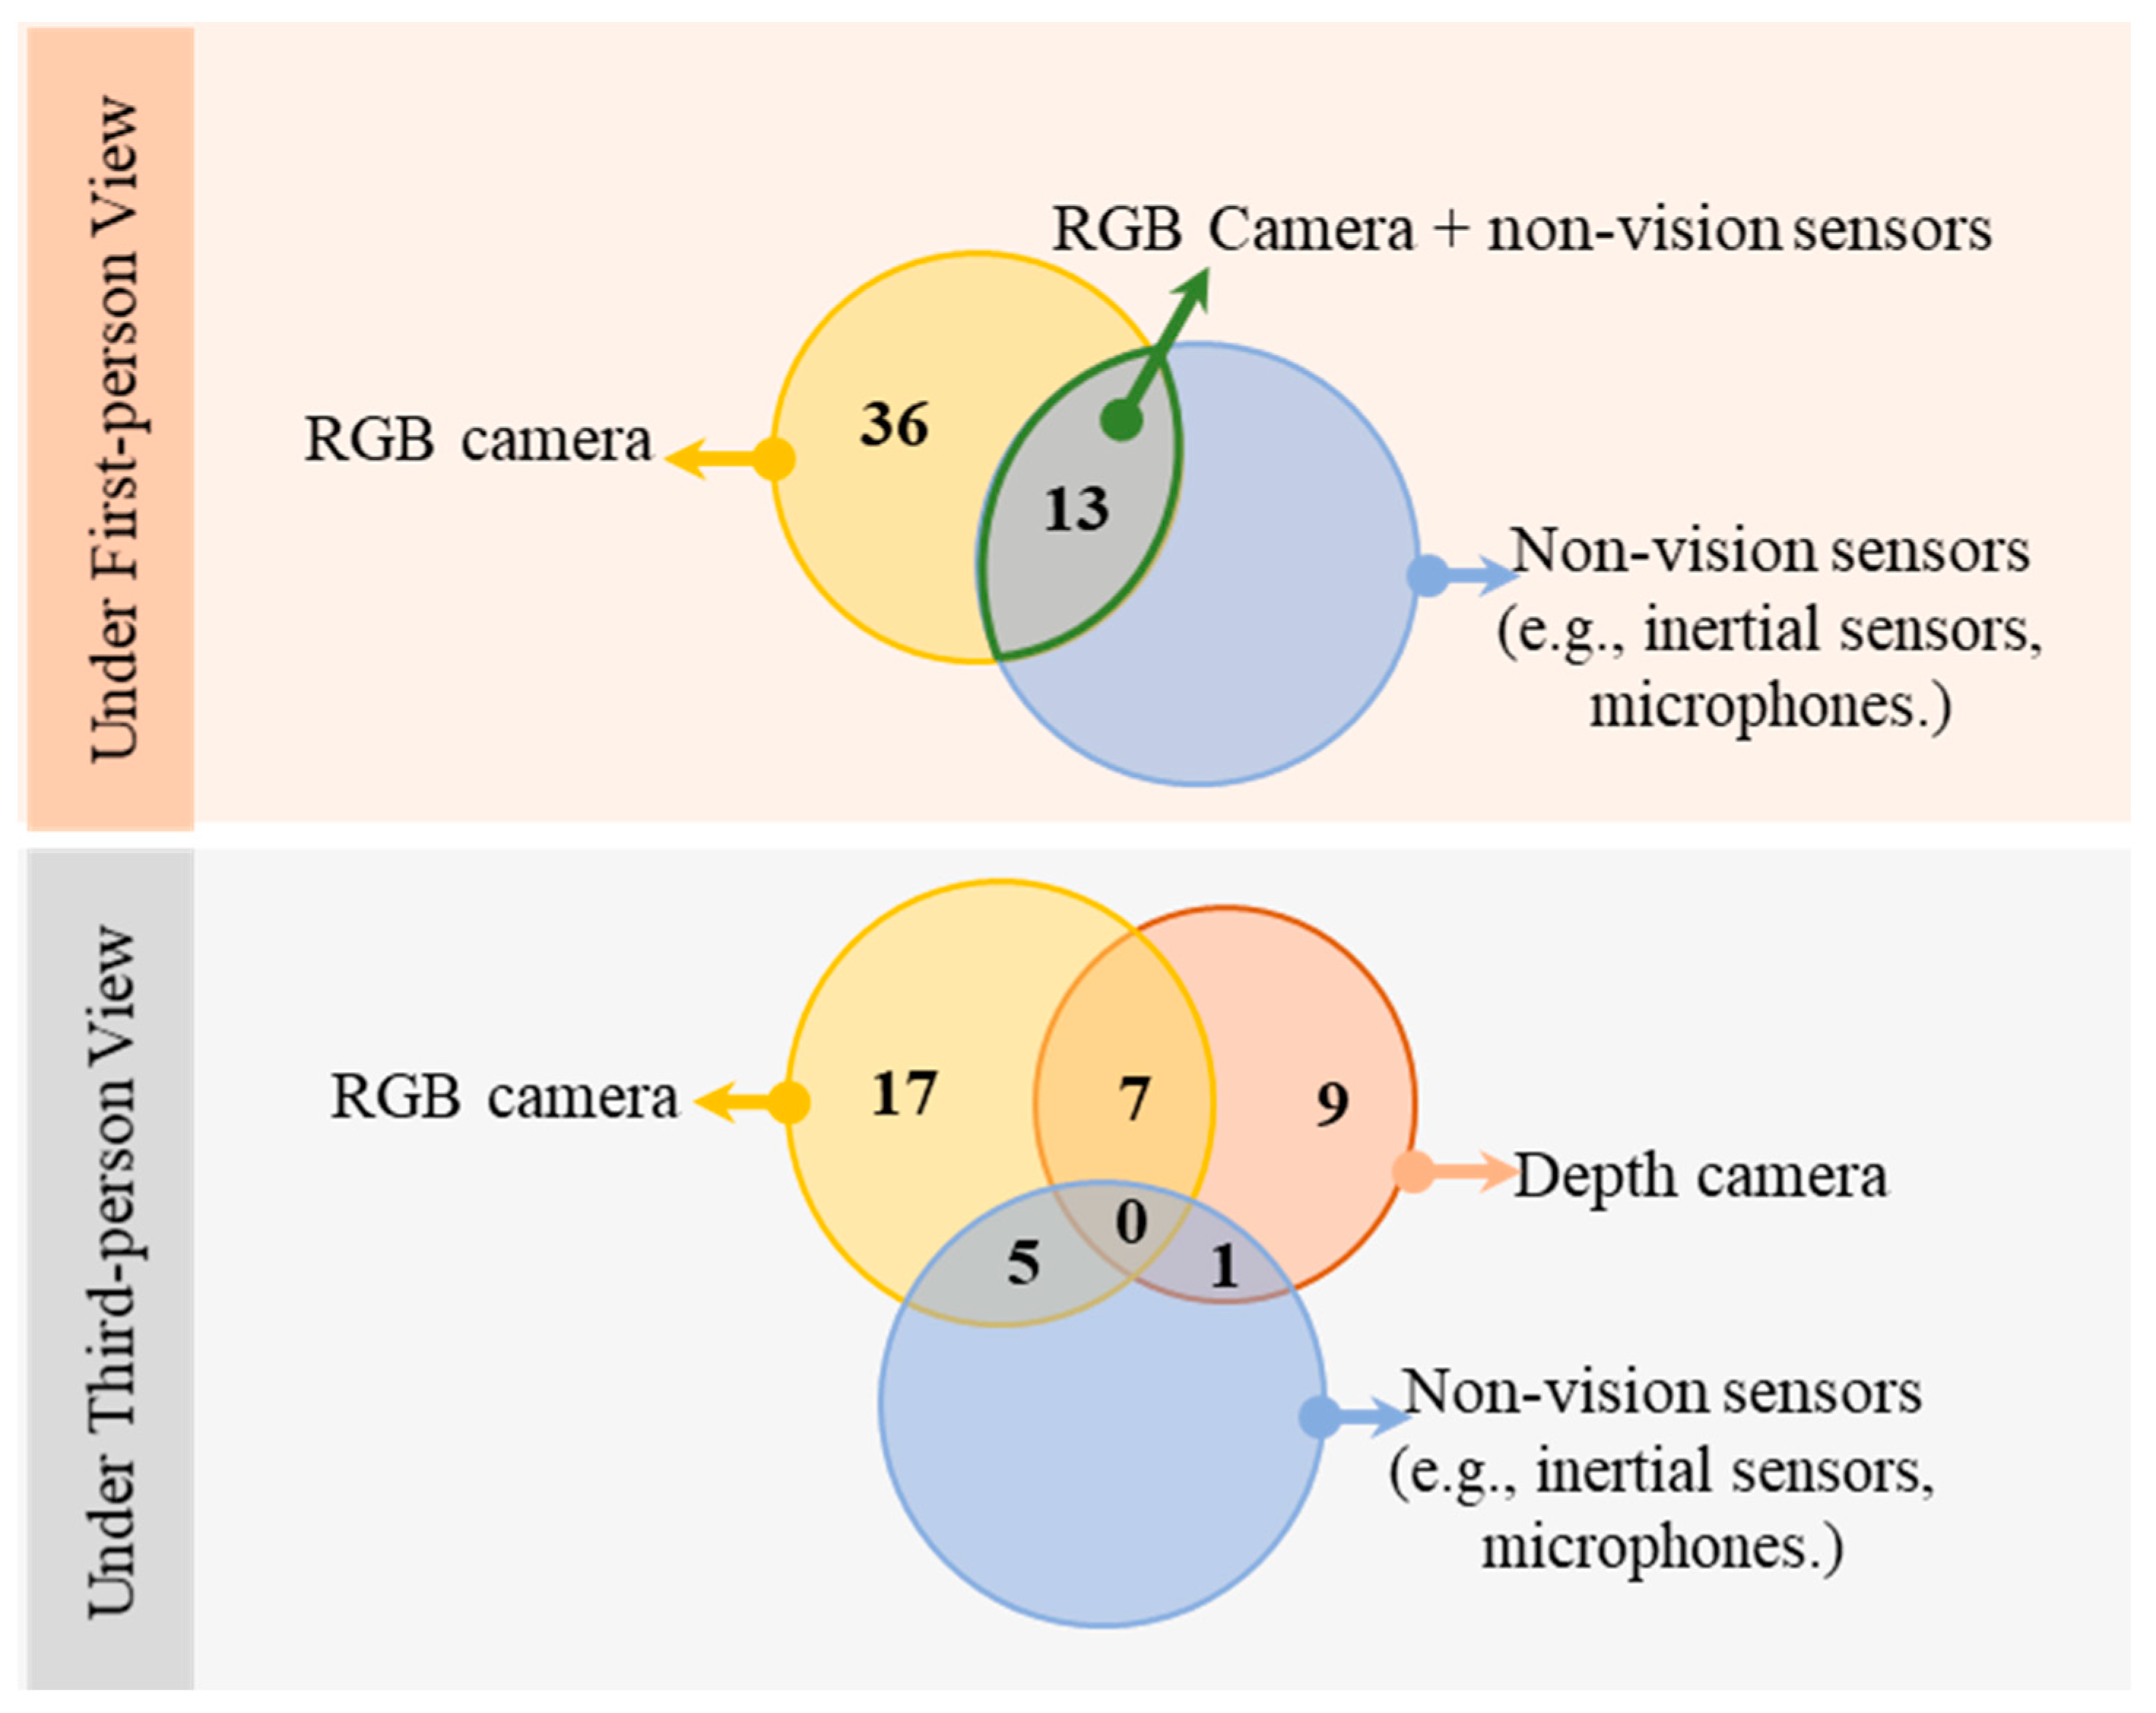
3.1. First-Person Approaches
3.2. Third-Person Approaches
4. Algorithms by Task
4.1. Binary Classification
4.2. Food/Drink Type Classification
ML methods included support vector machines (SVM), principal component analysis (PCA) [62][68][69], K-means classifiers, random forest (RF), fully connected neural networks (NN), artificial neural networks (ANN) [70], and some image matching and retrieving methods such as content-based image retrieval (CBIR) [71], dynamic time wrapping (DTW) [72], bag of features (BoF) [33][73][74], which clusters the features into visual words. Features of the image could be extracted by methods including speeded-up robust features(SURF) and scale-invariant feature transform (SIFT). In these methods, SVM was most seen and often used collaboratively with other DL methods. Different networks were seen in DL methods, such as GoogLeNet [61][64][67][70][72][75][76][77][78], MobileNetV2 [68][69], AlexNet [67][75][76], Inception-V3 [72][78][79][80][81], NutriNet [67][76][82], K-foodNet, and Very deep convolutional neural network [75], DenseNet161 [72], fully convolutional networks (FCN) [76][82][83][84], YOLO [83][85][86], extreme learning machine (ELM) extreme [87][88][89], neural trees [87], graph convolutional networks(GCN) [90], deep learning PDE model (DPM) [73], SibNet [91], VGG16 or VGG365 [72][75][84][92], ResNet, ResNet50 and ResNet152 [67][70][72][75][76][78][79][80][93][94], EfficientNet [95], EfficientDet [96], faster-RCNN [39][80][94]. GoogLeNet and ResNet, with their variant, were the most popular. Except for learning-based methods, other methods, including the region growing algorithm [68], mean-shift [33] algorithm, template matching [97][98], and other image processing algorithms were also used for image segmentation, recognition and even amount estimation.
An early study harnessed SVM with a Gaussian radial basis kernel for training a classifier on food type achieved an accuracy of 97.3% when the training data took up to 50% of the dataset [24]. Surprisingly, only 1% of misreported nutrient information was found in the study. However, there was only one food item in each image, so the robustness of the proposed algorithm could be limited when tested on images with multiple food items or complex backgrounds [24].
For automatic and larger-scale image analysis, computer vision algorithms were then used in later research. CNNs trained by labelled image data provided another method for food classification. Im2Calories mentioned in the last section were examples of a GoogLeNet CNN being trained with different datasets created from existing datasets online. Im2 Calories [61] trained the GoogLeNet with a self-made multi-label dataset and achieved an average precision of 80% [61]. In Ref. [64], Food-11 was created for training, validation, and evaluation, resulting in recognition by 83.6% of food categories.
Deep neural networks were most likely to achieve extremely high performance (over 99% accuracy) in the classification and recognition tasks. The networks could be used for both food and fluid classification in which Inception ResNet V2, ResNet50 V2, ResNet152, MobileNet V2 and V3 and GoogleNet were seen with over 95% accuracy. Apart from deep neural networks, machine learning methods such as RF, SVM, KNN etc, could also reach over 90% accuracy. However, DL methods could require high-performance devices and be time-consuming when training and the performance of models rely on a sufficient amount of training data with variety. The value of a deep neural network lies in the trade-off between its performance and simplicity.
4.3. Intake Action Recognition
4.4. Intake Amount Estimation
References
- Vu, T.; Lin, F.; Alshurafa, N.; Xu, W. Wearable Food Intake Monitoring Technologies: A Comprehensive Review. Computers 2017, 6, 4.
- Jayatilaka, A.; Ranasinghe, D.C. Towards unobtrusive real-time fluid intake monitoring using passive UHF RFID. In Proceedings of the 2016 IEEE International Conference on RFID (RFID), Orlando, FL, USA, 3-5 May 2016; IEEE: Orlando, FL, USA, 2016; pp. 1–4.
- Burgess, R.A.; Hartley, T.; Mehdi, Q.; Mehdi, R. Monitoring of patient fluid intake using the Xbox Kinect. In Proceedings of the CGAMES’2013 USA, Louisville, KY, USA, 30 July–1 August 2013; pp. 60–64.
- Cao, E.; Watt, M.J.; Nowell, C.J.; Quach, T.; Simpson, J.S.; De Melo Ferreira, V.; Agarwal, S.; Chu, H.; Srivastava, A.; Anderson, D.; et al. Mesenteric Lymphatic Dysfunction Promotes Insulin Resistance and Represents a Potential Treatment Target in Obesity. Nat. Metab. 2021, 3, 1175–1188.
- Lauby-Secretan, B.; Scoccianti, C.; Loomis, D.; Grosse, Y.; Bianchini, F.; Straif, K. Body Fatness and Cancer—Viewpoint of the IARC Working Group. N. Engl. J. Med. 2016, 375, 794–798.
- Doulah, A.; Mccrory, M.A.; Higgins, J.A.; Sazonov, E. A Systematic Review of Technology-Driven Methodologies for Estimation of Energy Intake. IEEE Access 2019, 7, 49653–49668.
- Schoeller, D.A.; Thomas, D. Energy balance and body composition. In Nutrition for the Primary Care Provider; Karger Publishers: Basel, Switzerland, 2014.
- Wang, W.; Min, W.; Li, T.; Dong, X.; Li, H.; Jiang, S. A Review on Vision-Based Analysis for Automatic Dietary Assessment. Trends Food Sci. Technol. 2022, 122, 223–237.
- Lacey, J.; Corbett, J.; Forni, L.; Hooper, L.; Hughes, F.; Minto, G.; Moss, C.; Price, S.; Whyte, G.; Woodcock, T.; et al. A Multidisciplinary Consensus on Dehydration: Definitions, Diagnostic Methods and Clinical Implications. Ann. Med. 2019, 51, 232–251.
- Volkert, D.; Beck, A.M.; Cederholm, T.; Cruz-Jentoft, A.; Goisser, S.; Hooper, L.; Kiesswetter, E.; Maggio, M.; Raynaud-Simon, A.; Sieber, C.C.; et al. ESPEN Guideline on Clinical Nutrition and Hydration in Geriatrics. Clin. Nutr. 2019, 38, 10–47.
- Armstrong, L. Challenges of Linking Chronic Dehydration and Fluid Consumption to Health Outcomes. Nutr. Rev. 2012, 70, S121–S127.
- Manz, F.; Wentz, A. 24-h Hydration Status: Parameters, Epidemiology and Recommendations. Eur. J. Clin. Nutr. 2003, 57, S10–S18.
- Hooper, L.; Bunn, D.; Jimoh, F.O.; Fairweather-Tait, S.J. Water-Loss Dehydration and Aging. Mech. Ageing Dev. 2014, 136–137, 50–58.
- El-Sharkawy, A.M.; Sahota, O.; Maughan, R.J.; Lobo, D.N. The Pathophysiology of Fluid and Electrolyte Balance in the Older Adult Surgical Patient. Clin. Nutr. 2014, 33, 6–13.
- El-Sharkawy, A.M.; Watson, P.; Neal, K.R.; Ljungqvist, O.; Maughan, R.J.; Sahota, O.; Lobo, D.N. Hydration and Outcome in Older Patients Admitted to Hospital (The HOOP Prospective Cohort Study). Age Ageing 2015, 44, 943–947.
- Kim, S. Preventable Hospitalizations of Dehydration: Implications of Inadequate Primary Health Care in the United States. Ann. Epidemiol. 2007, 17, 736.
- Warren, J.L.; Bacon, W.E.; Harris, T.; McBean, A.M.; Foley, D.J.; Phillips, C. The Burden and Outcomes Associated with Dehydration among US Elderly, 1991. Am. J. Public Health 1994, 84, 1265–1269.
- Jimoh, F.O.; Bunn, D.; Hooper, L. Assessment of a Self-Reported Drinks Diary for the Estimation of Drinks Intake by Care Home Residents: Fluid Intake Study in the Elderly (FISE). J. Nutr. Health Aging 2015, 19, 491–496.
- Edmonds, C.J.; Harte, N.; Gardner, M. How Does Drinking Water Affect Attention and Memory? The Effect of Mouth Rinsing and Mouth Drying on Children’s Performance. Physiol. Behav. 2018, 194, 233–238.
- Doulah, A.; Ghosh, T.; Hossain, D.; Imtiaz, M.H.; Sazonov, E. “Automatic Ingestion Monitor Version 2”—A Novel Wearable Device for Automatic Food Intake Detection and Passive Capture of Food Images. IEEE J. Biomed. Health Inf. 2021, 25, 568–576.
- Rouast, P.; Adam, M.; Burrows, T.; Chiong, R.; Rollo, M. Using deep learning and 360 video to detect eating behavior for user assistance systems. In Proceedings of the Twenty-Sixth European Conference on Information Systems (ECIS2018), Portsmouth, UK, 23–28 June 2018.
- Block, G. A Review of Validations of Dietary Assessment Methods. Am. J. Epidemiol. 1982, 115, 492–505.
- Fluid Balance Charts: Do They Measure Up? Available online: https://www.magonlinelibrary.com/doi/epdf/10.12968/bjon.1994.3.16.816 (accessed on 5 April 2022).
- Zhu, F.; Bosch, M.; Boushey, C.J.; Delp, E.J. An image analysis system for dietary assessment and evaluation. In Proceedings of the 2010 IEEE International Conference on Image Processing, Hong Kong, China, 26–29 September 2010; pp. 1853–1856.
- Krebs, P.; Duncan, D.T. Health App Use Among US Mobile Phone Owners: A National Survey. JMIR mHealth uHealth 2015, 3, e101.
- Sen, S.; Subbaraju, V.; Misra, A.; Balan, R.; Lee, Y. Annapurna: Building a real-world smartwatch-based automated food journal. In Proceedings of the 2018 IEEE 19th International Symposium on “A World of Wireless, Mobile and Multimedia Networks” (WoWMoM), Chania, Greece, 12–15 June 2018; pp. 1–6.
- Sen, S.; Subbaraju, V.; Misra, A.; Balan, R.; Lee, Y. Annapurna: An Automated Smartwatch-Based Eating Detection and Food Journaling System. Pervasive Mob. Comput. 2020, 68, 101259.
- Thomaz, E.; Parnami, A.; Essa, I.; Abowd, G.D. Feasibility of identifying eating moments from first-person images leveraging human computation. In Proceedings of the SenseCam ‘13: 4th International SenseCam & Pervasive Imaging Conference, San Diego, CA, USA, 18–19 November 2013; ACM Press: New York, NY, USA, 2013; pp. 26–33.
- Bedri, A.; Li, D.; Khurana, R.; Bhuwalka, K.; Goel, M. FitByte: Automatic diet monitoring in unconstrained situations using multimodal sensing on eyeglasses. In Proceedings of the 2020 CHI Conference on Human Factors in Computing Systems, Honolulu, HI, USA, 25–30 April 2021; ACM: New York, NY, USA, 2020; pp. 1–12.
- Cunha, A.; Pádua, L.; Costa, L.; Trigueiros, P. Evaluation of MS Kinect for Elderly Meal Intake Monitoring. Procedia Technol. 2014, 16, 1383–1390.
- Obaid, A.K.; Abdel-Qader, I.; Mickus, M. Automatic food-intake monitoring system for persons living with Alzheimer’s-vision-based embedded system. In Proceedings of the 2018 9th IEEE Annual Ubiquitous Computing, Electronics Mobile Communication Conference (UEMCON), New York, NY, USA, 8–10 November 2018; pp. 580–584.
- Hossain, D.; Ghosh, T.; Sazonov, E. Automatic Count of Bites and Chews from Videos of Eating Episodes. IEEE Access 2020, 8, 101934–101945.
- Hafiz, R.; Islam, S.; Khanom, R.; Uddin, M.S. Image based drinks identification for dietary assessment. In Proceedings of the 2016 International Workshop on Computational Intelligence (IWCI), Dhaka, Bangladesh, 12–13 December 2016; pp. 192–197.
- Automatic Meal Intake Monitoring Using Hidden Markov Models | Elsevier Enhanced Reader. Available online: https://reader.elsevier.com/reader/sd/pii/S1877050916322980?token=11F68A53BC12E070DB5891E8BEA3ACDCC32BEB1B24D82F1AAEFBBA65AA6016F2E9009A4B70146365DDA53B667BB161D7&originRegion=eu-west-1&originCreation=20220216180556 (accessed on 16 February 2022).
- Al-Anssari, H.; Abdel-Qader, I. Vision based monitoring system for Alzheimer’s patients using controlled bounding boxes tracking. In Proceedings of the 2016 IEEE International Conference on Electro Information Technology (EIT), Grand Forks, ND, USA, 19–21 May 2016; pp. 821–825.
- Davies, A.; Chan, V.; Bauman, A.; Signal, L.; Hosking, C.; Gemming, L.; Allman-Farinelli, M. Using Wearable Cameras to Monitor Eating and Drinking Behaviours during Transport Journeys. Eur. J. Nutr. 2021, 60, 1875–1885.
- Jia, W.; Li, Y.; Qu, R.; Baranowski, T.; Burke, L.E.; Zhang, H.; Bai, Y.; Mancino, J.M.; Xu, G.; Mao, Z.-H.; et al. Automatic Food Detection in Egocentric Images Using Artificial Intelligence Technology. Public Health Nutr. 2019, 22, 1168–1179.
- Gemming, L.; Doherty, A.; Utter, J.; Shields, E.; Ni Mhurchu, C. The Use of a Wearable Camera to Capture and Categorise the Environmental and Social Context of Self-Identified Eating Episodes. Appetite 2015, 92, 118–125.
- Du, B.; Lu, C.X.; Kan, X.; Wu, K.; Luo, M.; Hou, J.; Li, K.; Kanhere, S.; Shen, Y.; Wen, H. HydraDoctor: Real-Time liquids intake monitoring by collaborative sensing. In Proceedings of the 20th International Conference on Distributed Computing and Networking, Bangalore, India, 4–7 January 2019; Association for Computing Machinery: New York, NY, USA, 2019; pp. 213–217.
- Kong, F.; Tan, J. DietCam: Automatic Dietary Assessment with Mobile Camera Phones. Pervasive Mob. Comput. 2012, 8, 147–163.
- Hongu, N.; Pope, B.T.; Bilgiç, P.; Orr, B.J.; Suzuki, A.; Kim, A.S.; Merchant, N.C.; Roe, D.J. Usability of a Smartphone Food Picture App for Assisting 24-Hour Dietary Recall: A Pilot Study. Nutr. Res. Pract. 2015, 9, 207–212.
- Ahmad, Z.; Khanna, N.; Kerr, D.A.; Boushey, C.J.; Delp, E.J. A mobile phone user interface for image-based dietary assessment. In Mobile Devices and Multimedia: Enabling Technologies, Algorithms, and Applications 2014; SPIE—The International Society for Optical Engineering: Bellingham, WA, USA, 2014; Volume 9030, p. 903007.
- Raju, V.; Sazonov, E. Processing of egocentric camera images from a wearable food intake sensor. In Proceedings of the 2019 SoutheastCon, Huntsville, AL, USA, 11–14 April 2019; pp. 1–6.
- Vinay Chandrasekhar, K.; Imtiaz, M.H.; Sazonov, E. Motion-Adaptive image capture in a body-worn wearable sensor. In Proceedings of the 2018 IEEE SENSORS, New Delhi, India, 28–31 October 2018; pp. 1–4.
- Gemming, L.; Rush, E.; Maddison, R.; Doherty, A.; Gant, N.; Utter, J.; Mhurchu, C.N. Wearable Cameras Can Reduce Dietary Under-Reporting: Doubly Labelled Water Validation of a Camera-Assisted 24 h Recall. Br. J. Nutr. 2015, 113, 284–291.
- Seiderer, A.; Flutura, S.; André, E. Development of a mobile multi-device nutrition logger. In Proceedings of the 2nd ACM SIGCHI International Workshop on Multisensory Approaches to Human-Food Interaction, Glasgow, UK, 13 November 2017; ACM: New York, NY, USA, 2017; pp. 5–12.
- Schiboni, G.; Wasner, F.; Amft, O. A privacy-preserving wearable camera setup for dietary event spotting in free-living. In Proceedings of the 2018 IEEE International Conference on Pervasive Computing and Communications Workshops (PerCom Workshops), Athens, Greece, 19–23 March 2018; pp. 872–877.
- Sen, S.; Subbaraju, V.; Misra, A.; Balan, R.K.; Lee, Y. Experiences in building a real-world eating recogniser. In Proceedings of the 4th International on Workshop on Physical Analytics—WPA ‘17, Niagara Falls, NY, USA, 19 June 2017; ACM Press: New York, NY, USA, 2017; pp. 7–12.
- Jia, W.; Chen, H.-C.; Yue, Y.; Li, Z.; Fernstrom, J.; Bai, Y.; Li, C.; Sun, M. Accuracy of Food Portion Size Estimation from Digital Pictures Acquired by a Chest-Worn Camera. Public Health Nutr. 2014, 17, 1671–1681.
- Cippitelli, E.; Gasparrini, S.; Gambi, E.; Spinsante, S. Unobtrusive intake actions monitoring through RGB and depth information fusion. In Proceedings of the 2016 IEEE 12th International Conference on Intelligent Computer Communication and Processing (ICCP), Cluj-Napoca, Romania, 8–10 September 2016; pp. 19–26.
- Cippitelli, E.; Gambi, E.; Spinsante, S.; Gasparrini, S.; Florez-Revuelta, F. Performance analysis of self-organising neural networks tracking algorithms for intake monitoring using Kinect. In Proceedings of the IET International Conference on Technologies for Active and Assisted Living (TechAAL), London, UK, 5 November 2015; Institution of Engineering and Technology: London, UK, 2015; p. 6.
- Blechert, J.; Liedlgruber, M.; Lender, A.; Reichenberger, J.; Wilhelm, F.H. Unobtrusive Electromyography-Based Eating Detection in Daily Life: A New Tool to Address Underreporting? Appetite 2017, 118, 168–173.
- Maekawa, T. A sensor device for automatic food lifelogging that is embedded in home ceiling light: A preliminary investigation. In Proceedings of the 2013 7th International Conference on Pervasive Computing Technologies for Healthcare and Workshops, Venice, Italy, 5–8 May 2013.
- Iosifidis, A.; Marami, E.; Tefas, A.; Pitas, I. Eating and drinking activity recognition based on discriminant analysis of fuzzy distances and activity volumes. In Proceedings of the 2012 IEEE International Conference on Acoustics, Speech and Signal Processing (ICASSP), Kyoto, Japan, 25–30 March 2012; pp. 2201–2204.
- bin Kassim, M.F.; Mohd, M.N.H. Food Intake Gesture Monitoring System Based-on Depth Sensor. Bull. Electr. Eng. Inform. 2019, 8, 470–476.
- Das, S.; Dai, R.; Koperski, M.; Minciullo, L.; Garattoni, L.; Bremond, F.; Francesca, G. Toyota smarthome: Real-World activities of daily living. In Proceedings of the 2019 IEEE/CVF International Conference on Computer Vision (ICCV), Seoul, Republic of Korea, 27 October–2 November 2019.
- Lo, F.P.-W.; Sun, Y.; Qiu, J.; Lo, B. A Novel Vision-Based Approach for Dietary Assessment Using Deep Learning View Synthesis. In Proceedings of the 2019 IEEE 16th International Conference on Wearable and Implantable Body Sensor Networks (BSN), Chicago, IL, USA, 19–22 May 2019; pp. 1–4.
- Farooq, M.; Doulah, A.; Parton, J.; McCrory, M.A.; Higgins, J.A.; Sazonov, E. Validation of Sensor-Based Food Intake Detection by Multicamera Video Observation in an Unconstrained Environment. Nutrients 2019, 11, 609.
- qm13 Azure Kinect Body Tracking Joints. Available online: https://docs.microsoft.com/en-us/azure/kinect-dk/body-joints (accessed on 23 June 2022).
- Kassim, M.F.; Mohd, M.N.H.; Tomari, M.R.M.; Suriani, N.S.; Zakaria, W.N.W.; Sari, S. A Non-Invasive and Non-Wearable Food Intake Monitoring System Based on Depth Sensor. Bull. Electr. Eng. Inform. 2020, 9, 2342–2349.
- Myers, A.; Johnston, N.; Rathod, V.; Korattikara, A.; Gorban, A.; Silberman, N.; Guadarrama, S.; Papandreou, G.; Huang, J.; Murphy, K. Im2Calories: Towards an automated mobile vision food diary. In Proceedings of the 2015 IEEE International Conference on Computer Vision (ICCV), Santiago, Chile, 7–13 December 2015; IEEE: New York, NY, USA, 2015; pp. 1233–1241.
- Rachakonda, L.; Mohanty, S.P.; Kougianos, E. iLog: An Intelligent Device for Automatic Food Intake Monitoring and Stress Detection in the IoMT. IEEE Trans. Consum. Electron. 2020, 66, 115–124.
- Hossain, D.; Imtiaz, M.H.; Ghosh, T.; Bhaskar, V.; Sazonov, E. Real-Time food intake monitoring using wearable egocnetric camera. In Proceedings of the 2020 42nd Annual International Conference of the IEEE Engineering in Medicine Biology Society (EMBC), Montreal, QC, Canada, 20–24 July 2020; pp. 4191–4195.
- Singla, A.; Yuan, L.; Ebrahimi, T. Food/Non-Food image classification and food categorization using pre-trained GoogLeNet model. In Proceedings of the 2nd International Workshop on Multimedia Assisted Dietary Management, Amsterdam, The Netherlands, 16 October 2016; ACM: New York, NY, USA, 2016; pp. 3–11.
- Beltran, A.; Dadabhoy, H.; Chen, T.A.; Lin, C.; Jia, W.; Baranowski, J.; Yan, G.; Sun, M.; Baranowski, T. Adapting the eButton to the Abilities of Children for Diet Assessment. Proc. Meas. Behav. 2016, 2016, 72–81.
- Ramesh, A.; Raju, V.B.; Rao, M.; Sazonov, E. Food detection and segmentation from egocentric camera images. In Proceedings of the 2021 43rd Annual International Conference of the IEEE Engineering in Medicine & Biology Society (EMBC), Guadalajara, Mexico, 1–5 November 2021; pp. 2736–2740.
- Mezgec, S.; Koroušić Seljak, B. NutriNet: A Deep Learning Food and Drink Image Recognition System for Dietary Assessment. Nutrients 2017, 9, 657.
- Zhang, Z.; Mao, S.; Chen, K.; Xiao, L.; Liao, B.; Li, C.; Zhang, P. CNN and PCA based visual system of a wheelchair manipulator robot for automatic drinking. In Proceedings of the 2018 IEEE International Conference on Robotics and Biomimetics (ROBIO), Kuala Lumpur, Malaysia, 12–15 December 2018; pp. 1280–1286.
- Lee, J.; Banerjee, A.; Gupta, S.K.S. MT-Diet: Automated smartphone based diet assessment with infrared images. In Proceedings of the 2016 IEEE International Conference on Pervasive Computing and Communications (PerCom), Sydney, NSW, Australia, 14–19 March 2016; pp. 1–6.
- McAllister, P.; Zheng, H.; Bond, R.; Moorhead, A. Combining Deep Residual Neural Network Features with Supervised Machine Learning Algorithms to Classify Diverse Food Image Datasets. Comput. Biol. Med. 2018, 95, 217–233.
- Jiang, H.; Starkman, J.; Liu, M.; Huang, M.-C. Food Nutrition Visualization on Google Glass: Design Tradeoff and Field Evaluation. IEEE Consum. Electron. Mag. 2018, 7, 21–31.
- Matei, A.; Glavan, A.; Radeva, P.; Talavera, E. Towards Eating Habits Discovery in Egocentric Photo-Streams. IEEE Access 2021, 9, 17495–17506.
- Matsuda, Y.; Hoashi, H.; Yanai, K. Recognition of multiple-food images by detecting candidate regions. In Proceedings of the 2012 IEEE International Conference on Multimedia and Expo, Melbourne, VIC, Australia, 9–13 July 2012; pp. 25–30.
- Anthimopoulos, M.M.; Gianola, L.; Scarnato, L.; Diem, P.; Mougiakakou, S.G. A Food Recognition System for Diabetic Patients Based on an Optimized Bag-of-Features Model. IEEE J. Biomed. Health Inform. 2014, 18, 1261–1271.
- Park, S.-J.; Palvanov, A.; Lee, C.-H.; Jeong, N.; Cho, Y.-I.; Lee, H.-J. The Development of Food Image Detection and Recognition Model of Korean Food for Mobile Dietary Management. Nutr. Res. Pract. 2019, 13, 521–528.
- Mezgec, S.; Koroušić Seljak, B. Deep Neural Networks for Image-Based Dietary Assessment. J. Vis. Exp. 2021, 169, e61906.
- Bolaños, M.; Radeva, P. Simultaneous food localization and recognition. In Proceedings of the 2016 23rd International Conference on Pattern Recognition (ICPR), Cancun, Mexico, 4–8 December 2016; pp. 3140–3145.
- Ciocca, G.; Micali, G.; Napoletano, P. State Recognition of Food Images Using Deep Features. IEEE Access 2020, 8, 32003–32017.
- Fuchs, K.; Haldimann, M.; Grundmann, T.; Fleisch, E. Supporting Food Choices in the Internet of People: Automatic Detection of Diet-Related Activities and Display of Real-Time Interventions via Mixed Reality Headsets. Futur. Gener. Comp. Syst. 2020, 113, 343–362.
- Ruenin, P.; Bootkrajang, J.; Chawachat, J. A system to estimate the amount and calories of food that elderly people in the hospital consume. In Proceedings of the 11th International Conference on Advances in Information Technology, Bangkok, Thailand, 1–3 July 2020; Association for Computing Machinery: New York, NY, USA, 2020; pp. 1–7.
- Lu, Y.; Stathopoulou, T.; Vasiloglou, M.F.; Pinault, L.F.; Kiley, C.; Spanakis, E.K.; Mougiakakou, S. goFOODTM: An Artificial Intelligence System for Dietary Assessment. Sensors 2020, 20, 4283.
- Mezgec, S.; Seljak, B.K. Using deep learning for food and beverage image recognition. In Proceedings of the 2019 IEEE International Conference on Big Data (Big Data), Los Angeles, CA, USA, 9–12 December 2019; pp. 5149–5151.
- Aguilar, E.; Remeseiro, B.; Bolaños, M.; Radeva, P. Grab, Pay, and Eat: Semantic Food Detection for Smart Restaurants. IEEE Trans. Multimed. 2018, 20, 3266–3275.
- Gao, J.; Tan, W.; Ma, L.; Wang, Y.; Tang, W. MUSEFood: Multi-Sensor-Based food volume estimation on smartphones. In Proceedings of the 2019 IEEE SmartWorld, Ubiquitous Intelligence & Computing, Advanced & Trusted Computing, Scalable Computing & Communications, Cloud & Big Data Computing, Internet of People and Smart City Innovation (SmartWorld/SCALCOM/UIC/ATC/CBDCom/IOP/SCI), Leicester, UK, 19–23 August 2019; pp. 899–906.
- Yumang, A.N.; Banguilan, D.E.S.; Veneracion, C.K.S. Raspberry PI based food recognition for visually impaired using YOLO algorithm. In Proceedings of the 2021 5th International Conference on Communication and Information Systems (ICCIS), Chongqing, China, 15–17 October 2021; pp. 165–169.
- Li, H.; Yang, G. Dietary Nutritional Information Autonomous Perception Method Based on Machine Vision in Smart Homes. Entropy 2022, 24, 868.
- Martinel, N.; Piciarelli, C.; Foresti, G.L.; Micheloni, C. Mobile food recognition with an extreme deep tree. In Proceedings of the ICDSC 2016: 10th International Conference on Distributed Smart Camera, Paris, France, 12–15 September 2016; Association for Computing Machinery: New York, NY, USA, 2016; pp. 56–61.
- Martinel, N.; Piciarelli, C.; Micheloni, C.; Foresti, G.L. A structured committee for food recognition. In Proceedings of the 2015 IEEE International Conference on Computer Vision Workshop (ICCVW), Santiago, Chile, 7–13 December 2015; pp. 484–492.
- Martinel, N.; Piciarelli, C.; Micheloni, C. A Supervised Extreme Learning Committee for Food Recognition. Comput. Vis. Image Underst. 2016, 148, 67–86.
- Zhao, H.; Yap, K.-H.; Chichung Kot, A. Fusion learning using semantics and graph convolutional network for visual food recognition. In Proceedings of the 2021 IEEE Winter Conference on Applications of Computer Vision (WACV), Waikoloa, HI, USA, 3–8 January 2021; pp. 1710–1719.
- Nguyen, H.-T.; Ngo, C.-W.; Chan, W.-K. SibNet: Food Instance Counting and Segmentation. Pattern Recognit. 2022, 124, 108470.
- Martinez, E.T.; Leyva-Vallina, M.; Sarker, M.M.K.; Puig, D.; Petkov, N.; Radeva, P. Hierarchical Approach to Classify Food Scenes in Egocentric Photo-Streams. IEEE J. Biomed. Health Inform. 2020, 24, 866–877.
- Sarapisto, T.; Koivunen, L.; Mäkilä, T.; Klami, A.; Ojansivu, P. Camera-Based meal type and weight estimation in self-service lunch line restaurants. In Proceedings of the 2022 12th International Conference on Pattern Recognition Systems (ICPRS), Saint-Etienne, France, 7–10 June 2022; pp. 1–7.
- Qiu, J.; Lo, F.P.-W.; Gu, X.; Jobarteh, M.L.; Jia, W.; Baranowski, T.; Steiner-Asiedu, M.; Anderson, A.K.; McCrory, M.A.; Sazonov, E.; et al. Egocentric image captioning for privacy-preserved passive dietary intake monitoring. In IEEE Transactions on Cybernetics; IEEE: New York, NY, USA, 2021.
- Tomescu, V.-I. FoRConvD: An approach for food recognition on mobile devices using convolutional neural networks and depth maps. In Proceedings of the 2020 IEEE 14th International Symposium on Applied Computational Intelligence and Informatics (SACI), Timisoara, Romania, 21–23 May 2020; pp. 000129–000134.
- Liu, Y.-C.; Onthoni, D.D.; Mohapatra, S.; Irianti, D.; Sahoo, P.K. Deep-Learning-Assisted Multi-Dish Food Recognition Application for Dietary Intake Reporting. Electronics 2022, 11, 1626.
- Chae, J.; Woo, I.; Kim, S.; Maciejewski, R.; Zhu, F.; Delp, E.J.; Boushey, C.J.; Ebert, D.S. Volume estimation using food specific shape templates in mobile image-based dietary assessment. In Computational Imaging IX; Bouman, C.A., Pollak, I., Wolfe, P.J., Eds.; SPIE—The International Society for Optical Engineering: Bellingham, WA, USA, 2011; Volume 7873, p. 78730K.
- Bellandi, P.; Sansoni, G.; Vertuan, A. Development and Characterization of a Multi-Camera 2D-Vision System for Enhanced Performance of a Drink Serving Robotic Cell. Robot. Comput.-Integr. Manuf. 2012, 28, 35–49.
- Rachakonda, L.; Kothari, A.; Mohanty, S.P.; Kougianos, E.; Ganapathiraju, M. Stress-Log: An IoT-Based smart system to monitor stress-eating. In Proceedings of the 2019 IEEE International Conference on Consumer Electronics (ICCE), Las Vegas, NV, USA, 11–13 January 2019; pp. 1–6.
- Lu, Y.; Allegra, D.; Anthimopoulos, M.; Stanco, F.; Farinella, G.M.; Mougiakakou, S. A multi-task learning approach for meal assessment. In Proceedings of the CEA/MADiMa2018: Joint Workshop on Multimedia for Cooking and Eating Activities and Multimedia Assisted Dietary Management in conjunction with the 27th International Joint Conference on Artificial Intelligence IJCAI, Stockholm, Sweden, 15 July 2018; pp. 46–52.
- Fang, S.; Liu, C.; Zhu, F.; Delp, E.J.; Boushey, C.J. Single-View food portion estimation based on geometric models. In Proceedings of the 2015 IEEE International Symposium on Multimedia (ISM), Miami, FL, USA, 14–16 December 2015; pp. 385–390.
- Puri, M.; Zhu, Z.; Yu, Q.; Divakaran, A.; Sawhney, H. Recognition and volume estimation of food intake using a mobile device. In Proceedings of the 2009 Workshop on Applications of Computer Vision (WACV), Snowbird, UT, USA, 7–8 December 2009; pp. 1–8.
- Woo, I.; Otsmo, K.; Kim, S.; Ebert, D.S.; Delp, E.J.; Boushey, C.J. Automatic portion estimation and visual refinement in mobile dietary assessment. In Proceedings of the Computational Imaging VIII, San Jose, CA, USA, 4 February 2010; Bouman, C.A., Pollak, I., Wolfe, P.J., Eds.; SPIE—The International Society for Optical Engineering: Bellingham, WA, USA, 2010; pp. 188–197.
- Chiu, M.-C.; Chang, S.-P.; Chang, Y.-C.; Chu, H.-H.; Chen, C.C.-H.; Hsiao, F.-H.; Ko, J.-C. Playful bottle: A mobile social persuasion system to motivate healthy water intake. In Proceedings of the 11th International Conference on Ubiquitous Computing, Orlando, FL, USA, 30 September–3 October 2019; Association for Computing Machinery: New York, NY, USA, 2009; pp. 185–194.

