 +1 credit
| Version | Summary | Created by | Modification | Content Size | Created at | Operation |
|---|---|---|---|---|---|---|
| 1 | SHUAI LING | -- | 2600 | 2023-07-12 12:01:39 | | | |
| 2 | Jessie Wu | + 11 word(s) | 2611 | 2023-07-13 04:56:12 | | |
Video Upload Options
Industrial land is an indispensable strategic resource in urban development that plays an indispensable role in ensuring the industrial space of urban construction and development. Measuring and analyzing the eco-efficiency of industrial land utilization (ECILU) can provide insights into how to maximize the input–output ratio of industrial land and ensure the sustainable development of land resources and economies.
1. Background
The eco-efficiency of industrial land utilization (ECILU) will be used to evaluate the utilization rate of industrial land from both economic and ecological aspects. Its improvement is the key to China’s economic transformation and ecological civilization construction, and it is an urgent task to be faced at this stage. At present, the Chinese urbanization process is rapidly developing. As the carrier of the industrial economy, industrial land has also shown a steady growth trend, but there remain widespread problems, such as disorderly use, idle waste, low floor area rate, and low output [1]. The land-use model with high extensiveness, high pollution, and low efficiency restricts the sustainable development of Chinese industries. Considering the vast Chinese territory and the differences between the realities of various economic zones, general administrative guidance at the national level is difficult to truly implement. Therefore, it is an urgent task at this stage to take effective governance measures for different places, improve the allocation mode of industrial land resources, and increase the ECILU to better alleviate the local problems of industrial land in different cities and metropolitan areas and realize intensive, economical, and efficient use of land and sustainable development throughout the country. In addition, China’s original intention and goal of building a “resource-saving” and “environment-friendly” society also require us to embrace the industrialization of sustainable development that is oriented toward integrating ecological factors into the evaluation of industrial land efficiency while maintaining the economic output of steady national growth, thereby striving to reduce the negative external effects of resource waste and environmental pollution to improve economic output and social well-being to a greater extent while maintaining public interests [2][3].
2. Comparison of the Eco-Efficiency of Industrial Land Utilization
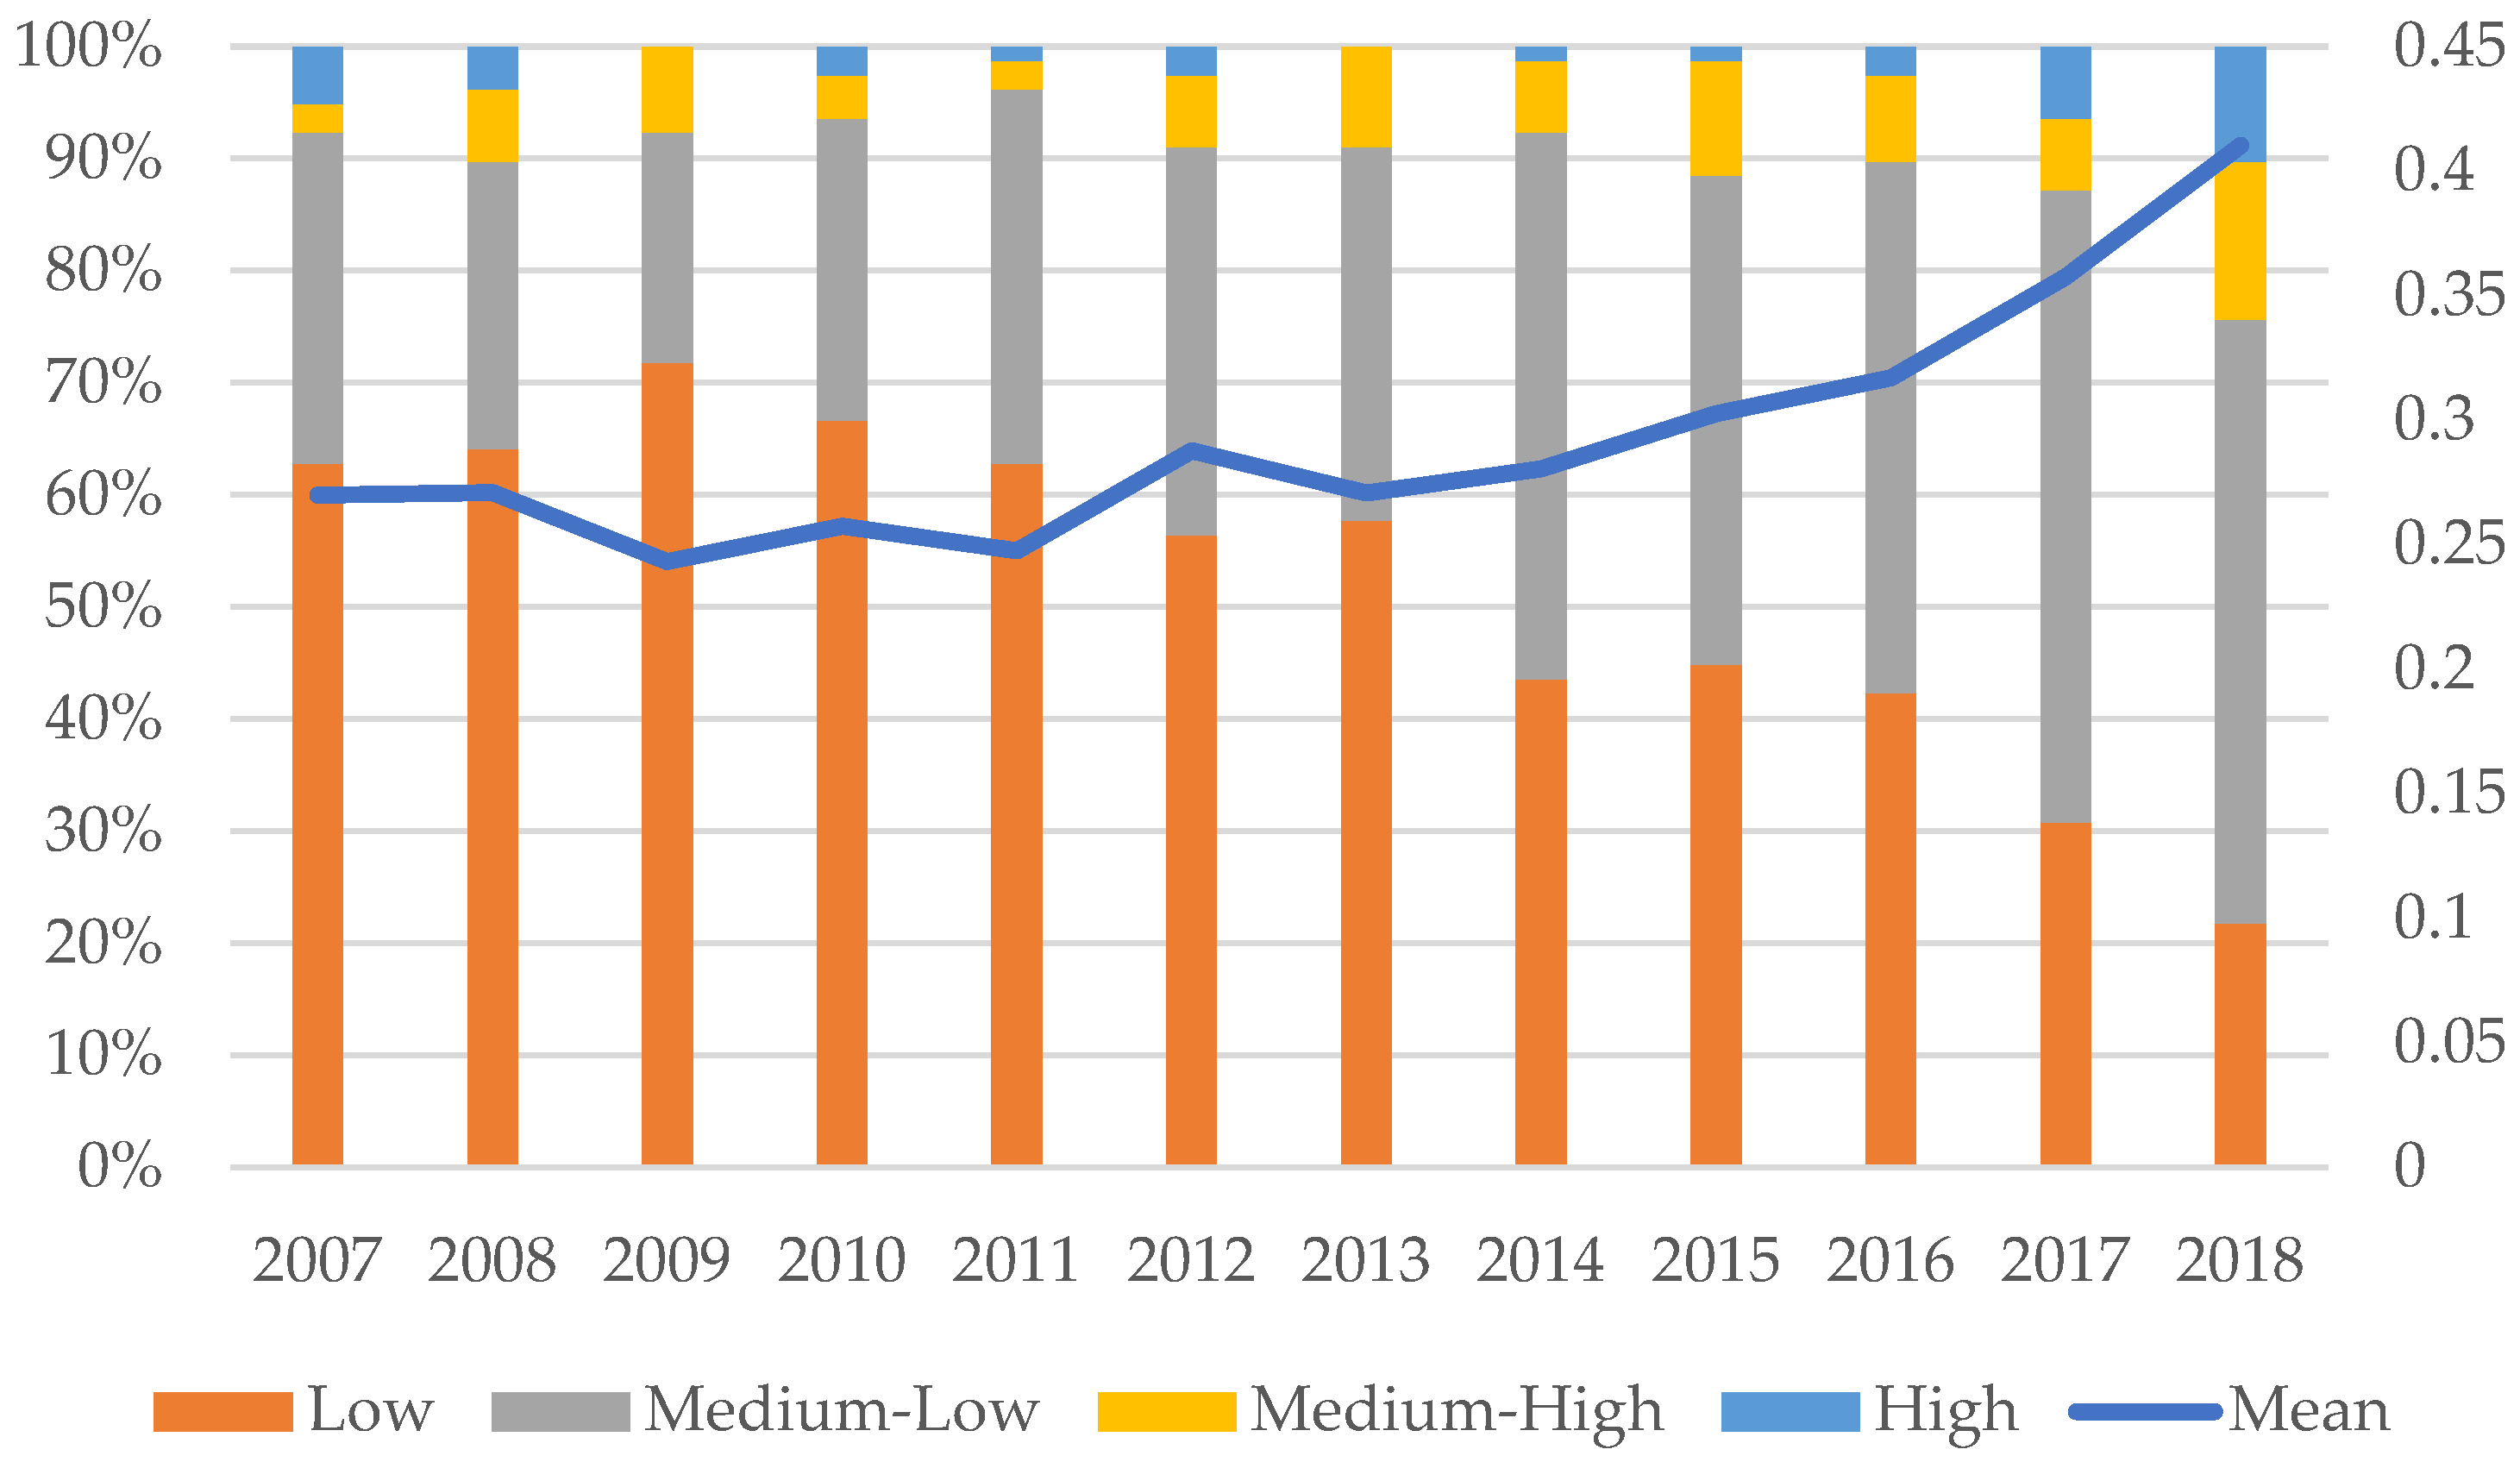
| Year | Mean | Maximum | Minimum | ECILU Levels | |||
|---|---|---|---|---|---|---|---|
| Low | Medium–Low | Medium–High | High | ||||
| 2007 | 0.2699 | 1.0000 | 0.1024 | 49 | 23 | 2 | 4 |
| 2008 | 0.2709 | 1.0000 | 0.0942 | 50 | 20 | 5 | 3 |
| 2009 | 0.2432 | 0.7068 | 0.0891 | 56 | 16 | 6 | 0 |
| 2010 | 0.2574 | 1.0000 | 0.1056 | 52 | 21 | 3 | 2 |
| 2011 | 0.2475 | 1.0000 | 0.0998 | 49 | 26 | 2 | 1 |
| 2012 | 0.2876 | 1.0000 | 0.0863 | 44 | 27 | 5 | 2 |
| 2013 | 0.2707 | 0.6887 | 0.0810 | 45 | 26 | 7 | 0 |
| 2014 | 0.2804 | 0.7620 | 0.0953 | 34 | 38 | 5 | 1 |
| 2015 | 0.3026 | 0.8825 | 0.1111 | 35 | 34 | 8 | 1 |
| 2016 | 0.3169 | 1.0000 | 0.1773 | 33 | 37 | 6 | 2 |
| 2017 | 0.3574 | 1.0000 | 0.1613 | 24 | 44 | 5 | 5 |
| 2018 | 0.4103 | 1.0000 | 0.1239 | 17 | 42 | 11 | 8 |
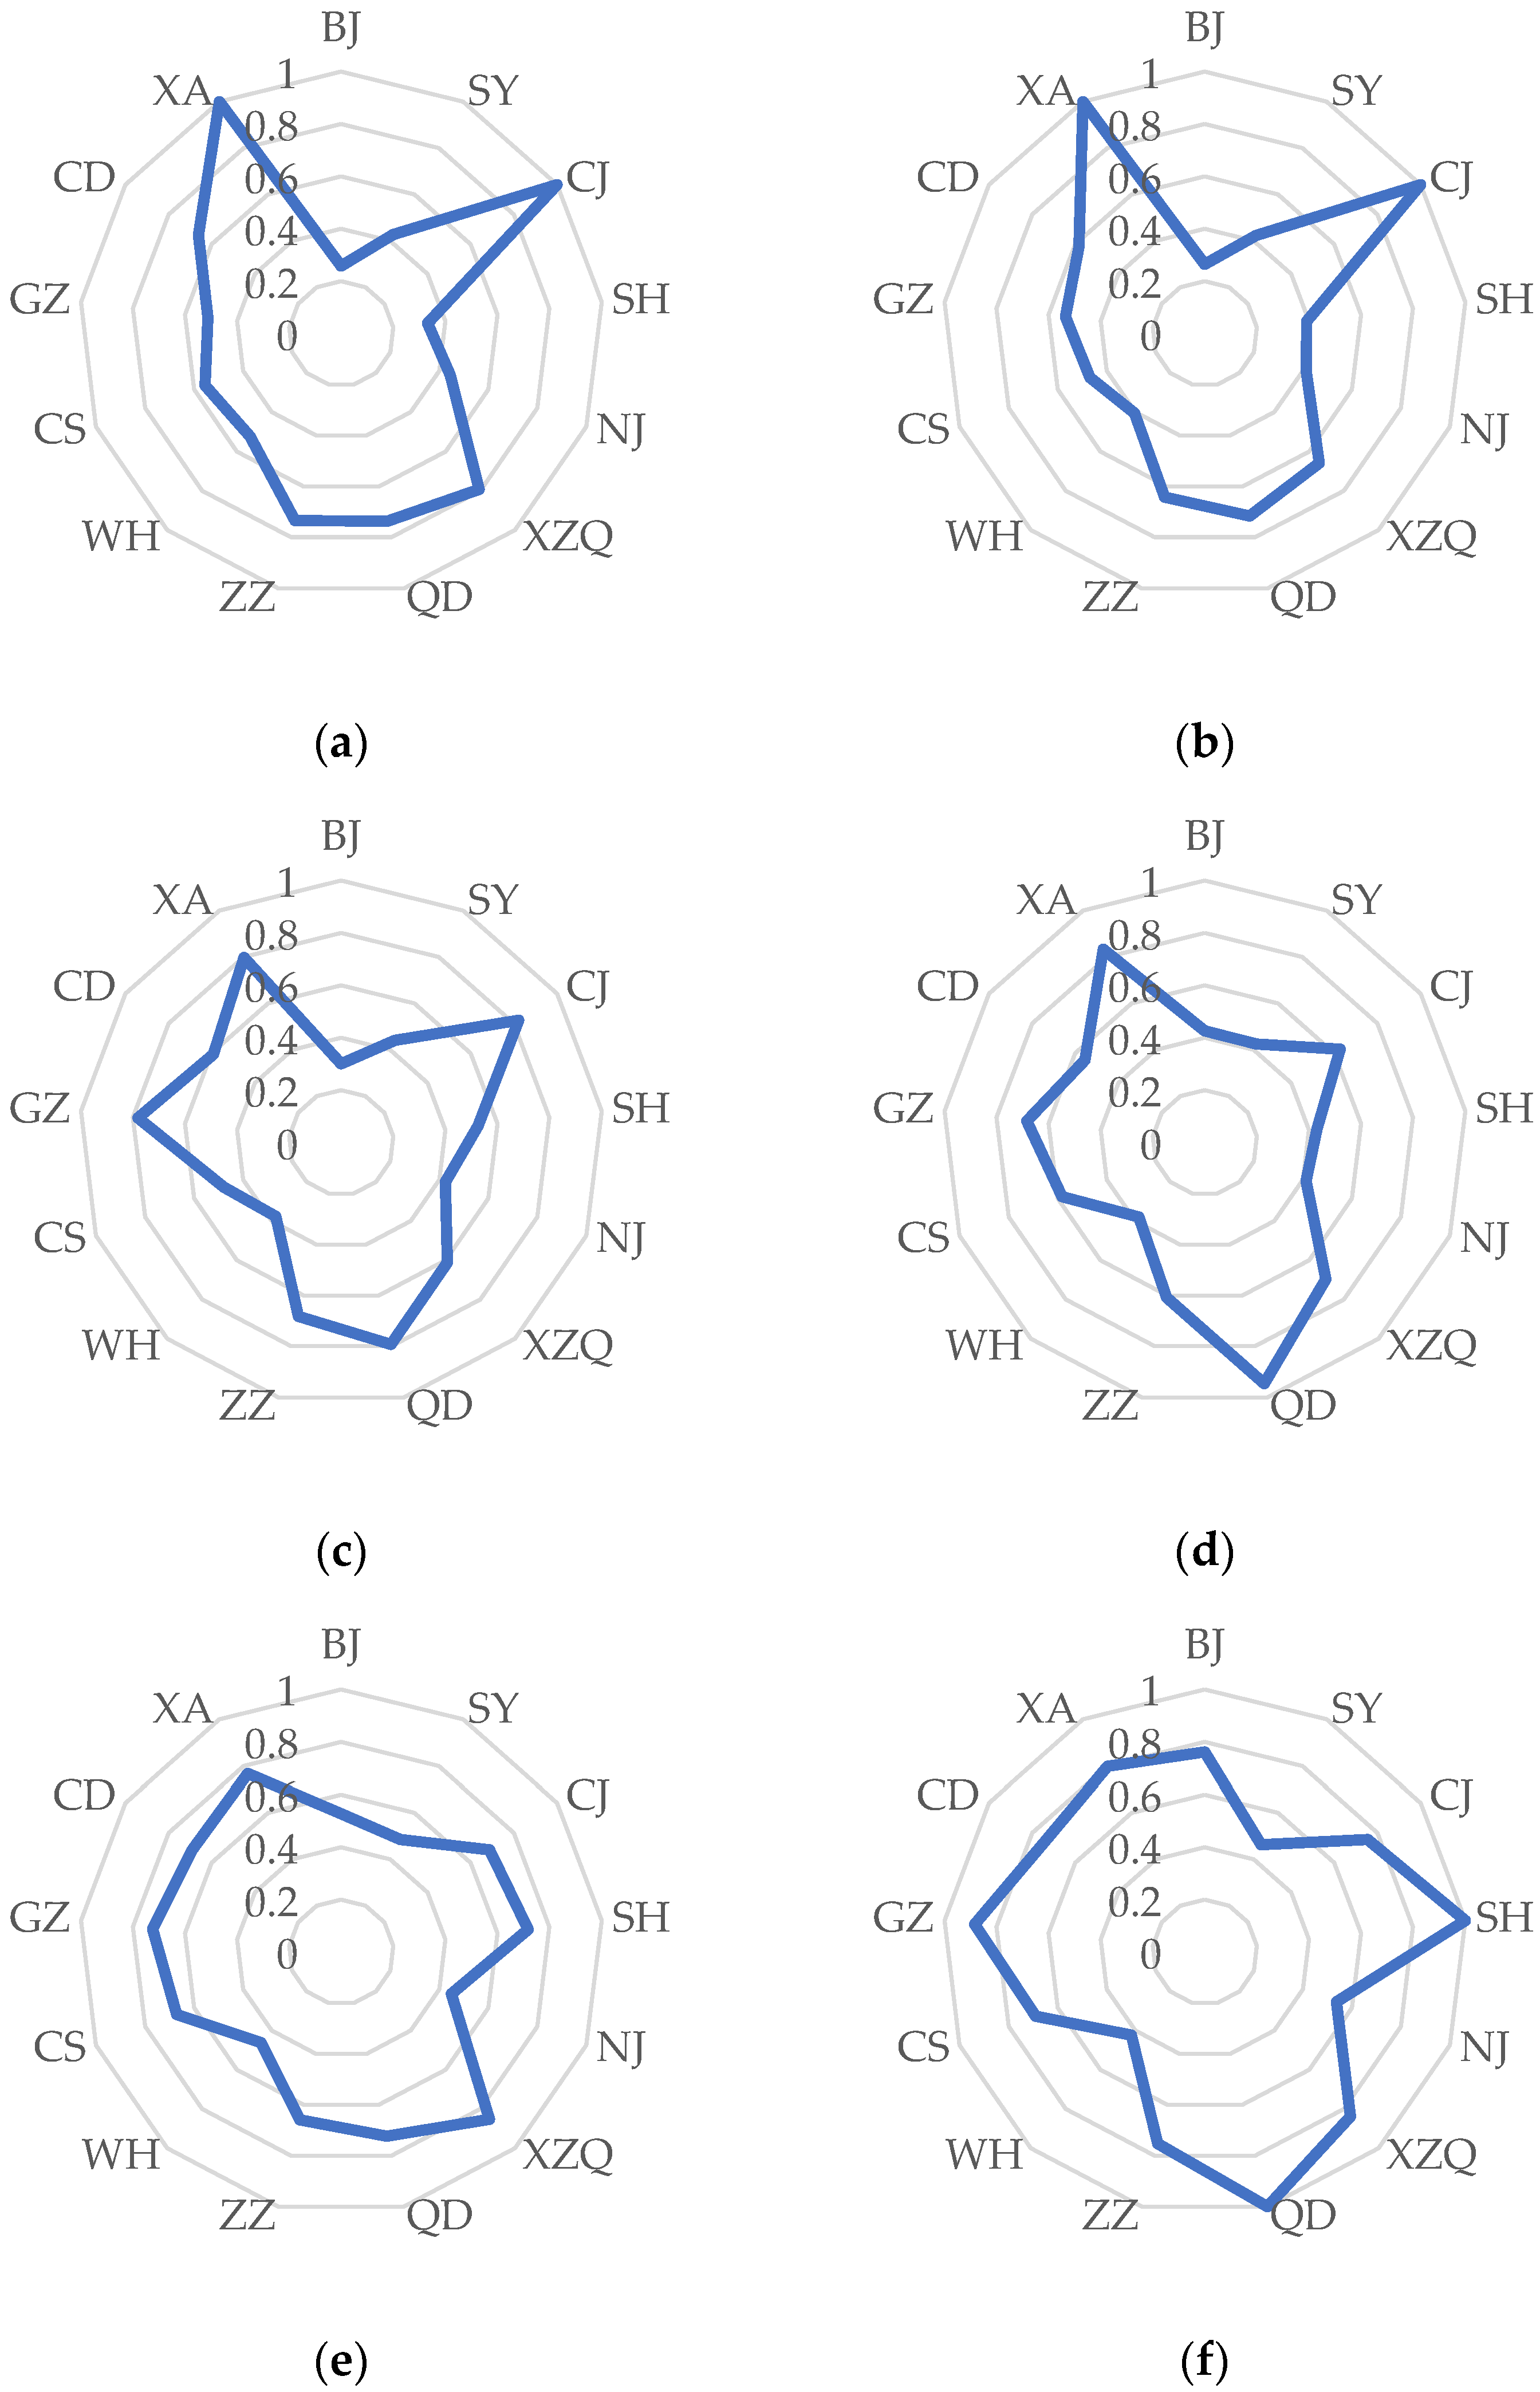
3. Spatial and Temporal Differences in Eco-Efficiency of Industrial Land Utilizations in Metropolitan Areas
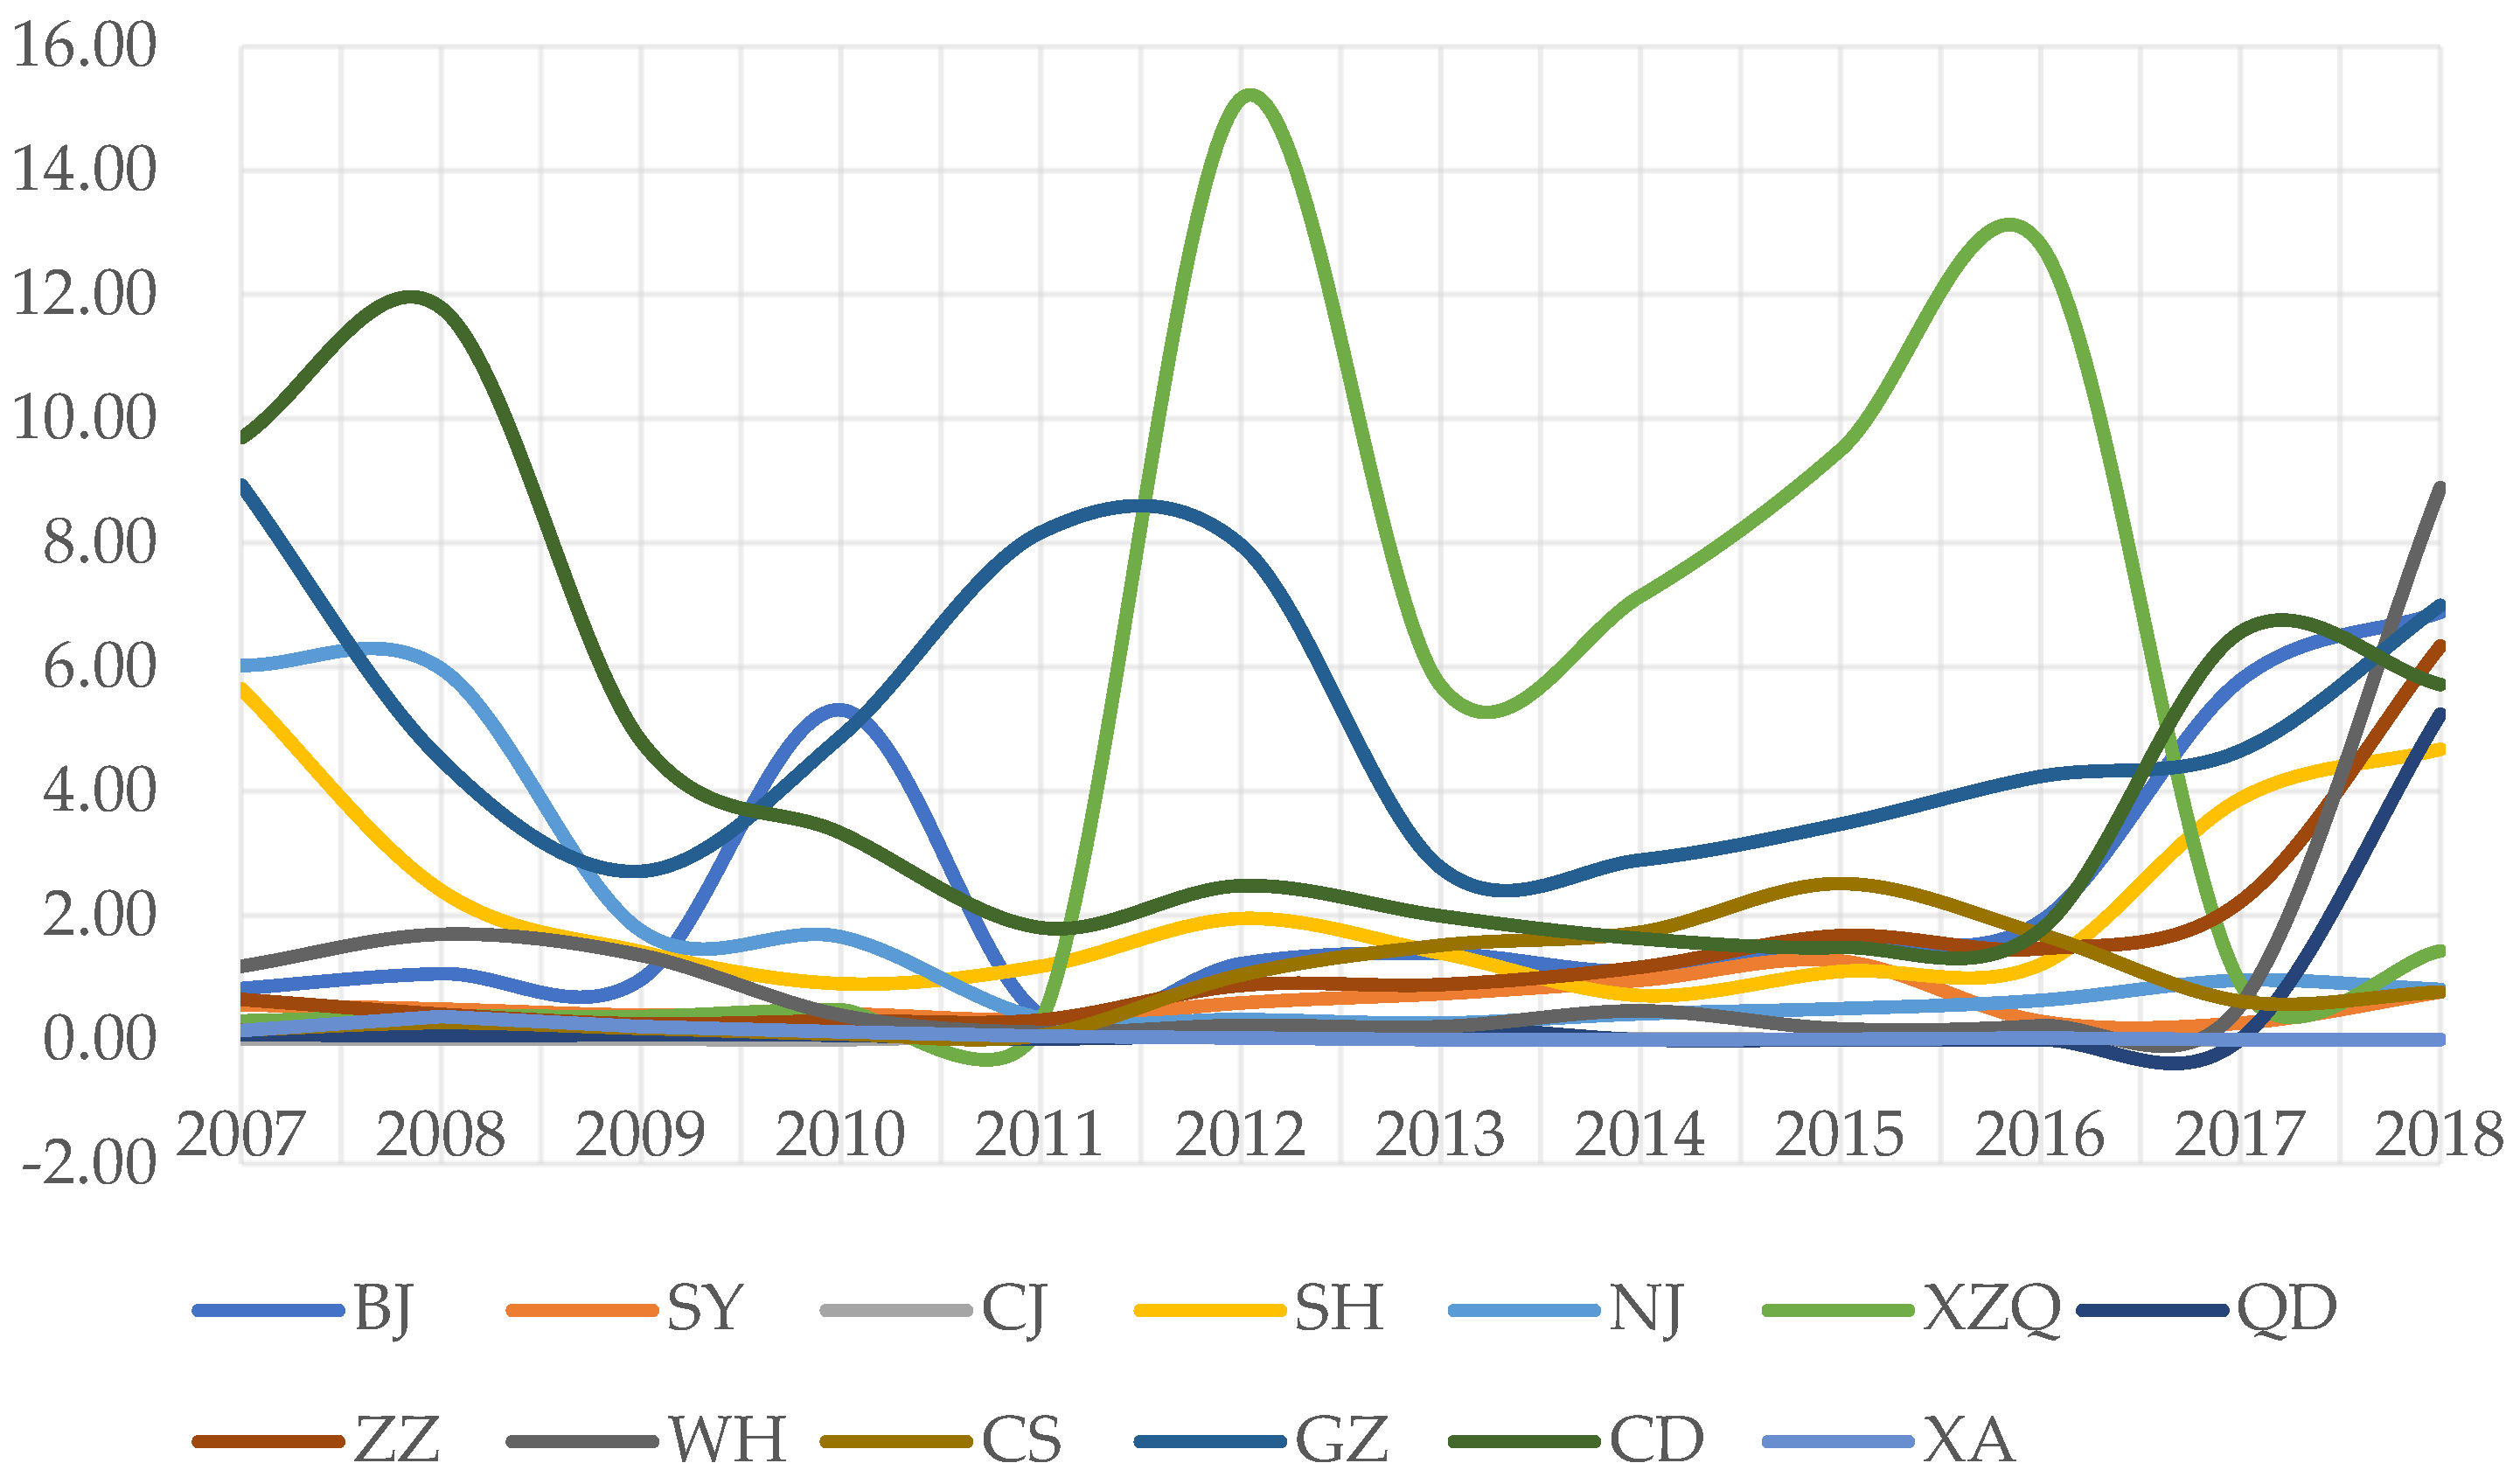
| Year | BJ | SY | CJ | SH | NJ | XZQ | QD | ZZ | WH | CS | GZ | CD | XA |
|---|---|---|---|---|---|---|---|---|---|---|---|---|---|
| 2007 | 0.83 | 0.56 | 0.01 | 5.65 | 6.03 | 0.30 | 0.09 | 0.65 | 1.18 | 0.16 | 8.94 | 9.70 | 0.14 |
| 2008 | 1.06 | 0.49 | 0.01 | 2.40 | 5.98 | 0.39 | 0.06 | 0.41 | 1.70 | 0.27 | 4.51 | 11.8 | 0.37 |
| 2009 | 0.98 | 0.40 | 0.01 | 1.42 | 1.76 | 0.38 | 0.08 | 0.26 | 1.36 | 0.18 | 2.71 | 4.81 | 0.21 |
| 2010 | 5.31 | 0.42 | 0.01 | 0.90 | 1.66 | 0.48 | 0.07 | 0.31 | 0.39 | 0.09 | 4.89 | 3.33 | 0.13 |
| 2011 | 0.39 | 0.33 | 0.07 | 1.18 | 0.35 | 0.29 | 0.01 | 0.32 | 0.12 | 0.07 | 8.17 | 1.81 | 0.06 |
| 2012 | 1.23 | 0.60 | 0.09 | 1.95 | 0.33 | 15.2 | 0.08 | 0.88 | 0.23 | 1.05 | 7.97 | 2.48 | 0.03 |
| 2013 | 1.39 | 0.74 | 0.04 | 1.40 | 0.27 | 5.70 | 0.20 | 0.89 | 0.21 | 1.52 | 2.77 | 1.99 | 0.00 |
| 2014 | 1.10 | 0.96 | 0.02 | 0.71 | 0.42 | 7.15 | 0.00 | 1.17 | 0.47 | 1.74 | 2.90 | 1.63 | 0.00 |
| 2015 | 1.56 | 1.27 | 0.01 | 1.10 | 0.50 | 9.50 | 0.01 | 1.68 | 0.18 | 2.52 | 3.47 | 1.49 | 0.01 |
| 2016 | 1.91 | 0.30 | 0.00 | 1.21 | 0.64 | 12.8 | 0.00 | 1.47 | 0.23 | 1.70 | 4.24 | 1.77 | 0.03 |
| 2017 | 5.79 | 0.27 | 0.00 | 3.88 | 0.96 | 0.90 | 0.01 | 2.23 | 0.56 | 0.62 | 4.66 | 6.57 | 0.00 |
| 2018 | 6.89 | 0.77 | 0.01 | 4.68 | 0.82 | 1.43 | 5.24 | 6.34 | 8.89 | 0.77 | 6.99 | 5.73 | 0.00 |
4. Analysis of the Influencing Factors of the Eco-Efficiency of Industrial Land Utilization
| Explanatory Variable | Explained Variable: the ECILU | ||||
|---|---|---|---|---|---|
| All Samples | Eastern Zone | Northeastern Zone | Central Zone | Western Zone | |
| gdp | 0.1213337 *** (0.000) |
0.1320097 *** (0.000) |
0.0770858 *** (0.001) |
0.0926126 *** (0.000) |
−0.0573272 (0.447) |
| ic | −0.0038424 (0.870) |
−0.0825258 ** (0.035) |
0.0622304 (0.124) |
0.0453927 (0.215) |
0.2991415 ** (0.002) |
| rpq | −0.0528232 *** (0.000) |
−0.0590623 *** (0.000) |
−0.0501857 *** (0.000) |
−0.0332701 ** (0.002) |
−0.0572474 *** (0.000) |
| drm | −0.0325802 ** (0.021) |
−0.0325819 (0.120) |
−0.0128263 (0.578) |
−0.0378645 * (0.073) |
0.0424439 (0.561) |
| icl | −0.0240317 ** (0.007) |
−0.0254135 ** (0.039) |
0.0209241 (0.138) |
−0.0972003 *** (0.000) |
−0.0121398 (0.758) |
| rg | −0.0053223 (0.427) |
0.0112974 (0.302) |
−0.010946 ** (0.073) |
0.0767977 *** (0.000) |
−0.0562089 ** (0.049) |
| wp | −0.0019175 (0.692) |
−0.0157632 ** (0.025) |
−0.0131907 * (0.084) |
−0.0221559 ** (0.026) |
0.0305218 (0.129) |
| sp | −0.0245648 *** (0.000) |
−0.0253258 *** (0.000) |
−0.0245787 ** (0.002) |
−0.0136374 * (0.058) |
−0.0451033 ** (0.004) |
-
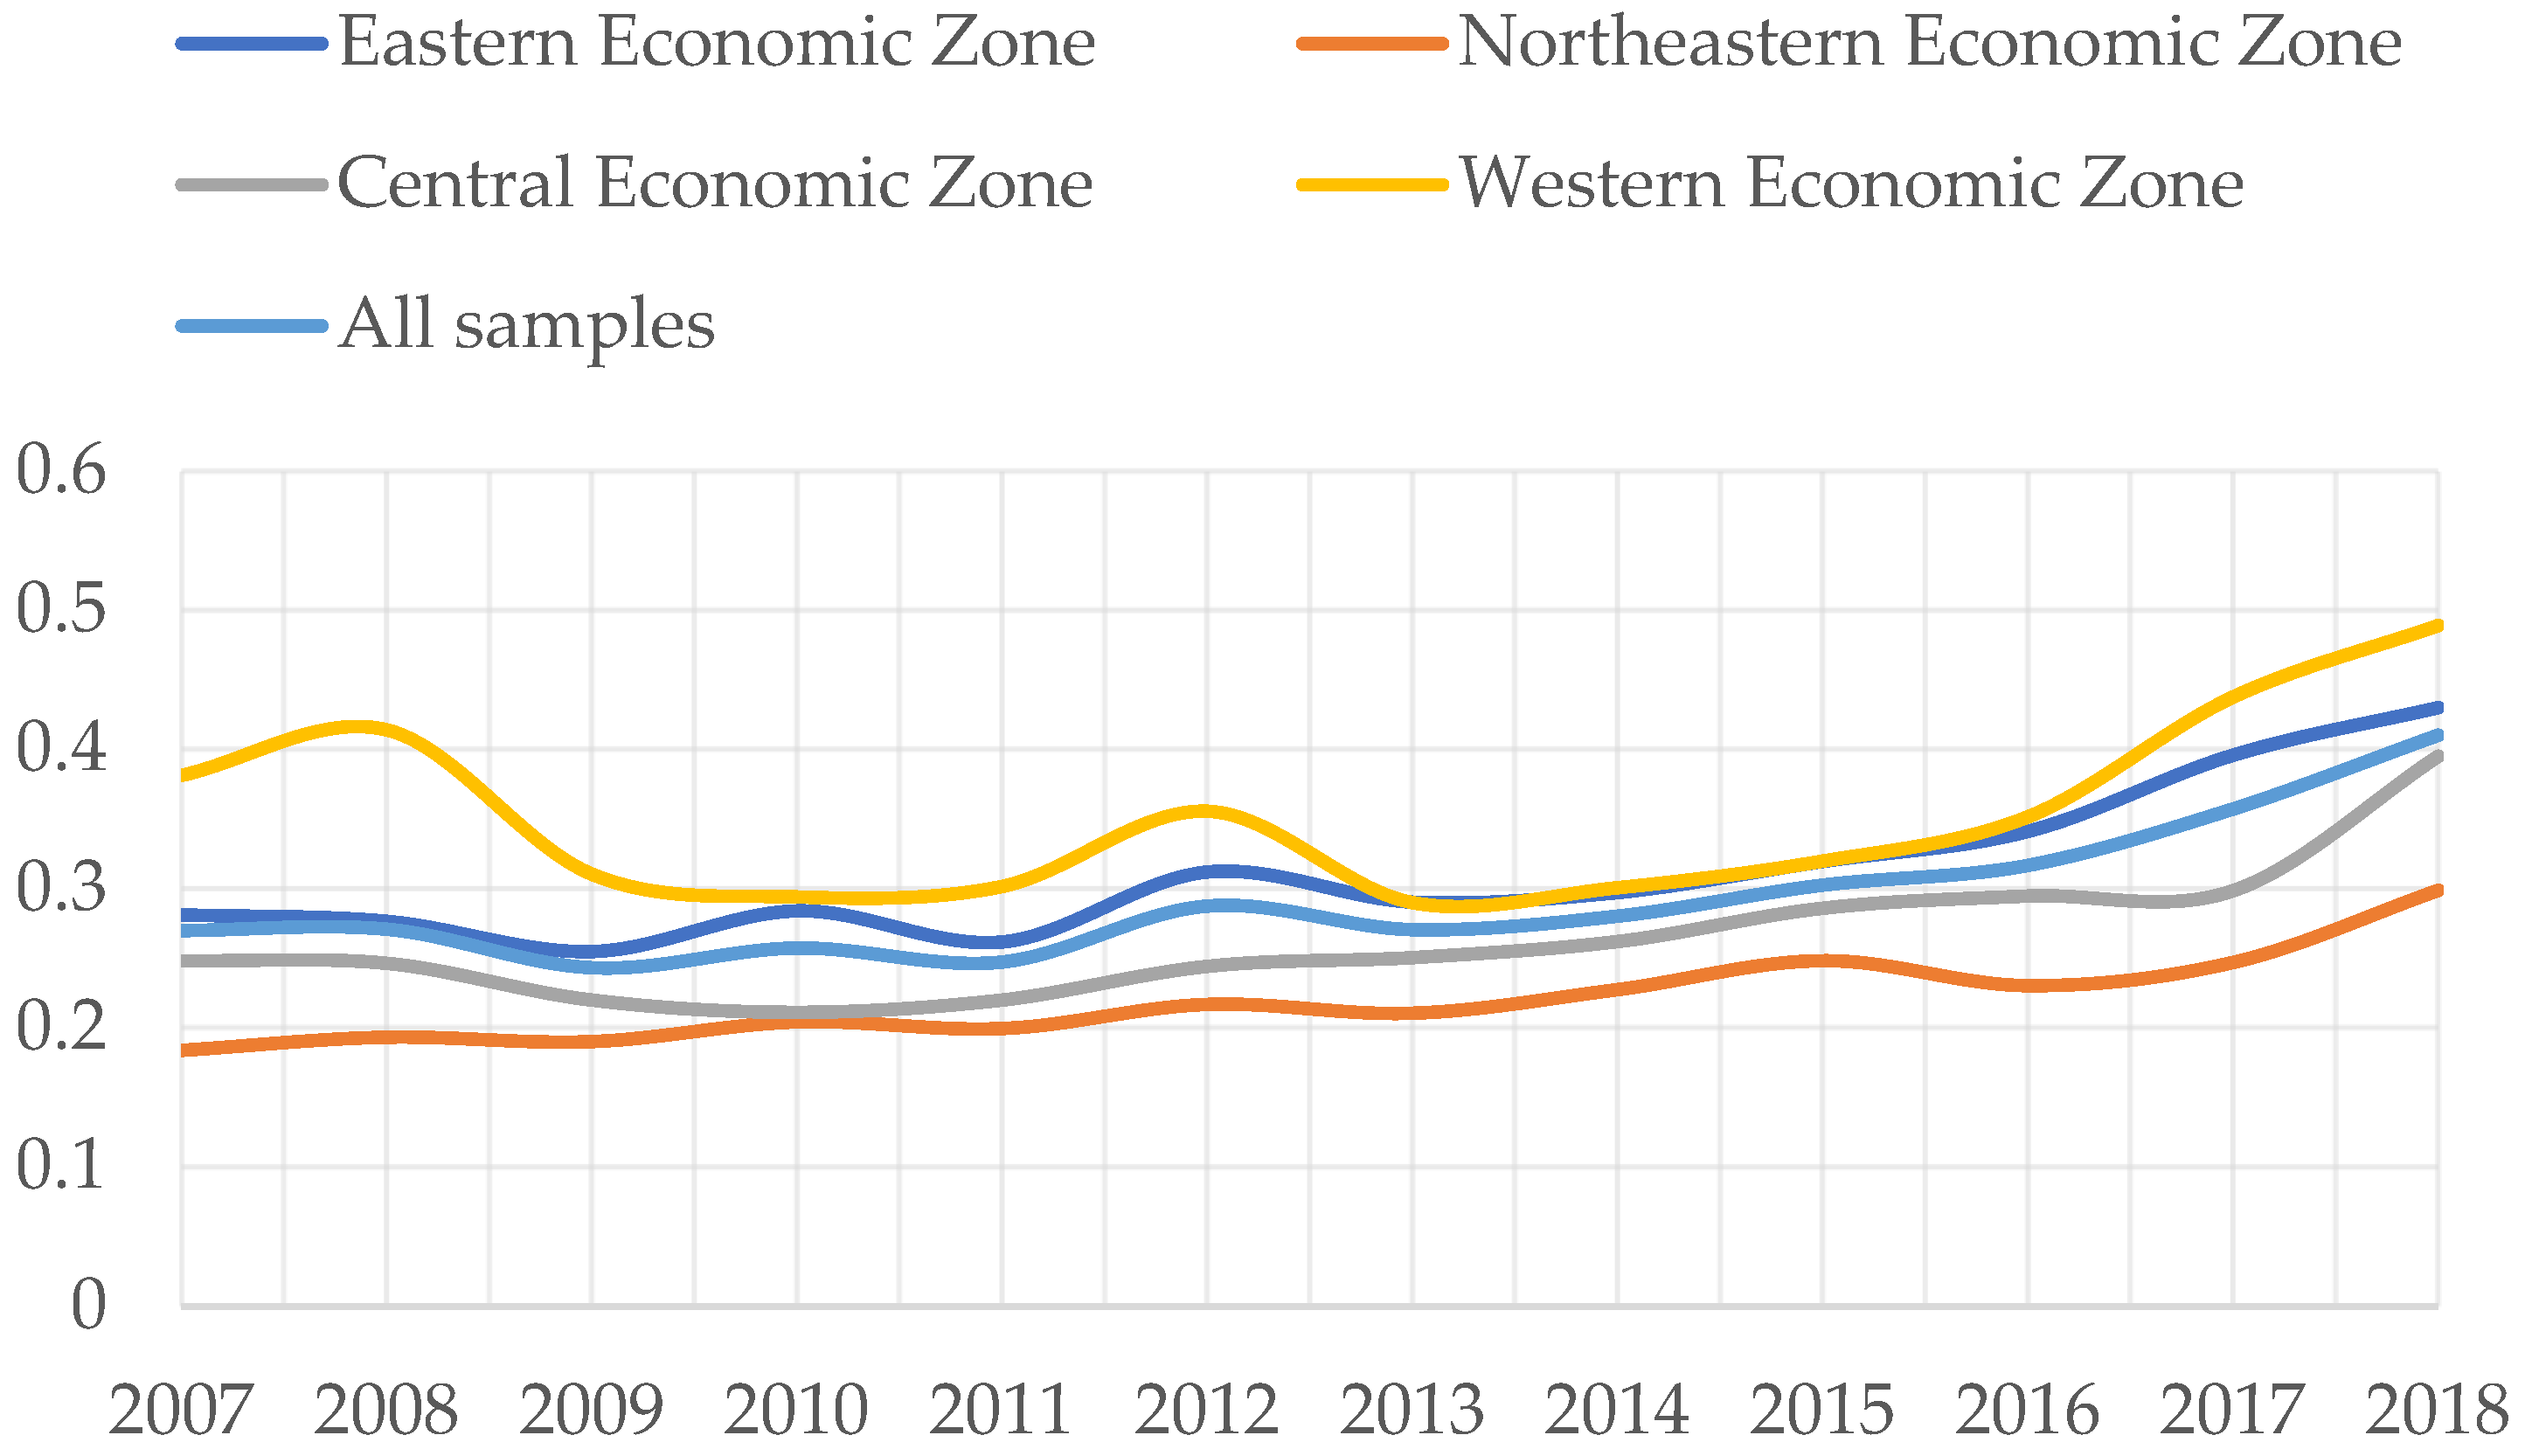
The urban scales of the Eastern, Central, and Northeastern Economic Zones had an appreciable impact on their ECILUs, and the regression coefficients were all positive. The industrial economy affected the ecological efficiency of industrial land by providing support for ecological environment protection, but there were significant differences in the effects of different regions [5], which may have been the reason why the urban scale did not have a significant impact on the Western Economic Zone. Therefore, each economic zone should pay attention to the positive role of urban scale, and strengthen the introduction of regional factors and industrial upgrading by expanding the economic scale of cities.
-
Industrial structure had a negative correlation with the Eastern Economic Zone and a positive correlation with the Western Economic Zone. Within a certain range, the improvement in the industrial structure level will affect the allocation mode of various resources and transfer them in the direction conducive to industrial development. However, when the industrial structure level reaches a certain standard under the combined effect of the siphon effect and the negative externality of environmental pollution, it may hinder the improvement of ECILU. Existing research showed that large cities mainly improve eco-efficiency by influencing the tertiary industries, and other small- and medium-sized cities mainly improve eco-efficiency via the secondary industries [6]. Therefore, it is suggested that the Western Economic Zone should strengthen industrial and ecological construction in the construction of metropolitan areas, and also innovate the internal inter-city cooperation mechanism [7].
-
Regional population quality had a significant impact on the ECILUs of all economic zones, and the impact coefficients were all negative. The allocation of labor among industries and regions is a direct manifestation of the efficiency of economic operation [8]. The negative correlation shown in the regression results may have been due to the existence of a large surplus of industrial labor, which had a negative impact on the ECILUs [9]. It is recommended that the economic zones appropriately reduce the proportion of industrial labor to slow down the phenomenon of labor surplus.
-
The degree of regional marketization had an appreciable impact on the ECILU only in the Central Economic Zone, and the regression coefficient was −0.0378645. The vitality of the market is crucial to industrial efficiency [10]. Industrial agglomerations and transfers have become the main ways for China to improve industrial efficiency [11]. However, when the negative crowding effect caused by industrial agglomeration brought by the marketization level is greater than the positive scale effect, it will have a negative impact on the ECILU.
-
There was a significant negative correlation between the level of infrastructure construction and ECILU in the Eastern and Central Economic Zones. Cross-regional transportation and other infrastructure construction provide logistic guarantees for local industrial agglomerations, and industrial agglomerations can also promote the use of urban land resources and reduce the total cost of industrial activities through external economies of scale [12][13]. However, in fact, the eastern and central parts of China are flat and the spatial distribution of public transportation services is uneven [14]. This research suggests that scientific planning of road transportation and other infrastructure should be strengthened, road utilization should be improved, and an efficient connection between public transportation and land use should be established [15].
-
The area of regional green coverage had a negatively correlated and significant impact on the Northeastern and Western Economic Zones, and a positively correlated impact on the Central Economic Zone. Compared with the Central and Eastern Economic Zones, it can be explained that the more green areas in the Northeastern and Western Economic Zones may compress industrial land and limit the growth of the industrial economy, while the green areas in the Central Economic Zone may greatly improve the local ecology. Improving ECILU entails the common development of “economy” and “ecology.” Therefore, each economic zone should jointly promote industrial economic growth and environmental protection and realize their harmony.
-
The regression coefficients of industrial wastewater pollution and sulfur dioxide pollution for ECILU were both negative. This is consistent with existing research. Industrialization has brought serious pollution problems to the ecological environment, resulting in the decline of water and air quality, soil structure destruction, etc., and has severely weakened the ecosystem service functions of concentrated industrial areas [16]. Therefore, strengthening the city’s management of industrial production factors and reducing pollutant emissions is one of the important ways to improve ECILU on the basis of building a sustainable city [17].
5. Summary
The ECILU was not the same as the level of local industrial economic development; therefore, ECILU evaluation based on economic benefits as the output index will no longer apply to the needs of high-quality urban development. In the future, when evaluating ECILU, the local government should establish a better evaluation system that includes economic, social, ecological, and other factors, rather than blindly pursuing economic development and sacrificing social and environmental benefits. Meanwhile, in order to increase the growth of the industrial economy and the ECILU while ensuring environmentally friendly development, it is necessary to reinforce the flow of resources and factors between cities and promote coordination between cities in the metropolitan area to truly implement the policy guidance of local governments in improving the utilization of industrial land, optimizing the spatial layout of urban land, and promoting the coordinated and high-quality development of cities.
References
- Wu, Q.; Zhang, X.; Shang, Z.; Li, Z. Political-economy based institutional industry complex and sustainable development: The case of the salt-chemical industry in Huai’an, China. Energy Policy 2015, 87, 39–47.
- Seyfang, G.; Smith, A. Grassroots innovations for sustainable development: Towards a new research and policy agenda. Environ. Polit. 2007, 16, 584–603.
- Krekel, C.; Kolbe, J.; Wuestemann, H. The greener, the happier? The effect of urban land use on residential well-being. Ecol. Econ. 2016, 121, 117–127.
- Wang, Q.P.; Chen, Z.Q.; Bai, X.; Wei, H.; Shen, P.Z. Plant Operation Working Condition of the Optimal Combination of External Research Division. In Proceedings of the 2016 3rd International Conference on Information and Communication Technology for Education (ICTE 2016), Toronto, ON, Canada, 2–3 August 2016; pp. 333–338.
- Chen, W.; Shen, Y.; Wang, Y.; Wu, Q. The effect of industrial relocation on industrial land use efficiency in China: A spatial econometrics approach. J. Clean. Prod. 2018, 205, 525–535.
- Huang, Y.; Li, L.; Yu, Y.T. Does urban cluster promote the increase of urban eco-efficiency? Evidence from Chinese cities. J. Clean. Prod. 2018, 197, 957–971.
- Li, L.; Ma, S.; Zheng, Y.; Xiao, X. Integrated regional development: Comparison of urban agglomeration policies in China. Land Use Pol. 2022, 114, 1–14.
- Xia, B.; Dong, S.C.; Li, Y.; Li, Z.; Sun, D.; Zhang, W.; Li, W.L. Evolution Characters and Influencing Factors of Regional Eco-Efficiency in a Developing Country: Evidence from Mongolia. Int. J. Environ. Res. Public Health 2021, 18, 719.
- Xie, H.; Wang, W. Spatiotemporal differences and convergence of urban industrial land use efficiency for China’s major economic zones. J. Geogr. Sci. 2015, 25, 1183–1198.
- Ying, Q.W.; Yousaf, T.; Akhtar, Y.; Rasheed, M.S. Stock Investment and Excess Returns: A Critical Review in the Light of the Efficient Market Hypothesis. J. Risk Financ. Manag. 2019, 12, 97.
- Head, K.; Ries, J.; Swenson, D. Agglomeration benefits and location choice: Evidence from Japanese manufacturing investments in the United States. J. Int. Econ. 1995, 38, 223–247.
- Li, C.X.; Gao, X.; He, B.J.; Wu, J.; Wu, K.N. Coupling Coordination Relationships between Urban-Industrial Land Use Efficiency and Accessibility of Highway Networks: Evidence from Beijing-Tianjin-Hebei Urban Agglomeration, China. Sustainability 2019, 11, 1446.
- Han, W.; Zhang, Y.; Cai, J.; Ma, E. Does Urban Industrial Agglomeration Lead to the Improvement of Land Use Efficiency in China? An Empirical Study from a Spatial Perspective. Sustainability 2019, 11, 986.
- Hassan, S.T.; Zhu, B.Z.; Lee, C.C.; Ahmad, P.; Sadiq, M. Asymmetric impacts of public service “transportation” on the environmental pollution in China. Environ. Impact Assess. Rev. 2021, 91, 1–11.
- Polzin, S.E. Transportation/land-use relationship: Public transit’s impact on land use. J. Urb. Plan. Dev. 1999, 125, 135–151.
- Ji, S.W.; Ma, S.H. The effects of industrial pollution on ecosystem service value: A case study in a heavy industrial area, China. Environ. Dev. Sustain. 2021, 1, 1–30.
- Li, L.; Zheng, Y.; Zheng, S.; Ke, H. The new smart city programme: Evaluating the effect of the internet of energy on air quality in China. Sci. Total Environ. 2020, 714, 1–17.

