Your browser does not fully support modern features. Please upgrade for a smoother experience.
Submitted Successfully!
 +1 credit
Thank you for your contribution! You can also upload a video entry or images related to this topic.
For video creation, please contact our Academic Video Service.
| Version | Summary | Created by | Modification | Content Size | Created at | Operation |
|---|---|---|---|---|---|---|
| 1 | Chiara Chirilli | -- | 3860 | 2023-07-08 12:01:35 | | | |
| 2 | Fanny Huang | Meta information modification | 3860 | 2023-07-10 04:19:33 | | |
Video Upload Options
We provide professional Academic Video Service to translate complex research into visually appealing presentations. Would you like to try it?
Cite
If you have any further questions, please contact Encyclopedia Editorial Office.
Fassio, F.; Chirilli, C. Monitoring Tools Applied to the Food System. Encyclopedia. Available online: https://encyclopedia.pub/entry/46573 (accessed on 24 June 2026).
Fassio F, Chirilli C. Monitoring Tools Applied to the Food System. Encyclopedia. Available at: https://encyclopedia.pub/entry/46573. Accessed June 24, 2026.
Fassio, Franco, Chiara Chirilli. "Monitoring Tools Applied to the Food System" Encyclopedia, https://encyclopedia.pub/entry/46573 (accessed June 24, 2026).
Fassio, F., & Chirilli, C. (2023, July 08). Monitoring Tools Applied to the Food System. In Encyclopedia. https://encyclopedia.pub/entry/46573
Fassio, Franco and Chiara Chirilli. "Monitoring Tools Applied to the Food System." Encyclopedia. Web. 08 July, 2023.
Copy Citation
One of the greatest challenges the world is facing is ensuring equitable access to food for a growing population with an increasing demand for food, while increasing pressure on sustainability puts a great strain on both the environment and society. Global food security is becoming an increasingly serious problem and it is now clear that food waste is one of the key issues because of the significant negative environmental, social, and economic impacts it causes, so it is also the key to a more sustainable resolution of the global waste challenge.
indicators
food system
food waste
1. Food Loss and Waste in the Food System
Over 1.9 billion tons of solid waste are generated every year around the world, of which more than 1.3 billion tons correspond to goods that are wasted or lost along the food supply chain. The actual rate of food loss is responsible for considerable environmental impacts, in addition to economic and social costs as it accounts for one-third of global food production. The issue of food waste and loss is now on the rise and affects all actors in the food supply chain [1].
Consequently, by convention in the EU when referring to food waste (FW) is defined as all food products that are absolutely edible but instead of being destined for human consumption are lost throughout the food chain.
The huge quantities of FL and FW, with the significant consequent environmental, economic, and social problems, determine the need to go beyond the concept of a linear economy and to think about the development of a production process with a circular economy perspective. According to the “solid waste hierarchy” as a function of FL and FW reduction and/or management, FL and FW prevention activities are preferable to landfilling [2] in order to potentially have a greater improvement in environmental and socio-economic results [3].
Despite the available evidence, there is still a lack of knowledge about this problem, with few aware of the extent of waste and its effects on the environment. According to the Food Waste Index Report 2021 [4], food waste generated in 2019 by households, retailers and the food service sector amounted to 931 million tons, with not-insignificant impacts on climate change; the majority of this waste occurred in homes (61%) followed by food service (26%) and retail (13%). In Europe, with 88 million tons of food wasted every year (equal to 173 kilos a head), it is estimated that 15% of the total environmental impact of the food production chain can be attributed to food waste.
The Food Waste Index Report 2021 [4] aims to support the objectives of Sustainable Development Goal (SDG) 12.3 through the latest collection of data, analysis, and modeling on food waste. Through this collection, it was possible to re-estimate global food waste and devise a methodology for countries to measure food waste at the household, food service, and retail levels in order to monitor national progress until 2030. SDG 12.3 has two components, Loss and Waste, which should be measured by two separate indicators. Two indices have therefore been proposed for these components: a Food Waste Index (FWI) and a Food Loss Index (FLI).
Specifically, based on the Food Loss and Waste Accounting and Reporting Standard (FLW Standard), the UN Environment Programme is working on developing the Food Waste Index. The FWI gauges the tons of food wasted per capita by analyzing a mixed set of products from the processing stage to consumption [4]. The Food Loss Index (FLI), on the other hand, examines food losses from production up to (and not including) the retail level. It measures the percentage change in losses for a basket of 10 major products per country compared to a base period. This could help to understand possible impacts and improvements of policies and investments implemented to make the supply chain more efficient. In order for countries to improve the efficiency and operation of their food supply system, it is strongly recommended that data be collected at all stages of the supply chain, thus taking into account harvest, post-production, storage, transport, primary processing, and wholesale [5].
The International Food Policy Research Institute (IFPRI) has developed a methodology to monitor food losses that occur throughout the food supply chain, taking into account all stakeholder categories. This approach is both a quantitative measure of food losses, but also a qualitative one taking into account product deterioration leading to economic losses.
This methodology deals primarily with monitoring both food and economic losses in a wide range of products in developing countries, identifying, in particular, the crucial points and production processes where most losses occur [6].
2. Waste Management as a Solution to Waste in the Food System
Global food security is becoming an increasingly serious problem and it is now clear that food waste is one of the key issues because of the significant negative environmental, social, and economic impacts it causes, so it is also the key to a more sustainable resolution of the global waste challenge. Resource and waste management can be considered sustainable if it takes into account all the stages in which waste can be generated, so it must cover the entire production cycle up to consumption. In view also of the major climate crisis we are facing, it would make sense to use resources efficiently by using them at more sustainable levels, which would allow greenhouse gas (GHG) emissions to be significantly reduced, as well as achieve economic and social benefits. Among the change strategies, the waste hierarchy, based on the principle of the 3 Rs (reduce, reuse, and recycle), helps to rank waste management options from the perspective of environmental protection, where waste prevention is considered the best and disposal the worst. The scope of the waste hierarchy is to identify the options that have the greatest probability of providing the best overall environmental result [7].
The EU’s waste management policy must aim at the prevention of waste. The basis of a recycling society is to make more efficient use of resources so as to reduce their environmental impact and limit waste generation [8]. There are various types of decision-making processes in solid waste management; among them, the most widely used are Life Cycle Assessment (LCA), Cost-Benefit Analysis (CBA), Multi-Criteria Decision-Making (MCDM), and the energy-water-food nexus towards a greener future by enhancing CE. Kyriakopoulos et al. [9] write: “The LCA only considers potential environmental aspects when evaluating waste management systems and ignores other decision-making options such as economic and social effects. Instead, CBA is a monetary valuation method, the main goal of which is to maximise economic efficiency. CBA analyses costs and benefits, including economic aspects, natural resources, and environmental impacts due to waste minimisation—which can be especially introduced in emerging countries where open dumping and open burning are the main waste treatments implemented”. This means that CE indicators can be defined and calculated with the aim of reintroducing urban solid waste from urban areas into the CE context. Once the collected data on waste generated have been standardized, it is possible to outline and define what the environmental situation of the analyzed urban areas actually is, promoting easier management of environmental policies and the carrying out of regular comparative analyses on waste generation [8].
Therefore, in Table 1, the main indicators for waste management are summarized. The scope, developer, and implementation level are provided for each one, with critical factors and functionalities, where found.
Table 1. Waste management indicators under analysis.
| Indicators | Scope | Bibliographic Reference |
|---|---|---|
| Global Waste Index (Waste Generation Index) | Provides a quantitative evaluation of the rate of waste production per country. | Nichols and Smith (2019) [10] Sensoneo Global Waste Index (2019) [11] |
| Recycling Index | Evaluates the willingness and ability of countries to manage solid waste and promote circular material flows. | Nichols and Smith (2019) [10] |
| Zero Waste index | Assesses the performance of waste management and the replacement of materials with waste management systems in various cities. | Zaman and Lehmann (2013) [12] |
| Waste recycling | Shows Europe’s progress rate towards the objective of recycling more waste. | EEA (2019) [13] |
| Contribution of recycled materials to raw materials demand | Used to monitor progress towards a circular economy in the thematic area of secondary raw materials. | Eurostat (2020) [14] |
| Trade in recyclable raw materials | Shows the quantities (in units of mass) and the monetary value (in euros) of selected waste sent across internal borders and outside the EU. | Eurostat (2020) [15] |
In 2019, the Waste Generation Index and Recycling Index were added to the Verisk Maplecroft Environment Dataset. This dataset consists of approximately 50 indices involved in areas related to climate change, environment, and natural hazards. In particular, the Waste Generation Index (WGI) through the quantitative assessment of certain waste categories, including municipal solid waste (MSW), hazardous waste, food waste, and plastic waste, is able to determine how much waste is generated per country. As well as better understanding the exposure to risk, companies could use this index to prevent and control possible risks associated with the waste generation or address problems with specific types of waste crucial to their business. The Recycling Index, on the other hand, assesses a country’s interest and capacity to manage solid waste in such a way as to encourage circular flows of materials. This index “identifies countries where the inability to recover and recycle solid waste is likely to result in risks to businesses” [10].
The Zero Waste Index, proposed by the International Zero Waste Alliance in 2004, on the other hand, is an innovative tool as it predicts the number of virgin materials, energy, water, and greenhouse gas emissions that can be saved by using resources recovered from waste streams. This gives a broader picture of the effective performance in different cities of waste management and the possible substitute resources that can be obtained. This indicator was limited to urban waste management systems for six broad categories of waste: paper, plastic, metal, glass, and organic and mixed municipal solid waste [12]. Therefore, it is essential to expand the use of this zero-waste index system and to ensure that it can also analyze other waste categories. Among these waste management systems, increasing attention is being paid to the 9R framework, which represents a generic classification system based on maximizing resource and product use, with the aim of achieving a more sustainable production capacity. Taking into account the waste hierarchy system, the 9R framework (Figure 1) consists of three major circuits: “short loop”, “medium loop”, and “long loop” [16]. According to this hierarchy of waste, producing the decision to promote short and medium circuits is certainly advisable and preferable to the application of the traditional long circuit [16].
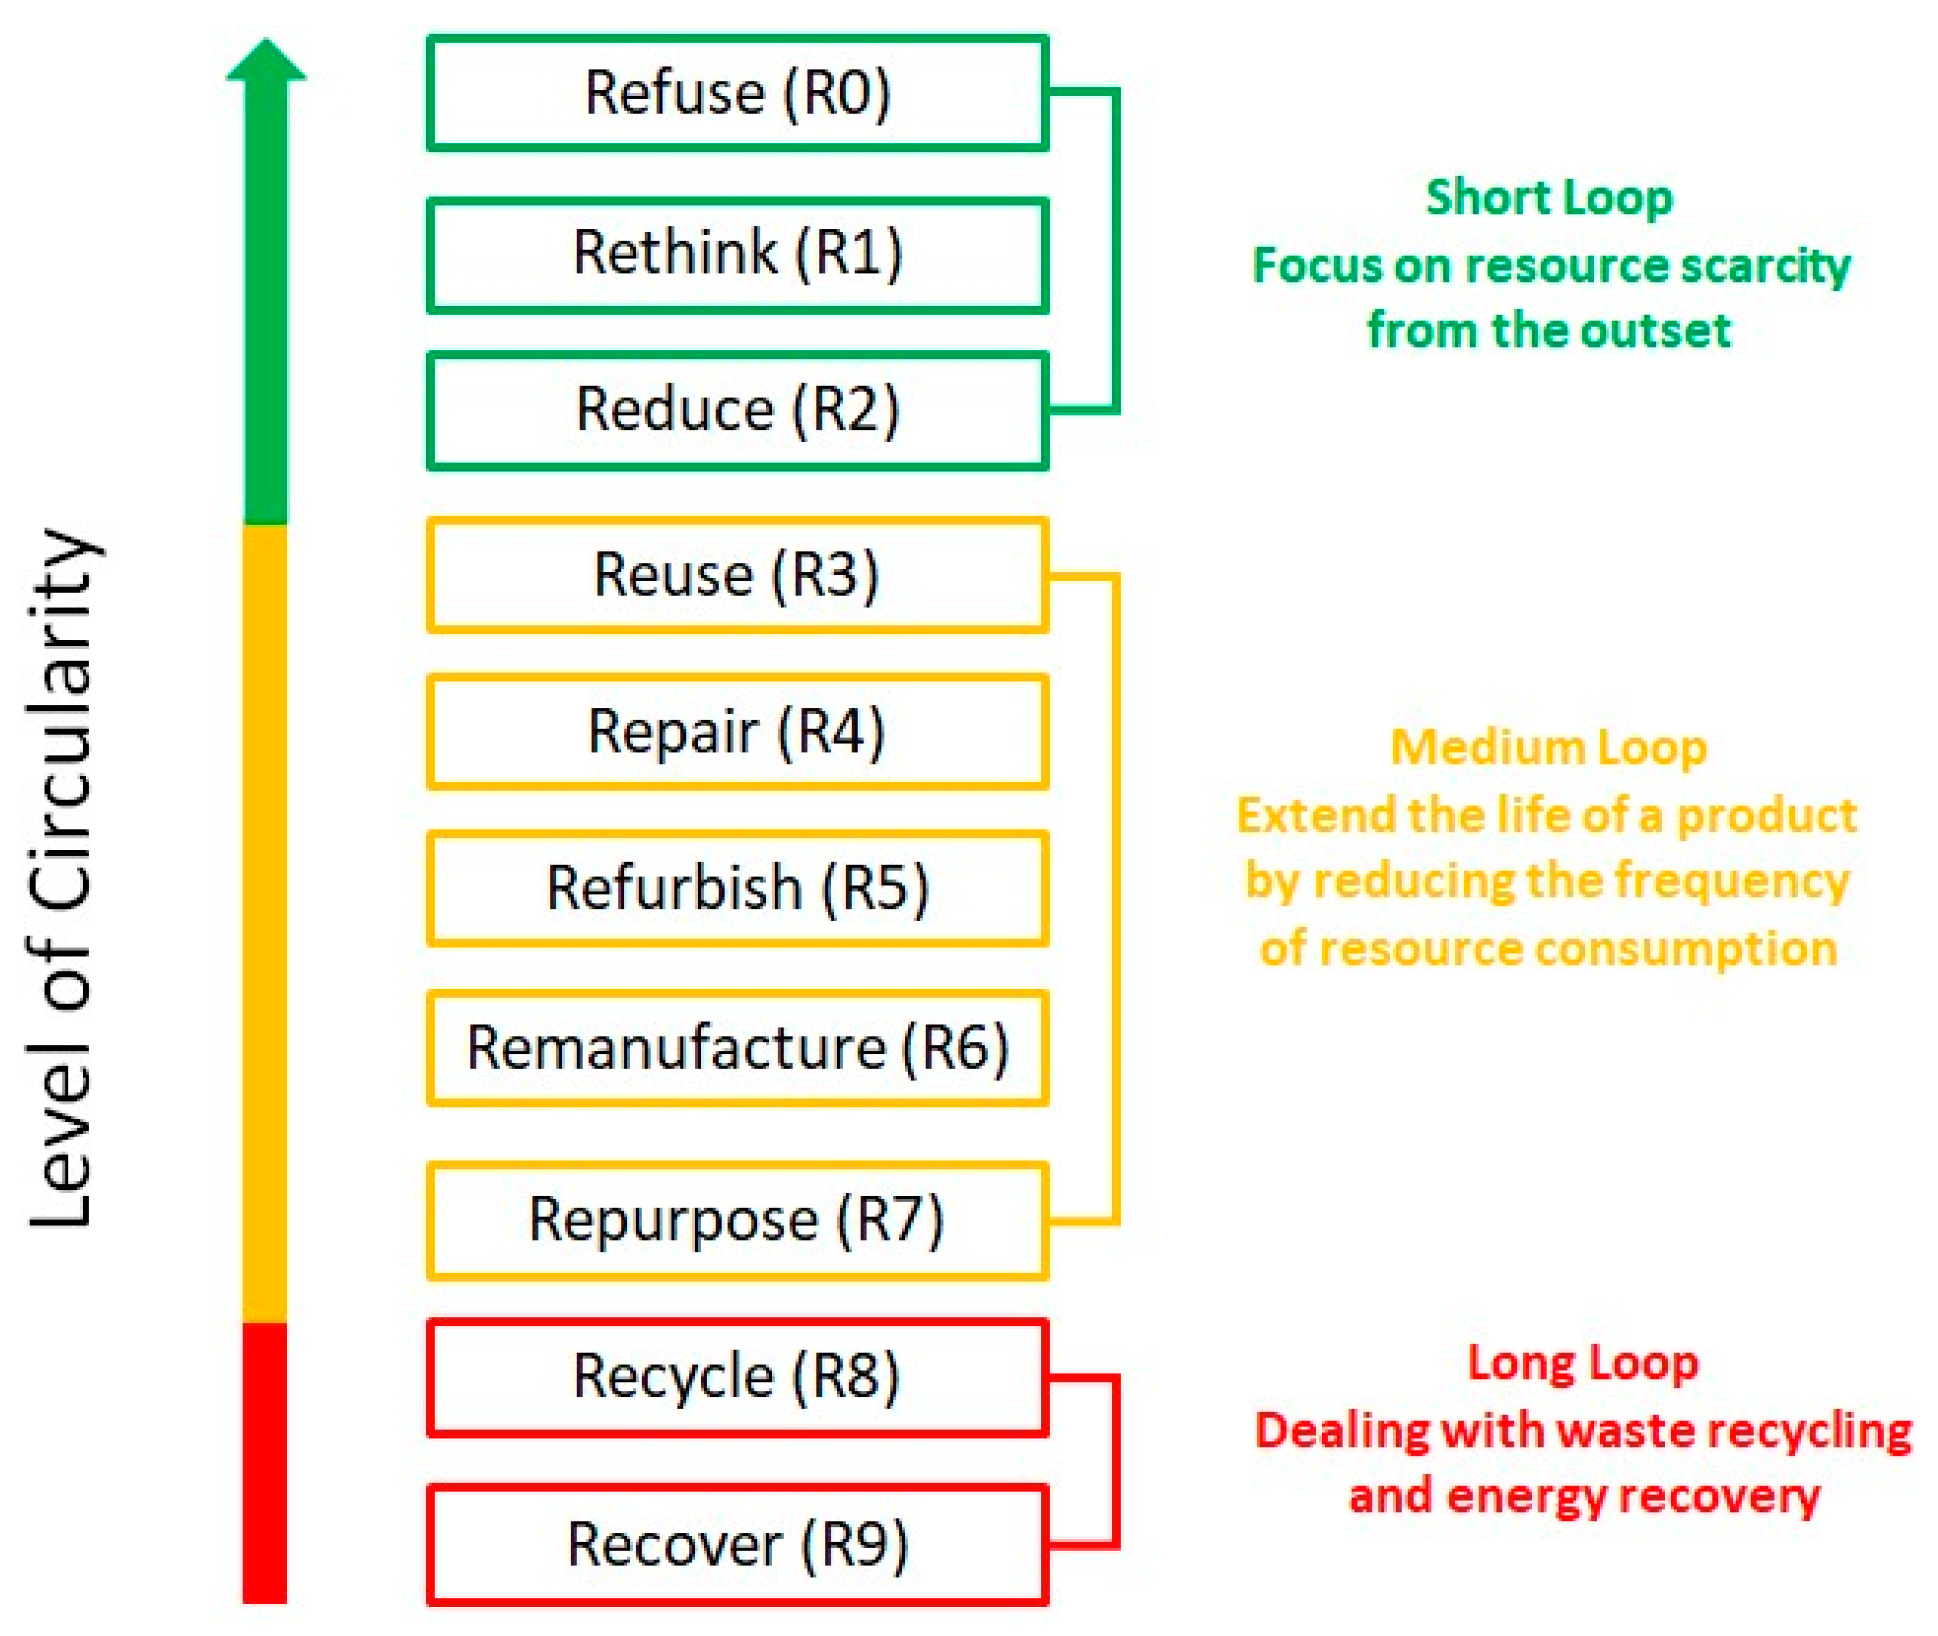
Figure 1. Application of the waste hierarchy model to the 9R framework.
Therefore, a zero-waste strategy is becoming increasingly popular as best practice. Analyzing, in particular, the European context, the Waste Recycling Index aims to monitor Europe’s progress in waste management and recycling. This indicator analyzes in particular the recycling rates for different types of waste—urban waste, packaging waste, total waste excluding major mineral waste, and waste electrical and electronic equipment (WEEE)—at the European level, to support an early-warning mechanism. As a result, it analyzes if Europe is making progress in waste management and if it is promoting circular economy actions [16]. In the working document, “Measuring progress towards circular economy in the European Union—Key indicators for a monitoring framework”, the European Commission [17] also presented two indicators that analyze these issues in particular. Unlike the other indicators that monitor collection or recycling rates in the various waste streams and present an assessment of waste management, the “Contribution of recycled materials to raw material demand” measures the contribution of recycling to material demand by material type and with reference to “secondary raw materials” takes into account any progress towards a circular economy [14]. Meanwhile, the “Trade in recyclable raw materials between EU Member States and with the rest of the world” shows the quantity (in units of mass) and monetary value (in euros) of sorted waste that is shipped across internal and external EU borders. This dataset is drawn from the International Trade in Goods Statistics (ITGS) published by Eurostat (2020) [15].
3. Decision-Making Processes Applied to the Food System
Once the main indicators that are currently able to monitor circularity inside the food system have been described, it becomes also necessary to analyze the decision-making processes most used within food systems. Decision-making processes are a set of methods that in turn incorporate other tools adapted to show information about circularity.
The following table (Table 2) identifies the selected decision-making processes. The scope, developer, and implementation level are provided for each one, with critical factors and functionalities, where found.
Table 2. Decision-making processes applicable to the food system under analysis.
| Indicators | Bibliographic Reference |
|---|---|
| Multi-Criteria Decision-Making (MCDM) | Shukor et al. (2018) [18] |
| Life Cycle Assessment (LCA) | Klöpffer (1997) [19] Sassanelli et al. (2020) [20] |
| NEXUS Thinking Approach WEFCNI |
Scott et al. (2015) [21] Rodias et al. (2021) [22] Tortorella et al. (2020) [23] Laso et al. (2018) [3] |
| Multi-Sectoral Water Circularity Assessment (MSWCA) framework | Nika et al. (2020) [24] |
| Material Flow Analysis (MFA) applied to the Italian meat industry | Amicarelli et al. (2021) [25] |
| Material Circularity Indicator (MCI) adapted to biological cycles | Rocchi et al. (2021) [26] |
| Material Circularity Indicator (MCI) adapted to biological cycles | Razza et al. (2020) [27] |
Among the first to talk about MCDM (Multi-Criteria Decision Making) was Triantaphyllou [28], defining it as a framework for supporting decisions that can evaluate multiple criteria in conflict and use a different methodology to carry out pairwise comparisons. More recently, Shukor et al. [18] applied it to their work, using a multi-level hierarchical structure that consists of objective criteria, sub-criteria, and alternatives for the selection of an appropriate technology for waste management. Such a tool can lead to better results and more complete support for decision-makers and be more valid for the interested parties. One of the more broadly used methods is the Life Cycle Assessment (LCA), which analyzes the effects the entire life cycle of a product may have on the environment (quantifying and assessing emissions, resources consumed, and health and environment pressures). This approach takes into account all the activities involved in the creation of a product, such as extraction of raw materials, production, transport, distribution, use, and disposal [29].
Today, the challenges relating to energy and resources to shift society toward more sustainable solutions are enormous and pressing. Welfare and social and economic sustainability are highly dependent on water, food, and energy. In fact, the increase in world population and the demand for ever higher standards of living only enhances the demand and consequently the need for sustainable development. It is in this context that the WEF Nexus approach fits in, which with a holistic perspective of sustainability seeks to strike a balance between the different objectives, demands, and requirements of people and the environment [22]. In particular, then, the Water–Energy–Food–Climate Nexus Integrated Index (WEFCNI) represents a new methodology to examine various waste management solutions. “Nexus Thinking” and its multi-sectoral approach promote sustainable and effective resource management, perfectly in line with the SDGs, the Paris Agreement, and the European goal of climate neutrality. The Nexus approach is, therefore, the main method capable of understanding and modeling the interactions between different resource sectors (water, food, energy) [23]. Therefore, this indicator monitors food production processes by analyzing direct and indirect water and energy consumption, examines the nutritional component, and measures GHG emissions from waste management [3]. It additionally aims to efficiently manage water, energy, and food systems, minimizing possible conflicts and improving the interaction between the systems with the aim of ensuring a safe and sustainable use of resources. The WEF Nexus today represents the most comprehensive methodology that can contribute to sustainable development.
However, when analyzing in detail only water circularity, the Multi-Sectoral Water Circularity Assessment (MSWCA) framework is very interesting. Through a multi-sectoral systemic approach, it deals mainly with Material Flow Analysis (MFA), natural systems modeling and economic assessment. Through symbiotic management of resources such as water, energy, and nutrients, it examines different socio-economic sectors (e.g., urban water, agribusiness, energy, industry, and waste management) and non-economic sectors (e.g., the natural environment). Analyzing the MFA component from a food system perspective, it is worth citing a study by Amicarelli et al. [25] which applied Material Flow Analysis (MFA) to the Italian meat industry and verified its applicability in sustainability evaluations. The MFA is able to represent a snapshot of the food chain as it allows the quantification and qualification of food waste streams, calculates the related material cycles, and takes into account eco-efficiency indicators. However, this approach encounters several limitations, the first of which is imposed by the lack of data. Additionally, various efforts are necessary to improve the robustness and reliability of the MFA.
Finally, the degree of uncertainty inherent in MFA calculations should not be underestimated. One of the main problems is the fact that it is complex to distinguish “consumed” (goods that change from one form to another, but without losing their intrinsic usefulness), “used” (goods that have already been used for their intended purposes, including those collected or discarded without being used at all), and “by-products”, which are not counted in current statistics.
Not surprisingly, current waste statistics include only those legally defined, leaving the amount of high-value waste unclear and making its measurement very complex.
For circularity measurement indices, despite the disadvantage that they concentrates only on technical cycles and in particular on non-renewable resources, covering only partially the circularity concept and excluding all the biological production with a high impact on the environment, a modification has recently been proposed to adapt it to biological cycles. The MCI modification can be considered an initial attempt to create an index dedicated to biological cycles, reflecting their main characteristics and specific features. Nevertheless, the proposed methodology applies to the individual product, meaning that “crossed circularity along the supply chain or generation of value through the cascade cycles have not been considered” [26]. Another adaptation of the MCI to biological cycles was applied by Razza et al. [27], which introduced two important modifications: “(i) the mass of the bio-based component corresponds to the recycled material in input and (ii) the mass of the bio-based component leaving the system through composting or biodegradation in soil is accounted as recycled”. The modified MCI promotes the eco-design of innovative bio-based (BB) products and the comparison of their circularity, keeping in consideration the biological source and the intended end-of-life treatment process, e.g., biodegradation. The proposed MCI is only significant if, with reference to national and European laws and standards, BB products comply with health and safety requirements for materials.
4. Experiences and Good Practices
Various experiences of measuring circularity have been developed at a European and national level. Both existing and in-development measurement models have been selected, with reference to national initiatives, certifications, and tools (Table 3). The scope, developer, and implementation level are provided for each one, with critical factors and functionalities, where found.
Table 3. Experiences and good practices under analysis.
| Experiences and Good Practices | Bibliographic Reference |
|---|---|
| Product Circularity Data Sheet (PCDS) | Product Circularity Data Sheet (PCDS) [30] |
| Cradle to Cradle | Linder et al. (2020) [31] Cradle to Cradle Certified [32] |
| REPRO | Linder et al. (2017) [33] |
| Circle Assessment | Circle Economy [34] |
| Circular Transition Indicators | WBCSD [35] |
| Circulytics | Ellen Macarthur Foundation (2019) [36] |
| Response-Inducing Sustainability Evaluation (RISE) | Häni et al. (2003) [37] |
| UNI1608856 “Measuring circularity—Methods and indicators for measuring circular processes in organisations” | UNI (2021) [38] |
| UNI1608977 “Analysis of good circular economy practices for the evaluation of their functioning and performance and to favour their replicability” | UNI (2021) [38] |
| UNI/TS 11820:2022 “Circularity measurement—Methods and indicators for measuring circular processes in organizations | UNI (2022) [39] |
Led by the Luxembourg Ministry of the Economy, the “Circularity Dataset Standardization Initiative” aims to establish an official standard, the Product Circularity Data Sheet (PCDS), for the communication of data on the circular economy properties of products, in consultation with other standards organizations. It can be used to establish how circular a product is and inform the circular process for which it was designed and realized. The PCDS offers a standardized format with reliable data [30].
Among the most-used tools is Cradle to Cradle, which carries out assessments of products and services by examining a core set of issues including the selection and reuse of materials, the use of renewable energy in the production cycle, water management and social responsibility [31]. The standard encourages constant improvement over time, assigning the certification based on growing levels of achievement and requiring the renewal of the certification [32] every two years.
Remanufacturing Product Profiles (REPRO), on the other hand, can be a useful tool to benchmark products against those that have been successfully regenerated, with the aim of improving regeneration rates [33]. According to Linder et al. [33], however: “The tool is weakly implemented, and has, with regard to circularity, low construct validity given that reuse and recycling are excluded”.
Also worth highlighting is the Circle Assessment, an online tool that supports companies in gaining an understanding of the different operational and organizational issues of the circular economy. The results of the tool evaluate companies on their present circular thinking and instruct them on potential opportunities to be further explored [34].
Another tool is represented by the Circular Transition Indicators (CTI), a simple, objective, and quantitative framework that can be applied to businesses in all sectors, of all sizes, at all positions on the value chain, and in all geographic areas [35]. It is increasingly clear that businesses must consider their social and environmental impacts, and many are embracing the circular economy as a model that tackles global challenges such as climate change, waste, pollution, and biodiversity loss.
However, a circular economy cannot be implemented until it can be adequately measured. For this reason, the Ellen MacArthur Foundation has developed a tool, Circulytics, which supports the transition of a company towards the circular economy, independently of its sector, complexity, or size [36]. In addition to evaluating products and material flows, this company-wide measurement tool can analyze the company’s level of circularity with reference to all its activities [36].
Widely used, especially in the agri-food sector, is the Response-Inducing Sustainability Evaluation (RISE), developed by the Bern University of Applied Sciences. It offers a holistic approach to advice, education, and planning. The instrument “allows the identification of strong and weak aspects of the farm and can thus induce steps to improve the sustainability (decision-oriented, response-inducing approach)” [37]. However, it is based on only 12 indicators and does not measure the interaction between the indicators themselves.
Lastly, it has been decided to include in this context three UNIs (Italian standards), currently in the experimental stage, UNI1608856 “Measuring circularity—Methods and indicators for measuring circular processes in organisations”, UNI1608977 “Analysis of good circular economy practices for the evaluation of their functioning and performance and to favour their replicability” and UNI/TS 11820:2022 “Circularity measurement—Methods and indicators for measuring circular processes in organizations”. The first, a specific technique, wants to define a set of indicators applied at the macro, meso, and micro levels aimed at assessing, through a rating system (not tied to sector benchmarks), the level of circularity of an organization or group of organizations. The second, a technical report, intends to collect an analysis of good circular economy practices from Italian organizations. The good practices will be subdivided into macro-areas of application for which the performances and impacts of the selected organizations have been analyzed [38]. Finally, the last one, which was published on 30 November 2022, is a method for measuring circularity improvement in business and industry policies. It consists of a set of 71 indicators that can measure material resources and components, energy and water resources, waste and emissions, logistics, product and service, human resources, assets, policy, and sustainability [39].
References
- Girotto, F.; Alibardi, L.; Cossu, R. Food Waste Generation and Industrial Uses: A Review. Waste Manag. 2015, 45, 32–41.
- Imbert, E. Food Waste Valorization Options: Opportunities from the Bioeconomy. Open. Agric. 2017, 2, 195–204.
- Laso, J.; Margallo, M.; García-Herrero, I.; Fullana, P.; Bala, A.; Gazulla, C.; Polettini, A.; Kahhat, R.; Vázquez-Rowe, I.; Irabien, A.; et al. Combined Application of Life Cycle Assessment and Linear Programming to Evaluate Food Waste-to-Food Strategies: Seeking for Answers in the Nexus Approach. Waste Manag. 2018, 80, 186–197.
- United Nations Environment Programme. Food Waste Index Report; United Nations Environment Programme: Nairobi, Kenya, 2021; ISBN 9789280738513.
- Fabi, C.; English, A. Methodological Proposal for Monitoring SDG Target 12.3. Sub-Indicator 12.3.1.a The Food Loss Index Design, Data Collection Methods and Challenges; FAO: Rome, Italy, 2019; p. 60.
- FAO. Technical Platform on the Measurement and Reduction of Food Loss and Waste. 2021. Available online: http://www.fao.org/platform-food-loss-waste/food-loss/food-loss-measurement/en/ (accessed on 23 March 2021).
- Papargyropoulou, E.; Lozano, R.K.; Steinberger, J.; Wright, N.; Ujang, Z. Bin The Food Waste Hierarchy as a Framework for the Management of Food Surplus and Food Waste. J. Clean. Prod. 2014, 76, 106–115.
- Salguero-Puerta, L.; Leyva-Díaz, J.C.; Cortés-García, F.J.; Molina-Moreno, V. Sustainability Indicators Concerning Waste Management for Implementation of the Circular Economy Model on the University of Lome (Togo) Campus. Int. J. Environ. Res. Public. Health 2019, 16, 2234.
- Kyriakopoulos, G.L.; Kapsalis, V.C.; Aravossis, K.G.; Zamparas, M.; Mitsikas, A. Evaluating Circular Economy under a Multi-Parametric Approach: A Technological Review. Sustainability 2019, 11, 6139.
- Nichols, W.; Smith, N.; Waste Generation and Recycling Indices. Changing the Perspective on Risk. Verisk Maplecroft 2019. Available online: http://www.maplecroft.com (accessed on 23 March 2021).
- Global-Waste-Index; Methodology-ENG: Sensoneo, Slovakia, 2019.
- Zaman, A.U.; Lehmann, S. The Zero Waste Index: A Performance Measurement Tool for Waste Management Systems in a “Zero Waste City. ” J. Clean. Prod. 2013, 50, 123–132.
- EEA 2019. Waste Recycling. Available online: https://www.eea.europa.eu/data-and-maps/indicators/waste-recycling-1/assessment-1 (accessed on 23 March 2021).
- Eurostat. 2020. Available online: https://ec.europa.eu/eurostat/cache/metadata/en/cei_srm010_esmsip2.htm (accessed on 23 March 2021).
- Eurostat. 2020. Available online: https://ec.europa.eu/eurostat/cache/metadata/en/env_wastrd_esms.htm (accessed on 23 March 2021).
- Ang, K.L.; Saw, E.T.; He, W.; Dong, X.; Ramakrishna, S. Sustainability Framework for Pharmaceutical Manufacturing (PM): A Review of Research Landscape and Implementation Barriers for Circular Economy Transition. J. Clean. Prod. 2021, 280, 124264.
- European Commission. Measuring Progress towards Circular Economy in the European Union—Key Indicators for a Monitoring Framework. Accompanying the Document Communication From the Commission To The European Parliament, the Council, the European Economic and Social Committee and the Committee of the Regions on a Monitoring Framework for the Circular Economy; Publications Office of the European Union: Strasbourg, France, 2018.
- Shukor, J.A.; Omar, M.F.; Kasim, M.M.; Jamaludin, M.H.; Naim, M.A. Assessment of Composting Technologies for Organic Waste Management. Int. J. Technol. 2018, 9, 1579–1587.
- Klöpffer, W. Life Cycle Assessment From the Beginning to the Current State. Environ. Sci. Pollut. Res. 1997, 4, 223–228.
- Sassanelli, C.; Urbinati, A.; Rosa, P.; Chiaroni, D.; Terzi, S. Addressing Circular Economy through Design for X Approaches: A Systematic Literature Review. Comput. Ind. 2020, 120, 103245.
- Scott, C.A.; Kurian, M.; Wescoat, J.L. The Water-Energy-Food Nexus: Enhancing Adaptive Capacity to Complex Global Challenges. In Governing the Nexus: Water, Soil and Waste Resources Considering Global Change; Springer International Publishing: Heidelberg, Germany, 2015; pp. 15–38. ISBN 9783319057477.
- Rodias, E.; Aivazidou, E.; Achillas, C.; Aidonis, D.; Bochtis, D. Water-Energy-Nutrients Synergies in the Agrifood Sector: A Circular Economy Framework. Energies 2021, 14, 159.
- Tortorella, M.M.; Di Leo, S.; Cosmi, C.; Fortes, P.; Viccaro, M.; Cozzi, M.; Pietrapertosa, F.; Salvia, M.; Romano, S. A Methodological Integrated Approach to Analyse Climate Change Effects in Agri-Food Sector: The TIMES Water-Energy-Food Module. Int. J. Environ. Res. Public Health 2020, 17, 7703.
- Nika, C.E.; Vasilaki, V.; Expósito, A.; Katsou, E. Water Cycle and Circular Economy: Developing a Circularity Assessment Framework for Complex Water Systems. Water Res. 2020, 187, 116423.
- Amicarelli, V.; Rana, R.; Lombardi, M.; Bux, C. Material Flow Analysis and Sustainability of the Italian Meat Industry. J. Clean. Prod. 2021, 299, 126902.
- Rocchi, L.; Paolotti, L.; Cortina, C.; Fagioli, F.F.; Boggia, A. Measuring Circularity: An Application of Modified Material Circularity Indicator to Agricultural Systems. Agric. Food Econ. 2021, 9, 9.
- Razza, F.; Briani, C.; Breton, T.; Marazza, D. Metrics for Quantifying the Circularity of Bioplastics: The Case of Bio-Based and Biodegradable Mulch Films. Resour. Conserv. Recycl. 2020, 159, 104753.
- Triantaphyllou, E. Multi-Criteria Decision Making: An Operations Research Approach. In Encyclopedia of Electrical and Electronics Engineering; Webster, J.G., Ed.; John Wiley & Sons: NewYork, NY, USA, 1998; Volume 15, pp. 175–186.
- European Commission; Joint Research Centre; Institute for Environment and Sustainability. Life Cycle Indicators Framework Development of Life Cycle Based Macro-Level Monitoring Indicators for Resources, Products and Waste for the EU-27; Publications Office: Luxembourg, 2012; ISBN 9789279259371.
- PCDS, Product Circularity Data Sheet. Available online: https://pcds.lu/ (accessed on 11 May 2021).
- Linder, M.; Boyer, R.H.W.; Dahllöf, L.; Vanacore, E.; Hunka, A. Product-Level Inherent Circularity and Its Relationship to Environmental Impact. J. Clean. Prod. 2020, 260, 121096.
- Cradle To Cradle Certified. Available online: https://www.c2ccertified.org/ (accessed on 11 May 2021).
- Linder, M.; Sarasini, S.; van Loon, P. A Metric for Quantifying Product-Level Circularity. J. Ind. Ecol. 2017, 21, 545–558.
- Circle Economy. Available online: https://www.circle-economy.com/ (accessed on 11 May 2021).
- WBCSD. Available online: https://www.wbcsd.org/Programs/Circular-Economy/Metrics-Measurement/Circular-transition-indicators (accessed on 11 May 2021).
- Ellen MacArthur Foundation. 2019. Available online: https://www.ellenmacarthurfoundation.org/resources/apply/circulytics-measuring-circularity (accessed on 11 May 2021).
- Häni, F.; Braga, F.; Stämpfli, A.; Keller, T.; Fischer, M.; Porsche, H. RISE, a Tool for Holistic Sustainability Assessment at the Farm Level; International Food and Agribusiness Management Association: Corvallis, OR, USA, 2003.
- Economia Circolare: Due Progetti di Norma Nazionali ora in Inchiesta Pubblica Preliminare. 2021. Available online: https://www.uni.com/index.php?option=com_content&view=article&id=10244%3Aeconomia-circolare-due-progetti-di-norma-nazionali-ora-in-inchiesta-pubblicapreliminare&catid=171&Itemid=2612 (accessed on 9 March 2021).
- UNI 2022. Available online: https://www.certifico.com/id/18270 (accessed on 2 February 2023).
More
Information
Subjects:
Green & Sustainable Science & Technology
Contributors
MDPI registered users' name will be linked to their SciProfiles pages. To register with us, please refer to https://encyclopedia.pub/register
:
View Times:
775
Revisions:
2 times
(View History)
Update Date:
11 Jul 2023
Table of Contents


Notice
You are not a member of the advisory board for this topic. If you want to update advisory board member profile, please contact office@encyclopedia.pub.
OK
Confirm
Only members of the Encyclopedia advisory board for this topic are allowed to note entries. Would you like to become an advisory board member of the Encyclopedia?
Yes
No
${ textCharacter }/${ maxCharacter }
Submit
Cancel
Back
Comments
${ item }
|
${ item.createdUser.fullName }
${ item.createdAt }
${ item.vote }
${ item.reply }
Delete
${ reply.createdUser.fullName }
${ reply.createdAt }
${ reply.vote }
Delete
There is no reply to this comment~
${ item.replyTextCharacter }/${ item.replyMaxCharacter }
Submit
Cancel
More
No more~
There is no comment~
${ textCharacter }/${ maxCharacter }
Submit
Cancel
${ selectedItem.replyTextCharacter }/${ selectedItem.replyMaxCharacter }
Submit
Cancel
Confirm
Are you sure to Delete?
Yes
No