Your browser does not fully support modern features. Please upgrade for a smoother experience.
Submitted Successfully!
 +1 credit
Thank you for your contribution! You can also upload a video entry or images related to this topic.
For video creation, please contact our Academic Video Service.
| Version | Summary | Created by | Modification | Content Size | Created at | Operation |
|---|---|---|---|---|---|---|
| 1 | Patrick Moriarty | -- | 4138 | 2023-06-28 04:00:55 |
Video Upload Options
We provide professional Academic Video Service to translate complex research into visually appealing presentations. Would you like to try it?
Cite
If you have any further questions, please contact Encyclopedia Editorial Office.
Moriarty, P.; Honnery, D. Energy Efficiency in a Global Context. Encyclopedia. Available online: https://encyclopedia.pub/entry/46153 (accessed on 27 July 2026).
Moriarty P, Honnery D. Energy Efficiency in a Global Context. Encyclopedia. Available at: https://encyclopedia.pub/entry/46153. Accessed July 27, 2026.
Moriarty, Patrick, Damon Honnery. "Energy Efficiency in a Global Context" Encyclopedia, https://encyclopedia.pub/entry/46153 (accessed July 27, 2026).
Moriarty, P., & Honnery, D. (2023, June 28). Energy Efficiency in a Global Context. In Encyclopedia. https://encyclopedia.pub/entry/46153
Moriarty, Patrick and Damon Honnery. "Energy Efficiency in a Global Context." Encyclopedia. Web. 28 June, 2023.
Copy Citation
Energy efficiency is, in principle, a simple idea: an output of human value, for example, vehicle-km traveled, divided by the needed input energy. Efficiency improvements are regarded as an important means of mitigating not only climate change, but also other environmental problems. Much has been written about energy efficiency, but it is mainly concerned with means for improving efficiency, or barriers to implementing higher energy efficiency. In contrast, this entry argues that the concept of energy efficiency needs to be broadened, both conceptually to include ethical considerations, and spatially, to include distant as well as local impacts.
buildings energy efficiency
climate change
energy efficiency
feedback effects
passive solar energy
renewable energy
transport energy efficiency
urban heat island
1. Introduction
Humans have always used energy. Initially, it was used to process food, which is needed by all heterotrophs. Fire was discovered and utilized by humans hundreds of millennia ago, and much later, renewable energy sources such as wind and water power were employed. Fossil fuels were even used in small amounts many centuries ago, with peat being the most important one [1]. The concept of energy efficiency and its measurement, however, had to wait until scientific progress had been made in understanding the equivalence of heat and energy and we had developed an accurate means of measuring the calorific value of the various fuels.
Today, energy efficiency is widely regarded as an important means of reducing energy use and, consequently, carbon emissions. Most countries have implemented at least some policies intended to improve energy efficiency, such as efficiency standards for private vehicles and energy ratings for domestic appliances. Both the latest report of the Intergovernmental Panel on Climate Change (IPCC) [2] and the International Energy Agency (IEA) [3] regard energy efficiency as an important means of reducing GHGs and energy use. The European Union has made ‘energy efficiency first’ the guiding principle for energy policy in achieving the energy transition needed [4].
As a simple illustration of how energy efficiency is presently assessed, consider a coal-fired power station. The simplest efficiency measure is the annual output electricity in gigawatt-hr (GWh = 109 Wh) divided by the thermal content of the annual input of coal (in gigajoule (GJ = 109 J) into the generating plant. By converting GWH into GJ, the percentage efficiency of the plant can be calculated, which perhaps is 45%. However, this is far from the full story; two important considerations are, first, the embodied energy consisting of the needed to mine the coal, process it, and transport it to the power plant boilers, and second, the need to deal with combustion air emissions. Various oxides of sulfur and nitrogen and particulate emissions are important emissions, all of which can adversely impact the health of humans. In most modern coal plants, scrubbers are installed to remove oxides of sulfur, and particulate traps are used to remove particles. NOX emissions are being addressed, but they remain a serious health issue, with 97% of the urban population in the European Union (EU) still being exposed to levels exceeding the World Health Organization (WHO) guidelines [5]. The estimated number of global deaths from the transport sector was 385,000 in 2015 [6]. The important point here is that humans’ welfare—and thus their values—are considered in efficiency calculations. Accounting for both coal production and pollution control will lower the calculated efficiency, but not significantly.
Once welfare/ethical considerations have been introduced, the logical next step is address to the greenhouse gas (GHG) emissions from power stations. Several articles have recently discussed the dire predicament facing humanity if climate change (CC) is not urgently dealt with (e.g., [7][8][9][10][11][12][13]). Raymond et al. [14] have shown that in some parts of the world, the wet-bulb temperature can, on occasion, already exceed the limits of human heat tolerance. Together, these articles and others show that even the survival of humans, or at least human civilization as we presently knot it, is at stake. GHGs can thus be regarded as a second-level pollutant.
For a comprehensive picture of power plant efficiency, the energy costs of removing GHG emissions, mainly carbon dioxide (CO2), must be included. Various approaches have been proposed for CO2 removal, including both mechanical and biological carbon dioxide removal (CDR). CO2 can be removed directly via carbon capture and storage (CCS), which involves using amines to capture the CO2 emitted, compress it, and then burying it deep underground [15]. Direct air capture (DAC) involves capturing CO2 from the ambient air. Since its atmospheric concentration is only 0.04%, much more energy is needed for capture than the amount needed for direct capture in power plants. Nevertheless, ambient air CO2 concentrations are still far higher than the concentrations of particulates, SOx and NOx, in plant exhaust gases. They are also far higher than those of the air pollutants discussed, which have much lower concentrations in plant exhaust gases.
The other possibilities include bioenergy via carbon capture and storage (BECCS), reforestation and enhanced mineral weathering. Biological carbon capture in plants and soils is already practiced to some extent and is regarded as being cheaper than mechanical approaches are, but there are doubts both about its potential and the possibility that it could reduce the albedo in some regions [16]. One proposal, solar geoengineering (SG), would remove the need for completely eliminating GHG emissions, and the proponents claim that it would have costs that are far lower than those of CCS or even biological sequestration, but for several reasons, is not likely to be deployed on the scale needed [17].
As Chatterjee and Huang [18] and Realmonte et al. [19] have demonstrated, there is a lot of uncertainty regarding the energy and monetary costs of DAC, as it has not been tried on a large scale. Additionally, as Lane et al. [15] have stressed, the potential for underground burial, which is needed for CCS, BECCS, and DAC, is also unclear, mainly because the rate at which it can be safely sequestered is very uncertain. This uncertainty means that the energy costs for full carbon mitigation are also uncertain, and hence, so is the real value of the energy efficiency of a coal power station.
2. Energy Efficiency: General Considerations
Energy efficiency can be broadly defined as the input energy needed to produce an output of human interest, i.e., the fulfillment of a task, which could be as varied as vehicular passenger-km (p-k), or the production of a tonne of wheat at a farm. However, for efficiency to have meaning, careful consideration must not only be given to the definition of the task being fulfilled, but also to the point in the energy supply chain at which energy is measured.
Figure 1 shows a representative energy supply chain in which primary energy (fossil fuels, nuclear energy, or renewables, such as wind and solar) is transferred to the point at which a task is undertaken. System losses occur at each step in the transformation process. Losses depend on factors, including: resource type and quality; transformation technology, which is limited by theoretical and engineering considerations; operational constraints and demand; the regulation of emissions, safety and so on; the operating environment, e.g., weather. Although they are indicative, the total losses can be significant. Laitner [20] has reported that in the early 2010s, overall, the US was only 14% energy-efficient; so, 86% of the energy used was wasted, suggesting that there is a lot of scope for efficiency gains.
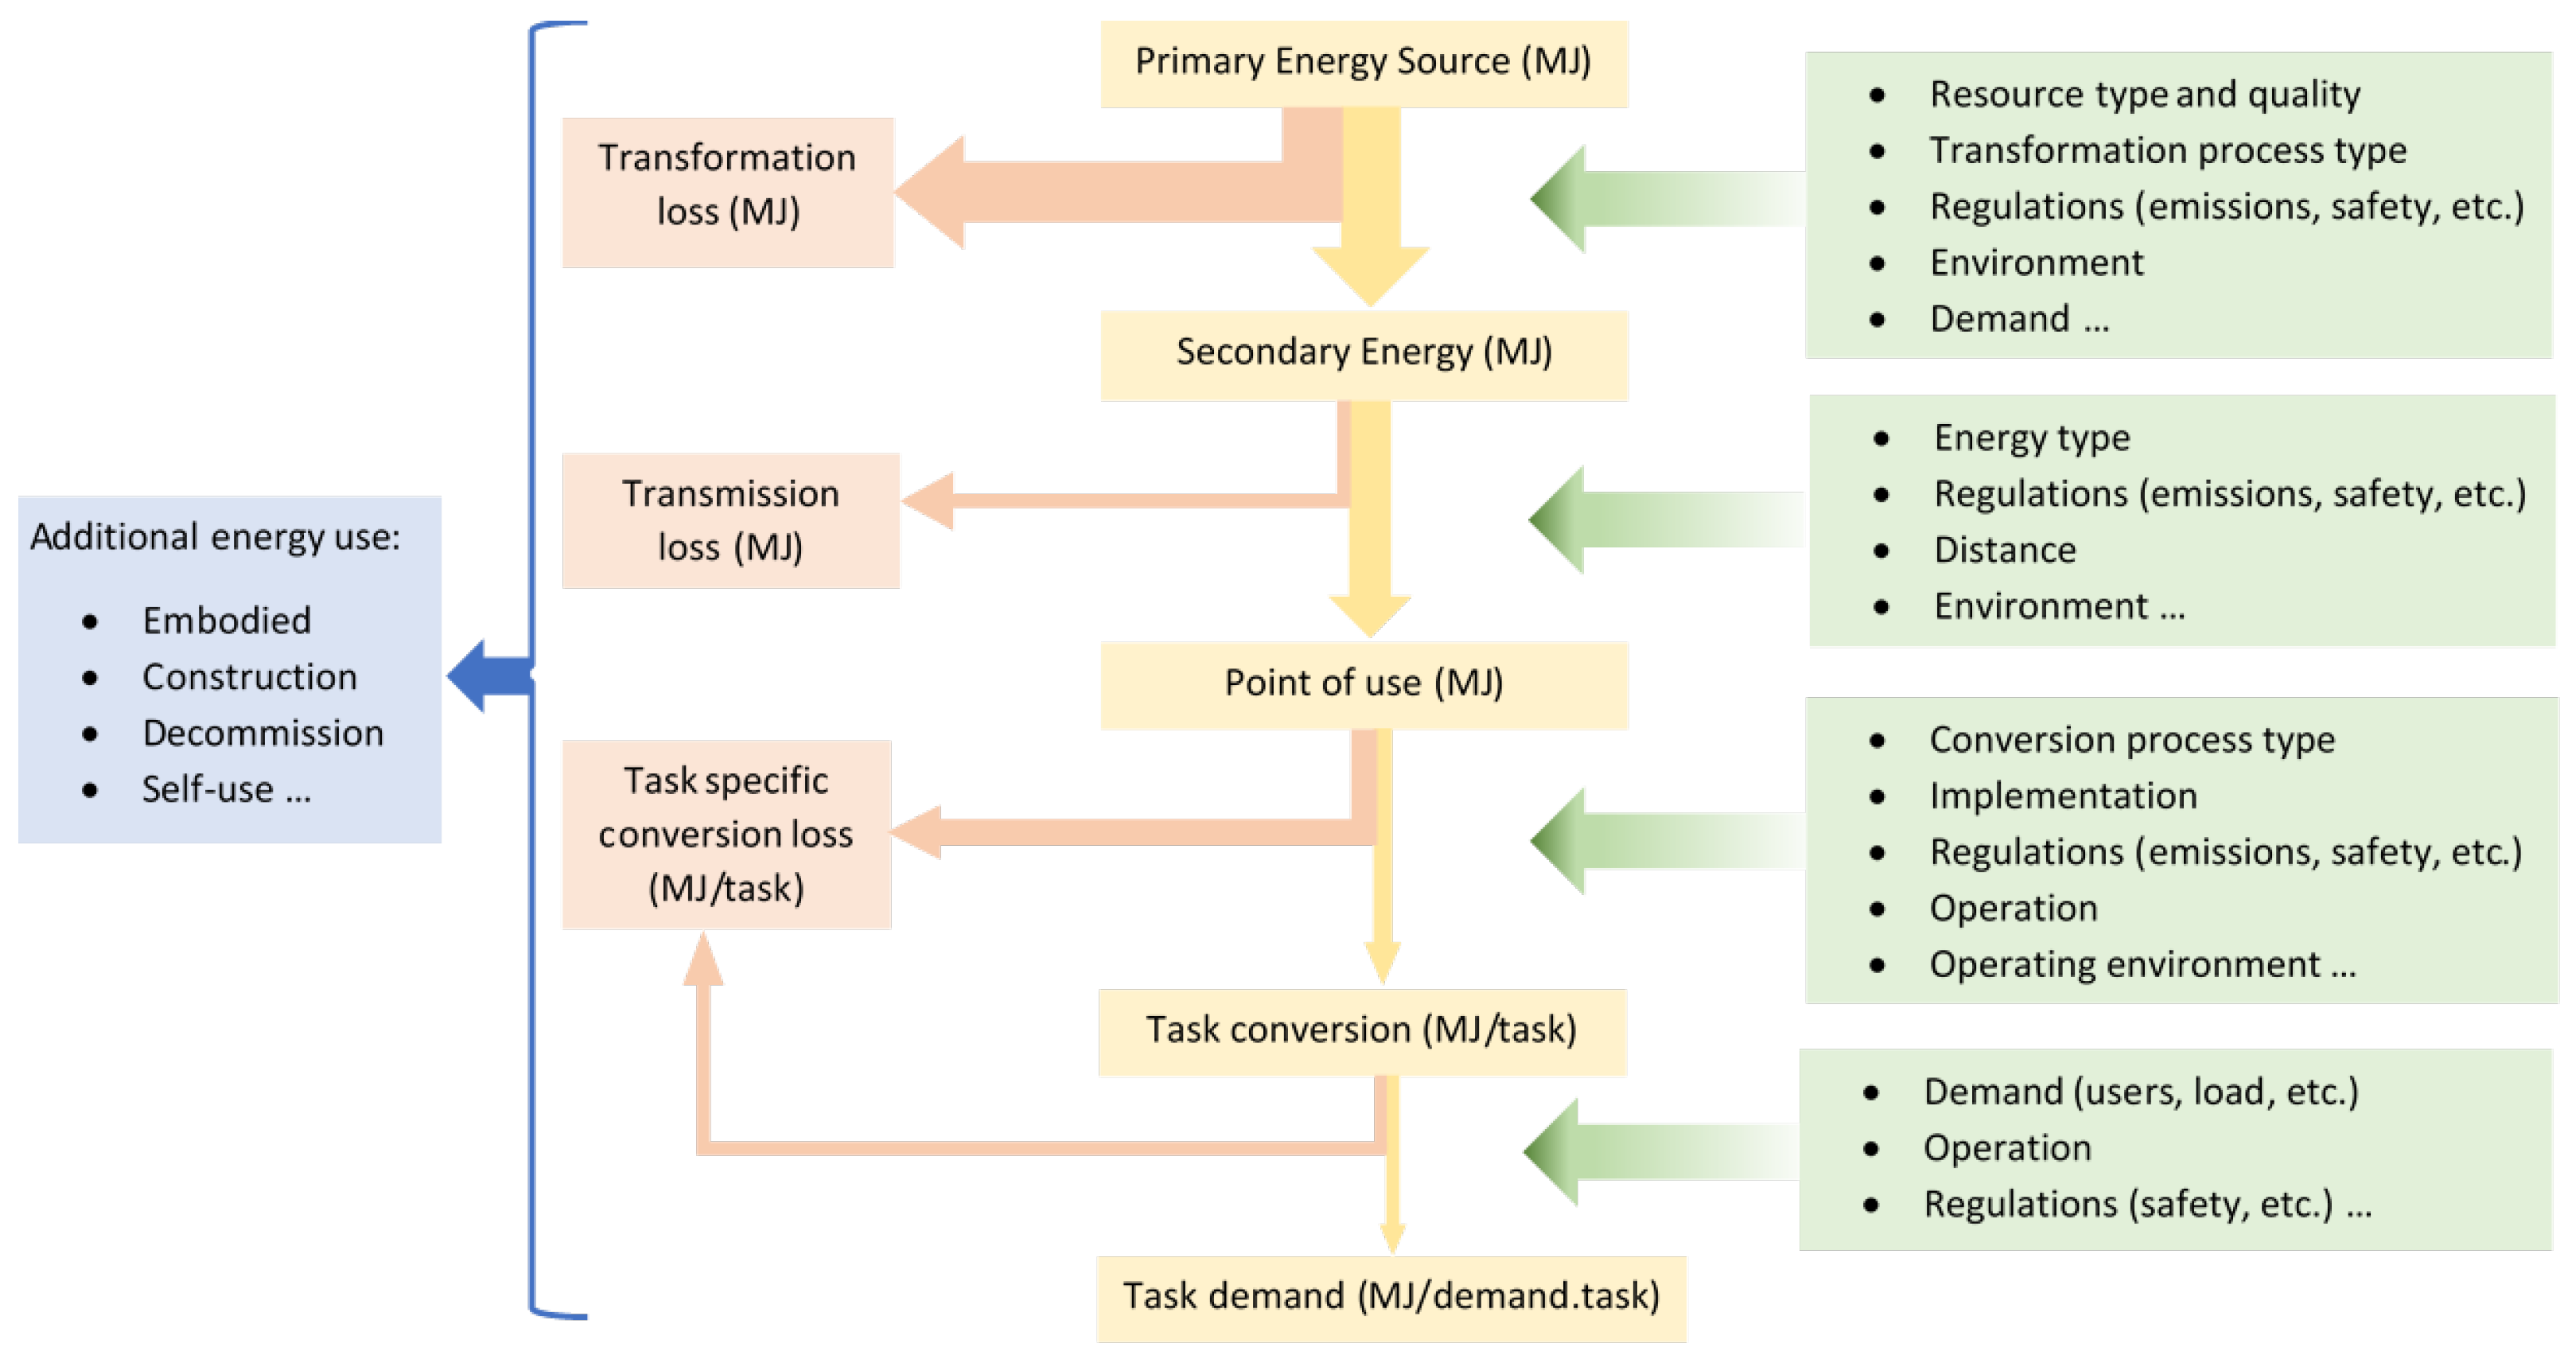
Figure 1. A generalized energy supply chain showing transformation of primary energy into the energy needed to fulfill a task, as measured by demand. Losses are shown on the left; supply chain controlling factors are shown on the right. Arrows are indicative of energy flows. Additional factors for full life-cycle analysis are shown on the far left.
A number of energy researchers regard energy efficient improvements as having the potential to produce large reductions in both energy use and CC mitigation [20][21][22]. Consider the case of electricity generation from RE sources, which because of their lower GHG emissions, will need to dominate energy supply. For these, location largely determines the resource quality (energy return relative to installed capacity), and in the case of solar power, it is modulated by the weather. The efficiency of the transformation of the primary energy source into secondary energy is technology-dependent. For solar PV, for example, cell and transformer efficiency are among the critical determinants, and a lot of effort has been put into improving these.
However, RE power systems, in general, use greater quantities of material per gigawatt (GW) of power generated [23] than FF power plants do. This is especially the case for the comparatively rare materials needed for PV cells and wind turbine generators [24]. Given the low-capacity factors for wind and PV systems, the amount of materials use per gigawatt-hr (GWh) is even higher. A recent IEA report [25] looked at global demand for various materials if the world was to have zero carbon emissions by 2050. It was found that the demand for certain key materials—including ‘lithium, copper, cobalt, nickel and the rare earth elements’—would need to rise by six-fold. Moreau et al. [26] reached similar conclusions, but also found that ‘that scarcity relates sometimes more to techno economic supply than to raw material availability’.
Many of these minerals are presently mined in low- or even middle-income countries in tropical Africa or elsewhere, where environmental legislation and its enforcement are often poor. The result is that mine wastes are at best to put in tailings dams, which are often poorly constructed and fail, or, even worse, are not contained at all. As Ali [27] reminds us, ‘There’s no free lunch in clean energy’. All energy sources, including RE, have environmental side effects.
Ensuring RE generation is not lost to curtailment will require the large-scale use of energy storage systems, such as batteries, which, such as the power plant, must be manufactured and maintained. Transmission losses to deliver energy to the point of use depend on things such as distance, voltage, and the conductor material used. Due to their size and resource quality, solar PV power plants are often located far from load centers and are, in many cases, distant from the existing electricity grid.
The complexity inherent in the energy supply chain has led to the use of different definitions of efficiency. In the case of vehicles, for example, efficiency can be reported as ‘tank (or battery) to wheels’ (MJ/km) or ‘well to wheels’ (MJ/km), which take the measurement boundary to the primary energy source. Further inclusions may account for energy (and emissions) embodied in the supply chain, giving rise to ‘full life cycle’ efficiency. If travel is the task that is to be fulfilled, differences in the way efficiency is measured enable comparisons between fuels, technology, and travel modes. While transport has been used here as an illustration, similar comments can be made regarding the use of energy to produce any output of human interest.
Importantly, the efficiency of an energy-intensive device, such as a vehicle or air conditioner, cannot be properly considered in isolation. Isolation may ignore the effect of the presence of similar devices. Congested roads are known to lower the efficiency of all road vehicles; although to some extent, drivers can have some over control vehicle efficiency via practicing ‘eco driving’ [28]. On the other hand, if fully automated vehicles (AVs) were to travel on freeways as a platoon, the air resistance level would be lower on the following vehicles, just as it is with wagons on a railway freight train.
Similarly, it can be argued that the putative gains from national energy efficiency improvements for private road vehicles and large household appliances need to be considered in a global context. The need arises for two reasons, which are illustrated here in terms of private vehicle ownership. The first one arises from the huge disparity in vehicle ownership (considering only vehicles with four wheels or more) between various countries, from over 1000 vehicles per 1000 population (which is, over one per person) in some countries to under 10 in several low-income countries, mainly in tropical Africa [29]. The second one is the signal that the emphasis on energy efficiency—and recently on EVs as a means of raising efficiency and cutting carbon emissions—sends to present and aspiring car owners in all countries. This message is that technical fixes such as energy efficiency or EVs can solve all our environmental challenges [30]; there is no need to consider alternatives, such as giving non-private road travel priority, or emphasizing access over vehicular mobility.
Yet, another way in which the system’s boundaries for energy efficiency must be widened is the existence of other global challenges apart from potential fossil fuel depletion and global CC. The initial list by Steffen and colleagues [31] included nine global limits; the crossing of even one of these would have serious consequences for Earth’s environment. Both Bradshaw et al. [7], and Dirzo et al. [8] stressed the dangers facing global biodiversity. Dryden and Duncan [32] and Georgian et al. [33] discussed those facing oceans, including acidification and the steady loss of ocean phytomass. Heinze et al. [34] warned that oceans are at risk of crossing several ocean tipping points, including ‘warming, ocean acidification, and deoxygenation’. Gross [35] discussed the growing problem resulting from widespread plastic pollution.
Just as a number of studies have looked at the energy costs of avoiding FF carbon emissions, similar assessments could be conducted on the costs of avoiding these other global environmental challenges. Moving away from FFs can ameliorate some of these problems, but it also has the potential to make them worse (see, e.g., [36][37]). Sonter et al. [36] entitled their article: ‘Renewable energy production will exacerbate mining threats to biodiversity’. They argued that the increased demand for mining minerals will increase the number of biodiversity threats. They further pointed out that mining potentially covers 50 million km2 of Earth’s surface, with much of it overlapping areas of importance for biodiversity preservation.
3. Energy Efficiency: Cities and Their Buildings
The energy efficiency of entire economies can be readily assessed in terms of its inverse energy intensity, which measures the GDP output per unit of energy for various economic sectors or for regions at various scales: at the city, country, or even world levels. Given that national energy statistics [38][39] and national GDP data from the World Bank [40] are readily available for each year, the national intensities can be compared, and also, the variation in any one country over time. For the entire world, the World Bank data indicate that energy intensity has fallen over time, indicating improved efficiency. Many high-income countries, especially in Europe, have lower energy intensities than the world average. However, this can be misleading, as these countries are often net importers of energy-intensive goods, which lowers their recorded intensity. As already discussed, a global approach is needed for accurate comparisons.
For the rest of this entry, the researchers focus on two specific sectors, rather than the overall economy. The energy efficiency of cities and their buildings (as well as energy-consuming devices within buildings), which account for nearly 40% of global energy use [41] and road passenger transport, are considered in turn. All transport accounts for nearly 26% of global final energy demand, and road transport makes up 77% of this value [42]. Importantly, domestic energy use and private transport energy are the only two energy uses that are directly under the control of households.
Overall, cities can partly make their own climate, as evidenced by the UHI effect, which can cause cities to be several °C warmer than the surrounding countryside is [43]. The UHI effect has several causes, but an important one is the heat release from all the city’s energy-consuming devices, from power plants to computer laptops. The UHI effect thus exerts an influence on the cooling needed in buildings in warmer months and the heating needs in colder ones. In warmer climates, it may make sense to counter the UHI effect, and higher summer temperatures in general, by applying a reflective surface to the roofs of buildings [44], in order to increase the overall urban albedo, i.e., the fraction of insolation, which is reflected directly back into space. The downside is that the winter heating needs may increase; so, the overall energy efficiency of roof coatings is location-dependent. Reducing the air conditioning needs in warm climates is vital; in Saudi Arabia, for example, it accounts for over two-thirds of buildings’ energy use [45].
An alternative approach to countering the UHI effect is to at least partly reverse another important UHI cause: the loss of evapotranspiration cooling resulting from paved surfaces and buildings replacing vegetated surfaces. More urban parks, even ‘urban forests’, have accordingly been promoted to improve the level of thermal comfort [46]. However, urban parks have another benefit: the increase in the wellbeing of those with ready access to them [47][48]. In summary, urban parks produce joint outputs: one that is readily quantifiable (the temperature decrease in an urban parks relative to the surrounding area), and one that is difficult to quantify the benefit of in terms of an improvement in wellbeing. How to partition any input energy costs (e.g., for watering and maintenance) is, thus, very complex.
Another example of joint outputs is provided by CHP or cogeneration projects, which were mostly located in China and in Europe. Globally, in 2016, about 16% of electricity came from CHP plants, which also provided 11 EJ of heat [49]. These systems were also common in the early days of electricity, but with the rise of very large generating units, which are often located near coal mines, they fell from favor. The emphasis shifted to maximizing the electricity output for a given fuel input, with combined cycle gas turbine plants reaching efficiencies of more than 60%. CHP plants are smaller and situated in residential areas. Some are powered by municipal waste [50], which can produce an additional benefit, as well as heat and power: they can reduce the CH4 emissions from municipal landfills.
Calculating the energy efficiency of a given device, such as an electric light or a refrigerator, via conventional means may be misleading, as these devices invariably used in the same building with a host of other energy-consuming appliances, such as office or home computers, refrigerators and freezers, and air conditioners. In cold weather, the heat released from all this equipment helps to heat the building. Conversely, in warm weather, they add to the cooling load, unless ways are found to exhaust the heat generated from energy-intensive appliances, such as washing machines and refrigerators, to outside the building in warm weather. Two papers which illustrate the complexity of efficiency calculations and the need to reconsider engineering concepts are provided in references [51][52]. The authors discuss the energy efficiency of water desalination in a Middle Eastern context, where these plants are vital for supplying to cities in these water-stressed countries.
Apartment blocks offer another illustration of the complexities of the energy efficiency measurement in buildings [53]. Apartments kept at lower temperatures during cold months will receive heat flow from adjacent apartments kept at a higher temperature. The lower-temperature occupants experience a higher level of thermal comfort because of the energy subsidy from other apartments.
Further, as Elizabeth Shove [54] has pointed out, defining energy efficiency in terms of energy use per volume (as with freezers) can justify purchasing larger units. The same reasoning applies to buildings; larger buildings are perceived as being more energy-efficient. For dwellings, a more useful index would be energy use per person, but this concept would be difficult to apply to public buildings due to their varying occupancy rates.
4. Energy Efficiency: Road Passenger Transport as a Case Study
The efficiency of ICEVs is usually measured in km per liter of fuel (or, in the US, miles per gallon). This value is based on the refined fuel, and, as noted above, is often termed the ‘tank-to-wheels’ efficiency. A more comprehensive (and relevant) measure is ‘well-to-wheels’ efficiency, which is based on primary energy. This approach enables comparison with vehicles using other fuels, such as electric propulsion for both public and private transport. Merely comparing the tank-to-wheels efficiencies of EVs and ICEVs would be misleading, since the higher efficiency of EVs in terms of this measure is offset by the much lower primary-to-secondary energy conversion efficiency for electricity compared with that of oil refining.
Importantly, the propulsion efficiency for all vehicle types has shown steady improvement. For the US, the fuel efficiency of both cars and light trucks more than doubled from 1970 to 2019 [42]. Nevertheless, there are doubts as to whether further gains in the ‘well-to-tank’ efficiency component can continue. Court and Fizaine [55] have shown how the energy return on investment (EROI) for fossil fuels (FFs) in recent decades has declined over time. This decline will continue as the reserves of economically recoverable petroleum are exhausted; further attempts by oil-importing nations to develop national lower EROI fields because of energy security concerns will also lower the well-to-tank efficiency. So far, the CO2 emissions from petroleum fuels—bio liquids appear to be no better than these [56]—have been largely ignored in efficiency calculations. For well-to-wheels efficiency, CO2 emissions can be included by calculating the energy needed to avoid these emissions, for example, via direct air capture, followed by CO2 burial deep underground.
For electricity production, the efficiency calculations are even more complicated, depending on the energy mix. For fossil fuel power stations, incorporating the energy needed to account for CO2 emissions is the same as it is above. For RE electricity, the calculations are more complex, mainly because of the energy costs of the materials needed to generate wind and PV electricity. These two primary electricity sources are not only presently the fastest-growing electricity sources, but the International Energy Agency (IEA) [42] also forecast that these sources will supply most electricity in the coming decades. As for CO2 emissions from fossil fuels, there are notional energy costs for the safe disposal of mining wastes and the remediation of the areas mined.
An important problem with energy efficiency that is usually measured is that the system boundaries are too narrow. A good illustration would be the efficiency comparison between EVs and ICEVs. For use in EVs, the efficient conversion of electricity into vehicle motion depends on the vehicle powertrain and batteries, vehicle design (e.g., shape and mass), and operation (e.g., driving pattern, air conditioner use, etc.) The lower mass-specific energy storage of batteries relative to that of liquid fuels means that EVs are generally heavier than the equivalent ICEVs are. Furthermore, all too often, only propulsion efficiency is considered. However, in colder climates, cabin heating is often needed for the occupant’s comfort. The inefficiency of ICEV engines means that engine waste heat is available, but for EVs, additional heating will be needed, perhaps from onboard propane burners [57][58]. The vehicle engine actually produces joint products in the form of two energy services: vehicle propulsion and occupants’ thermal comfort.
Driving patterns (i.e., behavior, urban, or freeway driving) can reduce or increase efficiency. Congestion reduces efficiency, particularly for ICEVs, whereas for EVs, regenerative braking can recover some losses. Vehicles’ design and use are heavily regulated. Increasing the safety requirements in response to human welfare concerns increases the vehicle complexity (leading to increased embodied energy and emissions); although, technological developments have led to efficiency gains via, for example, use of light-weight materials and enhanced power train efficiency, and for EVs, an increased battery energy density. Although emissions from the use of EVs powered by RE use are almost entirely limited to particulate emissions from tire wear and brake pads, regulations (i.e., standards or guidelines) exist in various forms at national and international levels to manage some, but not all, the pollutants emitted during their manufacture. An important source of EV pollution is safe disposal of used batteries [59][60]. As noted in the power station example discussed in Section 1, should the removal of pollutants require energy, this must be accounted for in system energy flows [61].
The demand for the task can impact efficiency; increasing the vehicle occupancy improves the task specific efficiency if it is measured in units of energy per unit passenger kilometer (MJ/p-k), while also increasing the vehicle mass-based losses (e.g., rolling resistance). Buses may have higher task specific efficiency than passenger vehicles do, but only once the critical occupancy level has been reached.
The efficiency of non-motorized transport—walking and cycling—is also a complex matter. These modes are far more energy efficient than motorized modes are on a secondary energy basis in terms of the fuels used (food vs. petrol or diesel for vehicles). Many countries, however, including some outside the OECD, are suffering from both an obesity crisis and a lack of exercise [62][63]. Given this, it is clear that the energy cost of non-motorized travel for these people (including most residents in the high-income countries) is irrelevant: the more energy we use, the better it is to burn up food calories. Similar ideas apply to ICEV cabin heating; since the energy is freely available, energy efficiency is not an issue, but it would be for EVs used in cold climates.
References
- Smil, V. World History and Energy. In Encyclpedia of Energy; Elsevier: Amsterdam, The Netherlands, 2004; pp. 549–561.
- Intergovernmental Panel on Climate Change (IPCC). Climate Change 2022: Mitigation of Climate Change. 2022. Available online: https://www.ipcc.ch/report/ar6/wg3/ (accessed on 24 April 2023).
- International Energy Agency (IEA). World Energy Outlook 2022; IEA/OECD: Paris, France, 2022; Available online: https://www.iea.org/topics/world-energy-outlook (accessed on 24 April 2023).
- Trotta, G. Assessing Energy Efficiency Improvements, Energy Dependence, and CO2 Emissions in the European Union Using a Decomposition Method. Energy Effic. 2019, 12, 1873–1890.
- Mulholland, E.; Miller, J.; Bernard, Y.; Lee, K.; Rodríguez, F. The Role of NOx Emission Reductions in Euro 7/VII Vehicle Emission Standards to Reduce Adverse Health Impacts in the EU27 through 2050. Transp. Eng. 2022, 9, 100133.
- Anenberg, S.C.; Miller, J.; Henze, D.K.; Minjares, R.; Achakulwisut, P. The Global Burden of Transportation Tailpipe Emissions on Air Pollution-Related Mortality in 2010 and 2015. Environ. Res. Lett. 2019, 14, 094012.
- Bradshaw, C.J.A.; Ehrlich, P.R.; Beattie, A.; Ceballos, G.; Crist, E.; Diamond, J.; Dirzo, R.; Ehrlich, A.H.; Harte, J.; Harte, M.E.; et al. Underestimating the Challenges of Avoiding a Ghastly Future. Front. Conserv. Sci. 2021, 1, 615419.
- Dirzo, R.; Ceballos, G.; Ehrlich, P.R. Circling the Drain: The Extinction Crisis and the Future of Humanity. Phil. Trans. R. Soc. B 2022, 377, 20210378.
- Kemp, L.; Xu, C.; Depledge, J.; Ebi, K.L.; Gibbins, G.; Kohler, T.A.; Rockström, J.; Scheffer, M.; Schellnhuber, H.J.; Steffen, W.; et al. Climate Endgame: Exploring Catastrophic Climate Change Scenarios. Proc. Natl. Acad. Sci. USA 2022, 119, e2108146119.
- Ripple, W.J.; Wolf, C.; Newsome, T.M.; Gregg, J.W.; Lenton, T.M.; Palomo, I.; Eikelboom, J.A.J.; Law, B.E.; Huq, S.; Duffy, P.B.; et al. World Scientists’ Warning of a Climate Emergency. BioScience 2021, 71, 894–898.
- Rising, J.; Tedesco, M.; Piontek, F.; Stainforth, D.A. The Missing Risks of Climate Change. Nature 2022, 610, 643–651.
- Naeem, S.; Lu, Y.; Jackson, J. Curtailing the Collapse of the Living World. Sci. Adv. 2022, 8, eadf9317.
- Steel, D.; DesRoches, C.T.; Mintz-Woo, K. Climate Change and the Threat to Civilization. Proc. Natl. Acad. Sci. USA 2022, 119, e2210525119.
- Raymond, C.; Matthews, T.; Horton, R.M. The Emergence of Heat and Humidity Too Severe for Human Tolerance. Sci. Adv. 2020, 6, eaaw1838.
- Lane, J.; Greig, C.; Garnett, A. Uncertain Storage Prospects Create a Conundrum for Carbon Capture and Storage Ambitions. Nat. Clim. Chang. 2021, 11, 925–936.
- Moriarty, P.; Honnery, D. Feasibility of a 100% Global Renewable Energy System. Energies 2020, 13, 5543.
- Moriarty, P.; Honnery, D. Renewable Energy and Energy Reductions or Solar Geoengineering for Climate Change Mitigation? Energies 2022, 15, 7315.
- Chatterjee, S.; Huang, K.-W. Unrealistic Energy and Materials Requirement for Direct Air Capture in Deep Mitigation Pathways. Nat. Commun. 2020, 11, 3287.
- Realmonte, G.; Drouet, L.; Gambhir, A.; Glynn, J.; Hawkes, A.; Köberle, A.C.; Tavoni, M. An Inter-Model Assessment of the Role of Direct Air Capture in Deep Mitigation Pathways. Nat. Commun. 2019, 10, 3277.
- Laitner, J.A. An Overview of the Energy Efficiency Potential. Environ. Innov. Soc. Transit. 2013, 9, 38–42.
- Lovins, A.B. How Big is the Energy Efficiency Resource? Environ. Res. Lett. 2018, 13, 090401.
- Thema, J.; Suerkemper, F.; Couder, J.; Mzavanadze, N.; Chatterjee, S.; Teubler, J.; Thomas, S.; Ürge-Vorsatz, D.; Hansen, M.B.; Stefan Bouzarovski, S.; et al. The Multiple Benefits of the 2030 EU Energy Efficiency Potential. Energies 2019, 12, 2798.
- Mills, M.P. Mines, Minerals, and Green Energy: A Reality Check. Manhattan Institute Report, July 2020. Available online: http://www.goinggreencanada.ca/green_energy_reality_check.pdf (accessed on 24 April 2023).
- Lawton, G. Net Zero’s Dirty Secret. New Sci. 2021, 252, 38–43.
- International Energy Agency (IEA). The Role of Critical Minerals in Clean Energy Transitions. 2022. Available online: https://iea.blob.core.windows.net/assets/ffd2a83b-8c30-4e9d-980a-52b6d9a86fdc/TheRoleofCriticalMineralsinCleanEnergyTransitions.pdf (accessed on 24 April 2023).
- Moreau, V.; Dos Reis, P.C.; Vuille, F. Enough Metals? Resource constraints to supply a Fully Renewable Energy System. Resources 2019, 8, 29.
- Ali, S.H. There’s No Free Lunch in Clean Energy. Nature 2023, 615, 563.
- Moriarty, P.; Honnery, D. Energy Efficiency: Lessons from Transport. Energy Policy 2012, 46, 1–3.
- Hedges and Company. How Many Cars Are There in the World in 2023? Available online: https://hedgescompany.com/ (accessed on 6 June 2023).
- Gunderson, R.; Stuart, D.; Petersen, B. The Fossil Fuel Industry’s Framing of Carbon Capture and Storage: Faith in Innovation, Value Instrumentalization, and Status Quo Maintenance. J. Clean. Prod. 2020, 252, 119767.
- Steffen, W.; Richardson, K.; Rockström, J.; Cornell, S.E.; Fetzer, I.; Bennett, E.M.; Biggs, R.; Carpenter, S.R.; de Vries, W.; de Wit, C.A.; et al. Planetary Boundaries: Guiding Human Development on a Changing Planet. Science 2015, 347, 1259855.
- Dryden, H.; Duncan, D. Climate Disruption Caused by a Decline in Marine Biodiversity and Pollution. Int. J. Environ. Clim. Chang. 2022, 12, 3414–3436.
- Georgian, S.; Hameed, S.; Morgan, L.; Amon, D.J.; Sumaila, U.R.; Johns, D.; Ripple, W.J. Scientists’ Warning of an Imperiled Ocean. Biol. Conserv. 2022, 272, 109595.
- Heinze, C.; Blenckner, T.; Martins, H.; Rusiecka, D.; Döscher, R.; Gehlen, M.; Gruber, N.; Holland, E.; Hov, Ø.; Joos, F.; et al. The Quiet Crossing of Ocean Tipping Points. Proc. Natl. Acad. Sci. USA 2021, 118, e2008478118.
- Gross, M. Pollution Passes Boundaries. Curr. Biol. 2022, 32, R141–R157.
- Sonter, L.J.; Dade, M.C.; Watson, J.E.M.; Valenta, R.K. Renewable Energy Production Will Exacerbate Mining Threats to Biodiversity. Nat. Commun. 2020, 11, 4174.
- Brodie, J.F.; Watson, J.E.M. Human Responses to Climate Change Will Likely Determine the Fate of Biodiversity. Proc. Natl. Acad. Sci. USA 2023, 120, e2205512120.
- BP. BP Statistical Review of World Energy 2022; BP: London, UK, 2022; Available online: https://www.bp.com/content/dam/bp/business-sites/en/global/corporate/pdfs/energy-economics/statistical-review/bp-stats-review-2022-full-report.pdf (accessed on 15 April 2023).
- International Energy Agency (IEA). Key World Energy Statistics 2021; IEA/OECD: Paris, France, 2021.
- World Bank. GDP, PPP (Constant 2017 International $); World Bank: Washington, DC, USA, 2023; Available online: https://data.worldbank.org/indicator/NY.GDP.MKTP.PP.KD (accessed on 20 March 2023).
- Vérez, D.; Borri, E.; Cabeza, L.F. Trends in Research on Energy Efficiency in Appliances and Correlations with Energy Policies. Energies 2022, 15, 3047.
- Davis, S.C.; Boundy, R.G. Transportation Energy Data Book, Edition 40. ORNL/TM-2022/2376. Available online: https://tedb.ornl.gov/wp-content/uploads/2022/03/TEDB_Ed_40.pdf (accessed on 24 April 2023).
- Kim, S.W.; Brown, R.D. Urban Heat Island (UHI) Intensity and Magnitude estimations: A Systematic Literature Review. Sci. Total Environ. 2021, 779, 146389.
- Elnabawi, M.H.; Alhumaidi, A.; Osman, B.; Alshehhi, R. Cool Roofs in Hot Climates: A Conceptual Review of Modelling Methods and Limitations. Buildings 2022, 12, 1968.
- Krarti, M.; Ybyraiymkul, D.; Ja, M.K.; Burhan, M.; Chen, Q.; Shahzad, M.W.; Ng, K.C. Energy performance of hybrid evaporative-vapor compression air conditioning systems for Saudi residential building stocks. J. Build. Eng. 2023, 69, 106344.
- Aram, F.; Solgi, E.; Higueras García, E.; Mosavi, A.; Várkonyi-Kóczy, A.R. The Cooling Effect of Large-Scale Urban Parks on Surrounding Area Thermal Comfort. Energies 2019, 12, 3904.
- Ayala-Azcárraga, C.; Diaz, D.; Zambrano, L. Characteristics of Urban Parks and Their Relation to User Well-Being. Landsc. Urban Plan. 2019, 189, 27–35.
- Small, G.; Jimenez, I.; Salzl, M.; Paliza Shrestha, P. Urban Heat Island Mitigation Due to Enhanced Evapotranspiration in an Urban Garden in Saint Paul, Minnesota, USA. WIT Trans. Ecol. Environ. 2020, 243, 39–45.
- Jin, T. The effectiveness of Combined Heat and Power (CHP) Plant for Carbon Mitigation: Evidence from 47 Countries Using CHP Plants. Sustain. Energy Technol. Assess. 2022, 50, 101809.
- Seruga, P.; Krzywonos, M.; den Boer, E.; Niedzwiecki, Ł.; Urbanowska, A.; Pawlak-Kruczek, H. Anaerobic Digestion as a Component of Circular Bioeconomy—Case Study Approach. Energies 2023, 16, 140.
- Shahzad, M.W.; Burhan, M.; Ybyraiymkul, D.; Ng, K.C. Desalination processes’ efficiency and future roadmap. Entropy 2019, 21, 84.
- Ng, K.C.; Burhan, M.; Chen, Q.; Ybyraiymkul, D.; Akhtar, F.H.; Kumja, M.; Field, R.W.; Shahzad, M.W. A thermodynamic platform for evaluating the energy efficiency of combined power generation and desalination plants. npj Clean Water 2021, 4, 25.
- Shesho, I.K.; Tashevski, D.J.; Filkoski, R.V. Heat transfer between heated, partially heated and nonheated residential units in buildings. IOP Conf. Ser. Earth Environ. Sci. 2020, 410, 012025.
- Shove, E. What is Wrong with Energy Efficiency? Build. Res. Info. 2018, 46, 779–789.
- Court, V.; Fizaine, F. Long-term Estimates of the Energy-Return-On-Investment (EROI) of Coal, Oil, and Gas Global Productions. Ecol. Econ. 2017, 138, 145–159.
- Lark, T.J.; Hendricks, N.P.; Smith, A.; Gibbs, H.K. Environmental Outcomes of the US Renewable Fuel Standard. Proc. Natl. Acad. Sci. USA 2022, 119, e2101084119.
- Liu, K.; Wang, J.; Yamamoto, T.; Morikawa, T. Exploring the Interactive Effects of Ambient Temperature and Vehicle Auxiliary Loads on Electric Vehicle Energy Consumption. Appl. Energy 2018, 227, 324–331.
- Moriarty, P. Electric Vehicles Can Have Only a Minor Role in Reducing Transport’s Energy and Environmental Challenges. AIMS Energy 2022, 10, 131–148.
- Morse, I. A Dead Battery Dilemma. Science 2021, 372, 780–783.
- Skeete, J.-P.; Wells, P.; Dong, X.; Heidrich, O.; Harper, G. Beyond the EVent Horizon: Battery Waste, Recycling, and Sustainability in the United Kingdom Electric Vehicle Transition. Energy Res. Soc. Sci. 2020, 69, 101581.
- Daaboul, J.; Moriarty, P.; Palmer, G.; Honnery, D. Making Energy Green—A Method for Quantifying the Ecosystem Maintenance Energy and the Green Energy Return on Energy Invested. J. Clean. Prod. 2022, 344, 131037.
- Couglan, A. The Workout Pill: Why Exercise is the Best Medicine. New Sci. 2012, 2879. Available online: https://www.newscientist.com/article/mg21528792-300-the-workout-pill-why-exercise-is-the-best-medicine/ (accessed on 24 April 2023).
- Pontzer, H. Step on It. New Sci. 2019, 242, 34–37.
More
Information
Subjects:
Engineering, Environmental
Contributors
MDPI registered users' name will be linked to their SciProfiles pages. To register with us, please refer to https://encyclopedia.pub/register
:
View Times:
694
Revision:
1 time
(View History)
Update Date:
28 Jun 2023
Table of Contents


Notice
You are not a member of the advisory board for this topic. If you want to update advisory board member profile, please contact office@encyclopedia.pub.
OK
Confirm
Only members of the Encyclopedia advisory board for this topic are allowed to note entries. Would you like to become an advisory board member of the Encyclopedia?
Yes
No
${ textCharacter }/${ maxCharacter }
Submit
Cancel
Back
Comments
${ item }
|
${ item.createdUser.fullName }
${ item.createdAt }
${ item.vote }
${ item.reply }
Delete
${ reply.createdUser.fullName }
${ reply.createdAt }
${ reply.vote }
Delete
There is no reply to this comment~
${ item.replyTextCharacter }/${ item.replyMaxCharacter }
Submit
Cancel
More
No more~
There is no comment~
${ textCharacter }/${ maxCharacter }
Submit
Cancel
${ selectedItem.replyTextCharacter }/${ selectedItem.replyMaxCharacter }
Submit
Cancel
Confirm
Are you sure to Delete?
Yes
No