Your browser does not fully support modern features. Please upgrade for a smoother experience.
Submitted Successfully!
 +1 credit
Thank you for your contribution! You can also upload a video entry or images related to this topic.
For video creation, please contact our Academic Video Service.
| Version | Summary | Created by | Modification | Content Size | Created at | Operation |
|---|---|---|---|---|---|---|
| 1 | Adeola Akeem Akinpelu | -- | 1532 | 2023-04-10 10:24:00 | | | |
| 2 | Conner Chen | Meta information modification | 1532 | 2023-04-12 10:28:48 | | | | |
| 3 | Conner Chen | + 9 word(s) | 1541 | 2023-04-12 10:29:53 | | |
Video Upload Options
We provide professional Academic Video Service to translate complex research into visually appealing presentations. Would you like to try it?
Cite
If you have any further questions, please contact Encyclopedia Editorial Office.
Akinpelu, A.; Alam, M.S.; Shafiullah, M.; Rahman, S.M.; Al-Ismail, F.S. Historical Greenhouse Gas Emission Trends in Saudi Arabia. Encyclopedia. Available online: https://encyclopedia.pub/entry/42898 (accessed on 28 June 2026).
Akinpelu A, Alam MS, Shafiullah M, Rahman SM, Al-Ismail FS. Historical Greenhouse Gas Emission Trends in Saudi Arabia. Encyclopedia. Available at: https://encyclopedia.pub/entry/42898. Accessed June 28, 2026.
Akinpelu, Adeola, Md Shafiul Alam, Md Shafiullah, Syed Masiur Rahman, Fahad Saleh Al-Ismail. "Historical Greenhouse Gas Emission Trends in Saudi Arabia" Encyclopedia, https://encyclopedia.pub/entry/42898 (accessed June 28, 2026).
Akinpelu, A., Alam, M.S., Shafiullah, M., Rahman, S.M., & Al-Ismail, F.S. (2023, April 10). Historical Greenhouse Gas Emission Trends in Saudi Arabia. In Encyclopedia. https://encyclopedia.pub/entry/42898
Akinpelu, Adeola, et al. "Historical Greenhouse Gas Emission Trends in Saudi Arabia." Encyclopedia. Web. 10 April, 2023.
Copy Citation
The growth of population, gross domestic product (GDP), and urbanization have led to an increase in greenhouse gas (GHG) emissions in the Kingdom of Saudi Arabia (KSA). The leading GHG-emitting sectors are electricity generation, road transportation, cement, chemicals, refinery, iron, and steel.
hydrogen
renewable energy
Saudi Arabia
1. Major Driving Forces of GHG Emission
The Kingdom of Saudi Arabia (KSA) stands at the crossroads of the Arab and Islamic worlds. Saudi Arabia is the Middle East’s largest country and has the world’s 18th-largest economy [1]. Saudi Arabia now has 0.45% of the world’s population [1]. However, Saudi Arabia’s population continues to rise due to its thriving economy and the influx of expatriates worldwide. According to the United Nations, Saudi Arabia’s population will be 35.34 million in 2021 [2]. This represents a 1.50% increase from 34.81 million in 2020, which is expected to continue to rise until 2060. Saudi Arabia’s average population growth rate is 1.59%. If the current trend continues, the population will reach 44.6 million by 2050 [3]. As seen in Figure 1, the Kingdom’s population has been on the rise for several decades. However, due to the government’s new expatriate depopulation policies, the population growth rate is expected to drop by 1.09% by 2030 and another 0.27% in the next 30 years. It is generally known that energy demand and supply increase as the population rises. Therefore, associated CO2 emissions will also rise. According to the CO2 emission data released by ‘Our World in Data’ as presented in Figure 1, it is clear that as the population increases, CO2 emission increases over the years [4][5].
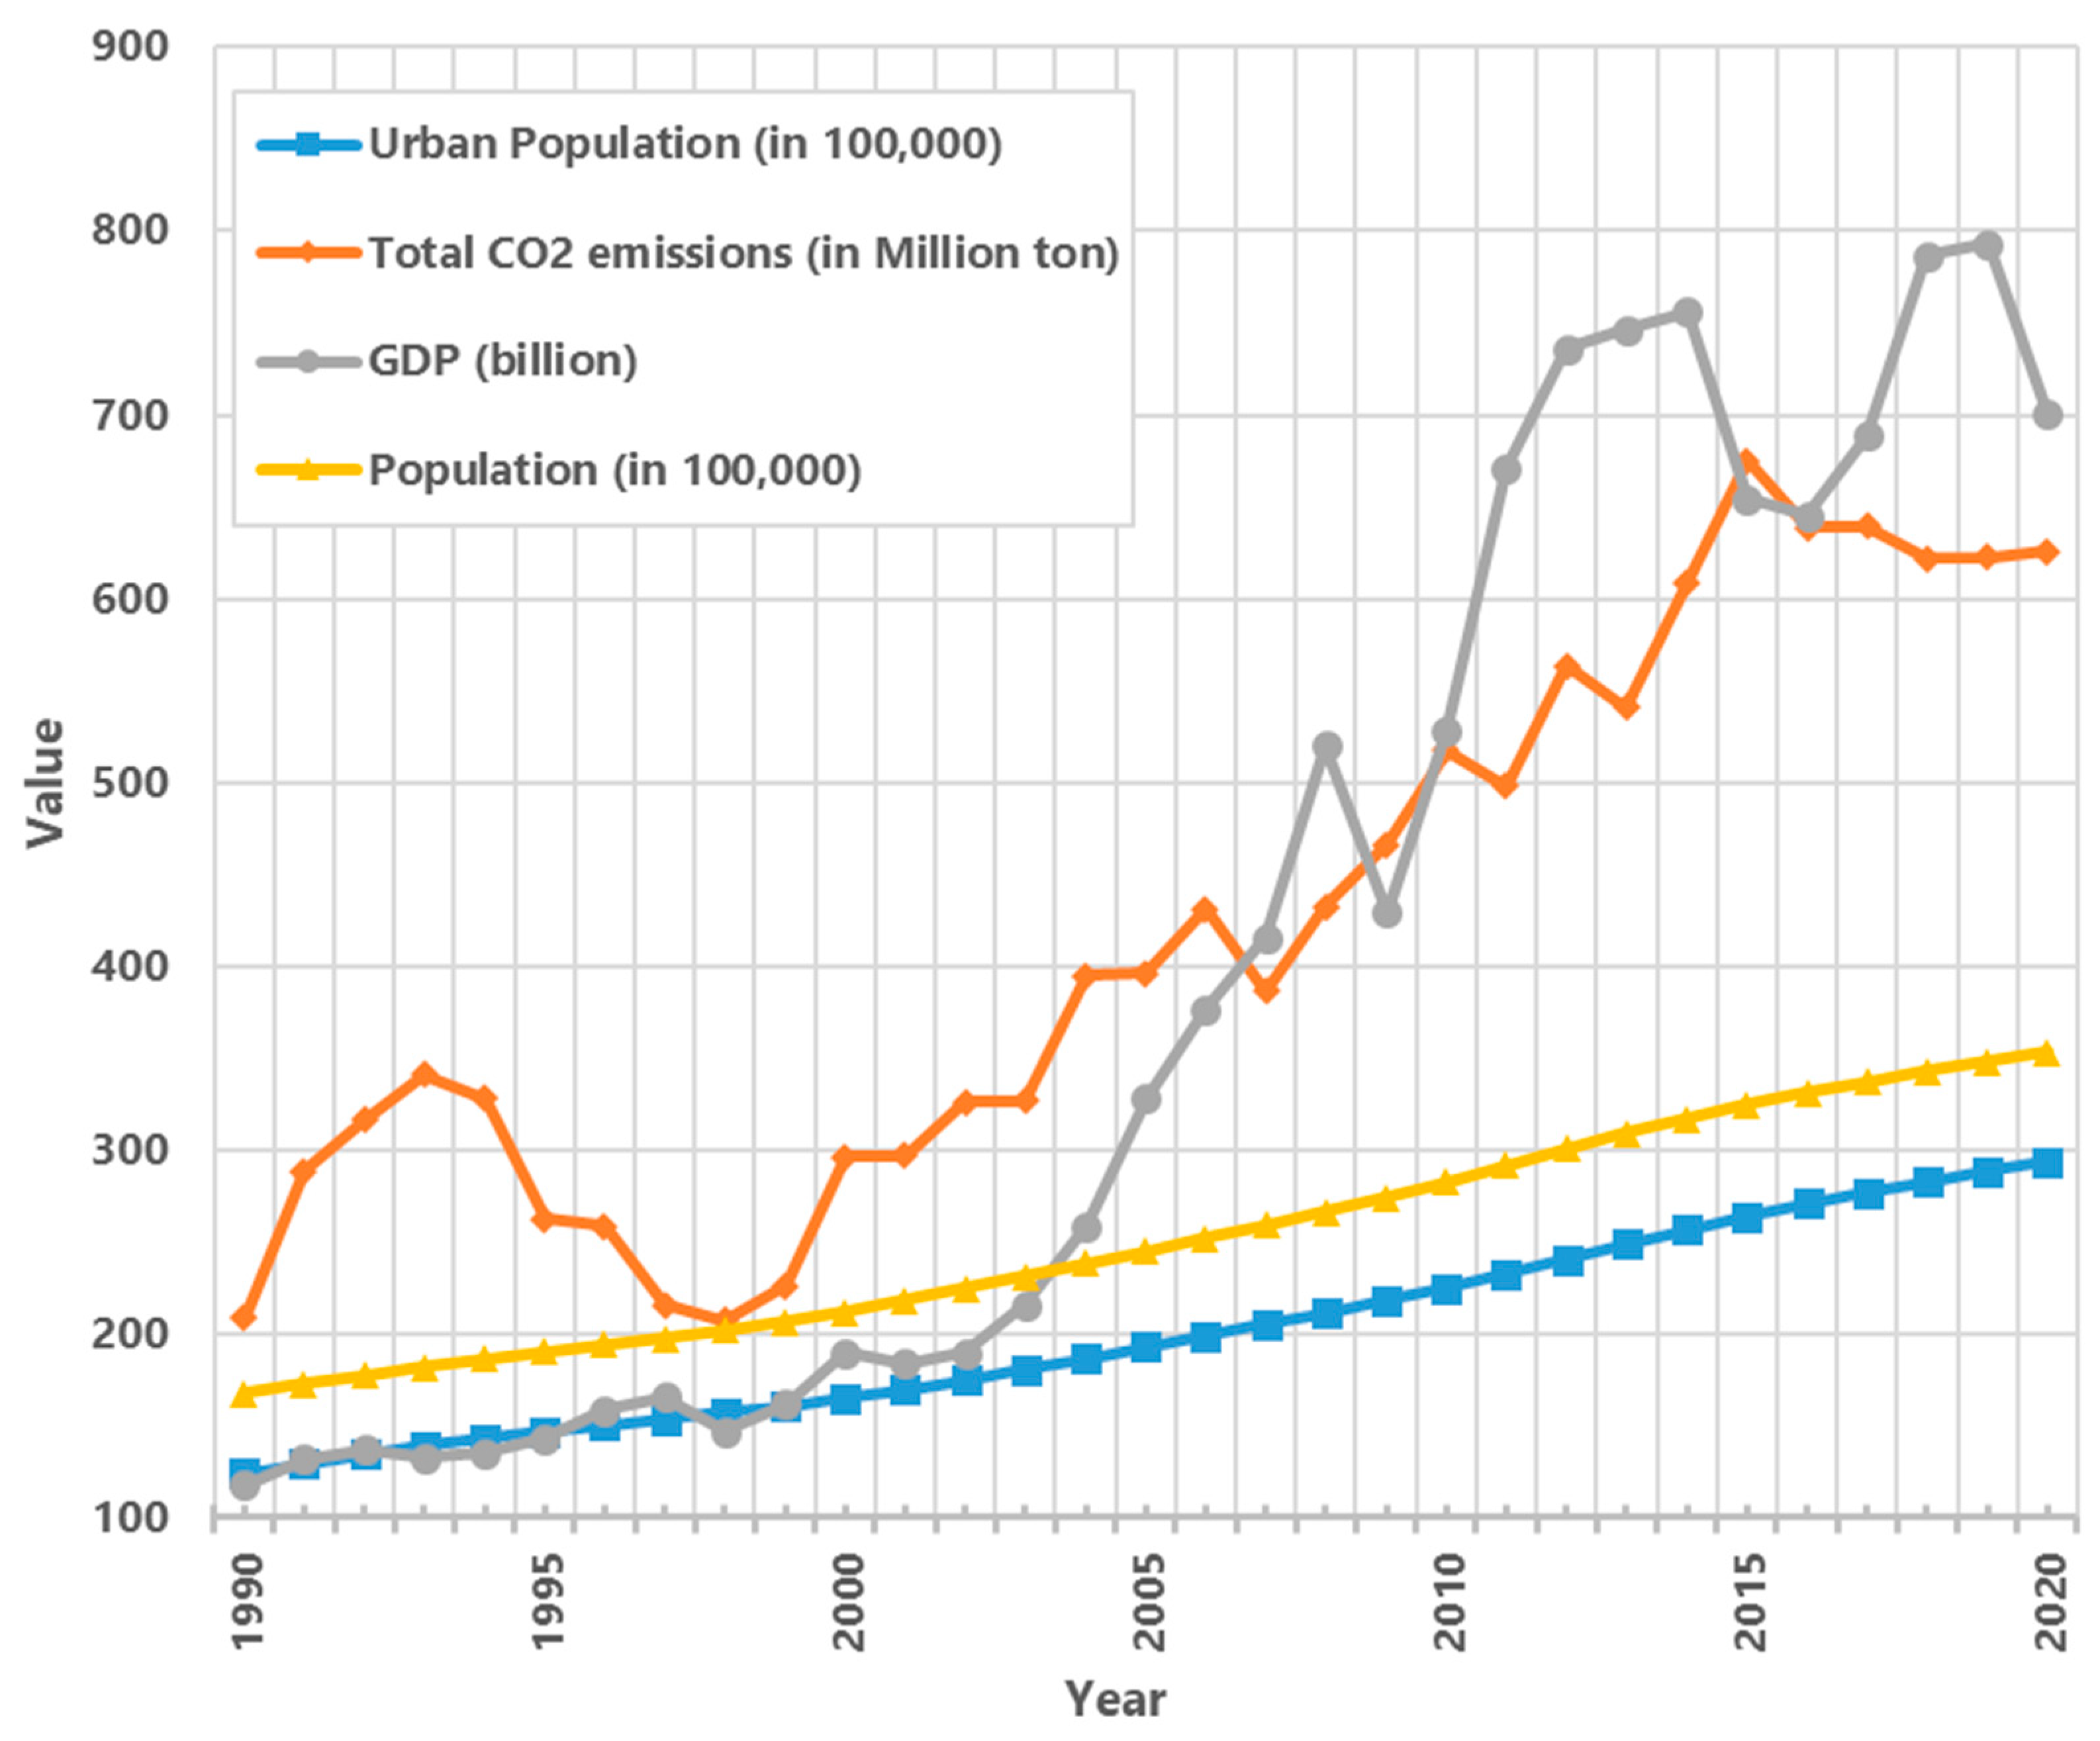
The proportion of a country’s population living in cities is called urbanization. In 2020, cities accounted for 84.29% of Saudi Arabia’s population. As a result, the Kingdom of Saudi Arabia is one of the world’s most urbanized countries, with eight out of ten inhabitants living in cities. Saudi Arabia has witnessed substantial urbanization since the 1950s. Saudi Arabia’s urban population has grown from 21% in 1950 to 58% in 1975 to 83% in 2015 and is expected to reach 86% by 2030 and 90% by 2050 [6]. Due to the rapid urban population growth, major urban settlements have sprung up to accommodate the demand for new housing, companies, industrial sectors, and transportation infrastructure. New road infrastructures are being created to handle rising urbanization and meet the travel demand. These new road infrastructures will give access and mobility to the increased traffic. As a result, the transportation sector’s use of fossil fuel-based energy increases, as does the sector’s greenhouse gas (GHG) emissions, particularly when private transportation is used by 92% of urban residents [7]. To serve the city’s people and improve the Kingdom’s economic fortunes, many utility businesses and significant GHG emissions sectorial drivers are concentrated in the cities. As a result, metropolitan areas likely account for most of the Kingdom’s GHG emissions. As shown in Figure 1, CO2 emissions follow a similar trajectory to urbanization.
Another vital component of the Kingdom’s progression is its economy. The GDP has been upward over the years. The Kingdom has been increasing its economic fortunes over the years. The Kingdom’s economic importance was globally recognized in 2008 by enlisting the country among the G20 due to its crucial importance as a pricing force in the world’s energy markets. In addition, the Kingdom has the world’s eighth sovereign wealth fund [9]. Its entry into the G20, which includes the world’s largest and fastest-growing economies, has increased its influential role as a solid industrial and financial base in the global economy. Aggressive economic activities are going on locally to achieve this global economic feat. Significant expansion of oil infrastructures has been pursued while new resources are being extensively explored. This positive economic trajectory implies that there will be more GHG emissions, except green scientific approaches are applied to the current processing infrastructures. Therefore, like the urbanization rate, the GDP has a very close positive correlation with CO2 emission.
2. Sectorial Emissions
Dissecting each sector’s contribution to the Kingdom’s CO2 emission is pertinent. The performance of different sectors such as energy, industrial processes, product use, waste, agriculture, land use change, and forestry decide the Kingdom’s CO2 emission curve pattern. One of the most powerful energy sources in the world today is fossil fuel. Saudi Arabia is the world’s largest producer and exporter of total petroleum products, and its economy is heavily dependent on oil and petroleum-related industries [10]. Similarly, Saudi Arabia’s domestic energy consumption has dramatically risen during the last three decades [11]. The rising population, rising living standards, and the population movement to the urban areas contributed to the high domestic energy consumption. As a result, energy consumption is growing, and as a result, GHG emissions are rising [12]. Therefore, according to the 2019 fourth assessment report (AR4), the total emissions of GHG were estimated at 646.42 Mt, of which the energy sector contributed 81.7%, 10.2% from the industrial process sector, 5.5% from waste, 2.1 % from agriculture, and 0.53 % from others [5].
Figure 2 shows the GHG contribution of critical sectors to the Kingdom’s total GHG emissions for the years 1990, 2000, 2010, and 2019. As can be seen, the energy sector has the highest share (more than 80% for all studies years), so it is more sensible to investigate the energy source categories. The primary source categories of the energy sector were electricity generation, road transportation, industry, and residential, which accounted for around 36.7 %, 21%, 14%, and 0.77% of total CO2 emissions, respectively, in 2019, according to International Energy Agency (IEA) [13]. The total CH4 emissions were estimated at 4.7 Mt, of which 29% were contributed by the waste sector, 68% by the energy sector, and 1.9% by the agriculture sector in 2019 [5]. The total emissions of N2O in Saudi Arabia were 60 Kt in 2019. Approximately 66.6% of the total N2O emissions were generated only by agriculture. The waste sector contributed about 7.9% of the total N2O emissions. Industrial process and product use contributed 8.6%, while energy contributed 5.3% [14]. After the energy sector, industrial processes and product use contributed 10.2% to the Kingdom’s GHG emissions in 2019. Industrial processes and product use include cement manufacturing, petrochemical manufacturing, fertilizer manufacturing, iron and steel manufacturing, and other industries. Fuel combustion is a significant source of energy for these sectors. Therefore, according to a national report released in 2016, total emissions from fuel combustion in these activities were 60,179 Gg CO2, 4.94 Gg CH4, and 0.15 Gg N2O. The major contributors to CO2 and CH4 emissions in this category were activities associated with the petrochemical, cement, and fertilizer sectors. Aside from GHG emissions from the energy source, the operation of these industries also generates GHG. In the industrial sector, cement production produced the most CO2 (52%), followed by iron and steel manufacturing (38%) and ammonia production (9%). Chemical manufacturing was this industry’s single source of 35.7 Gg of CH4 emissions. The cement sector was the leading source of N2O emissions from the manufacturing and construction industries, followed by the petrochemical and fertilizer industries [15].
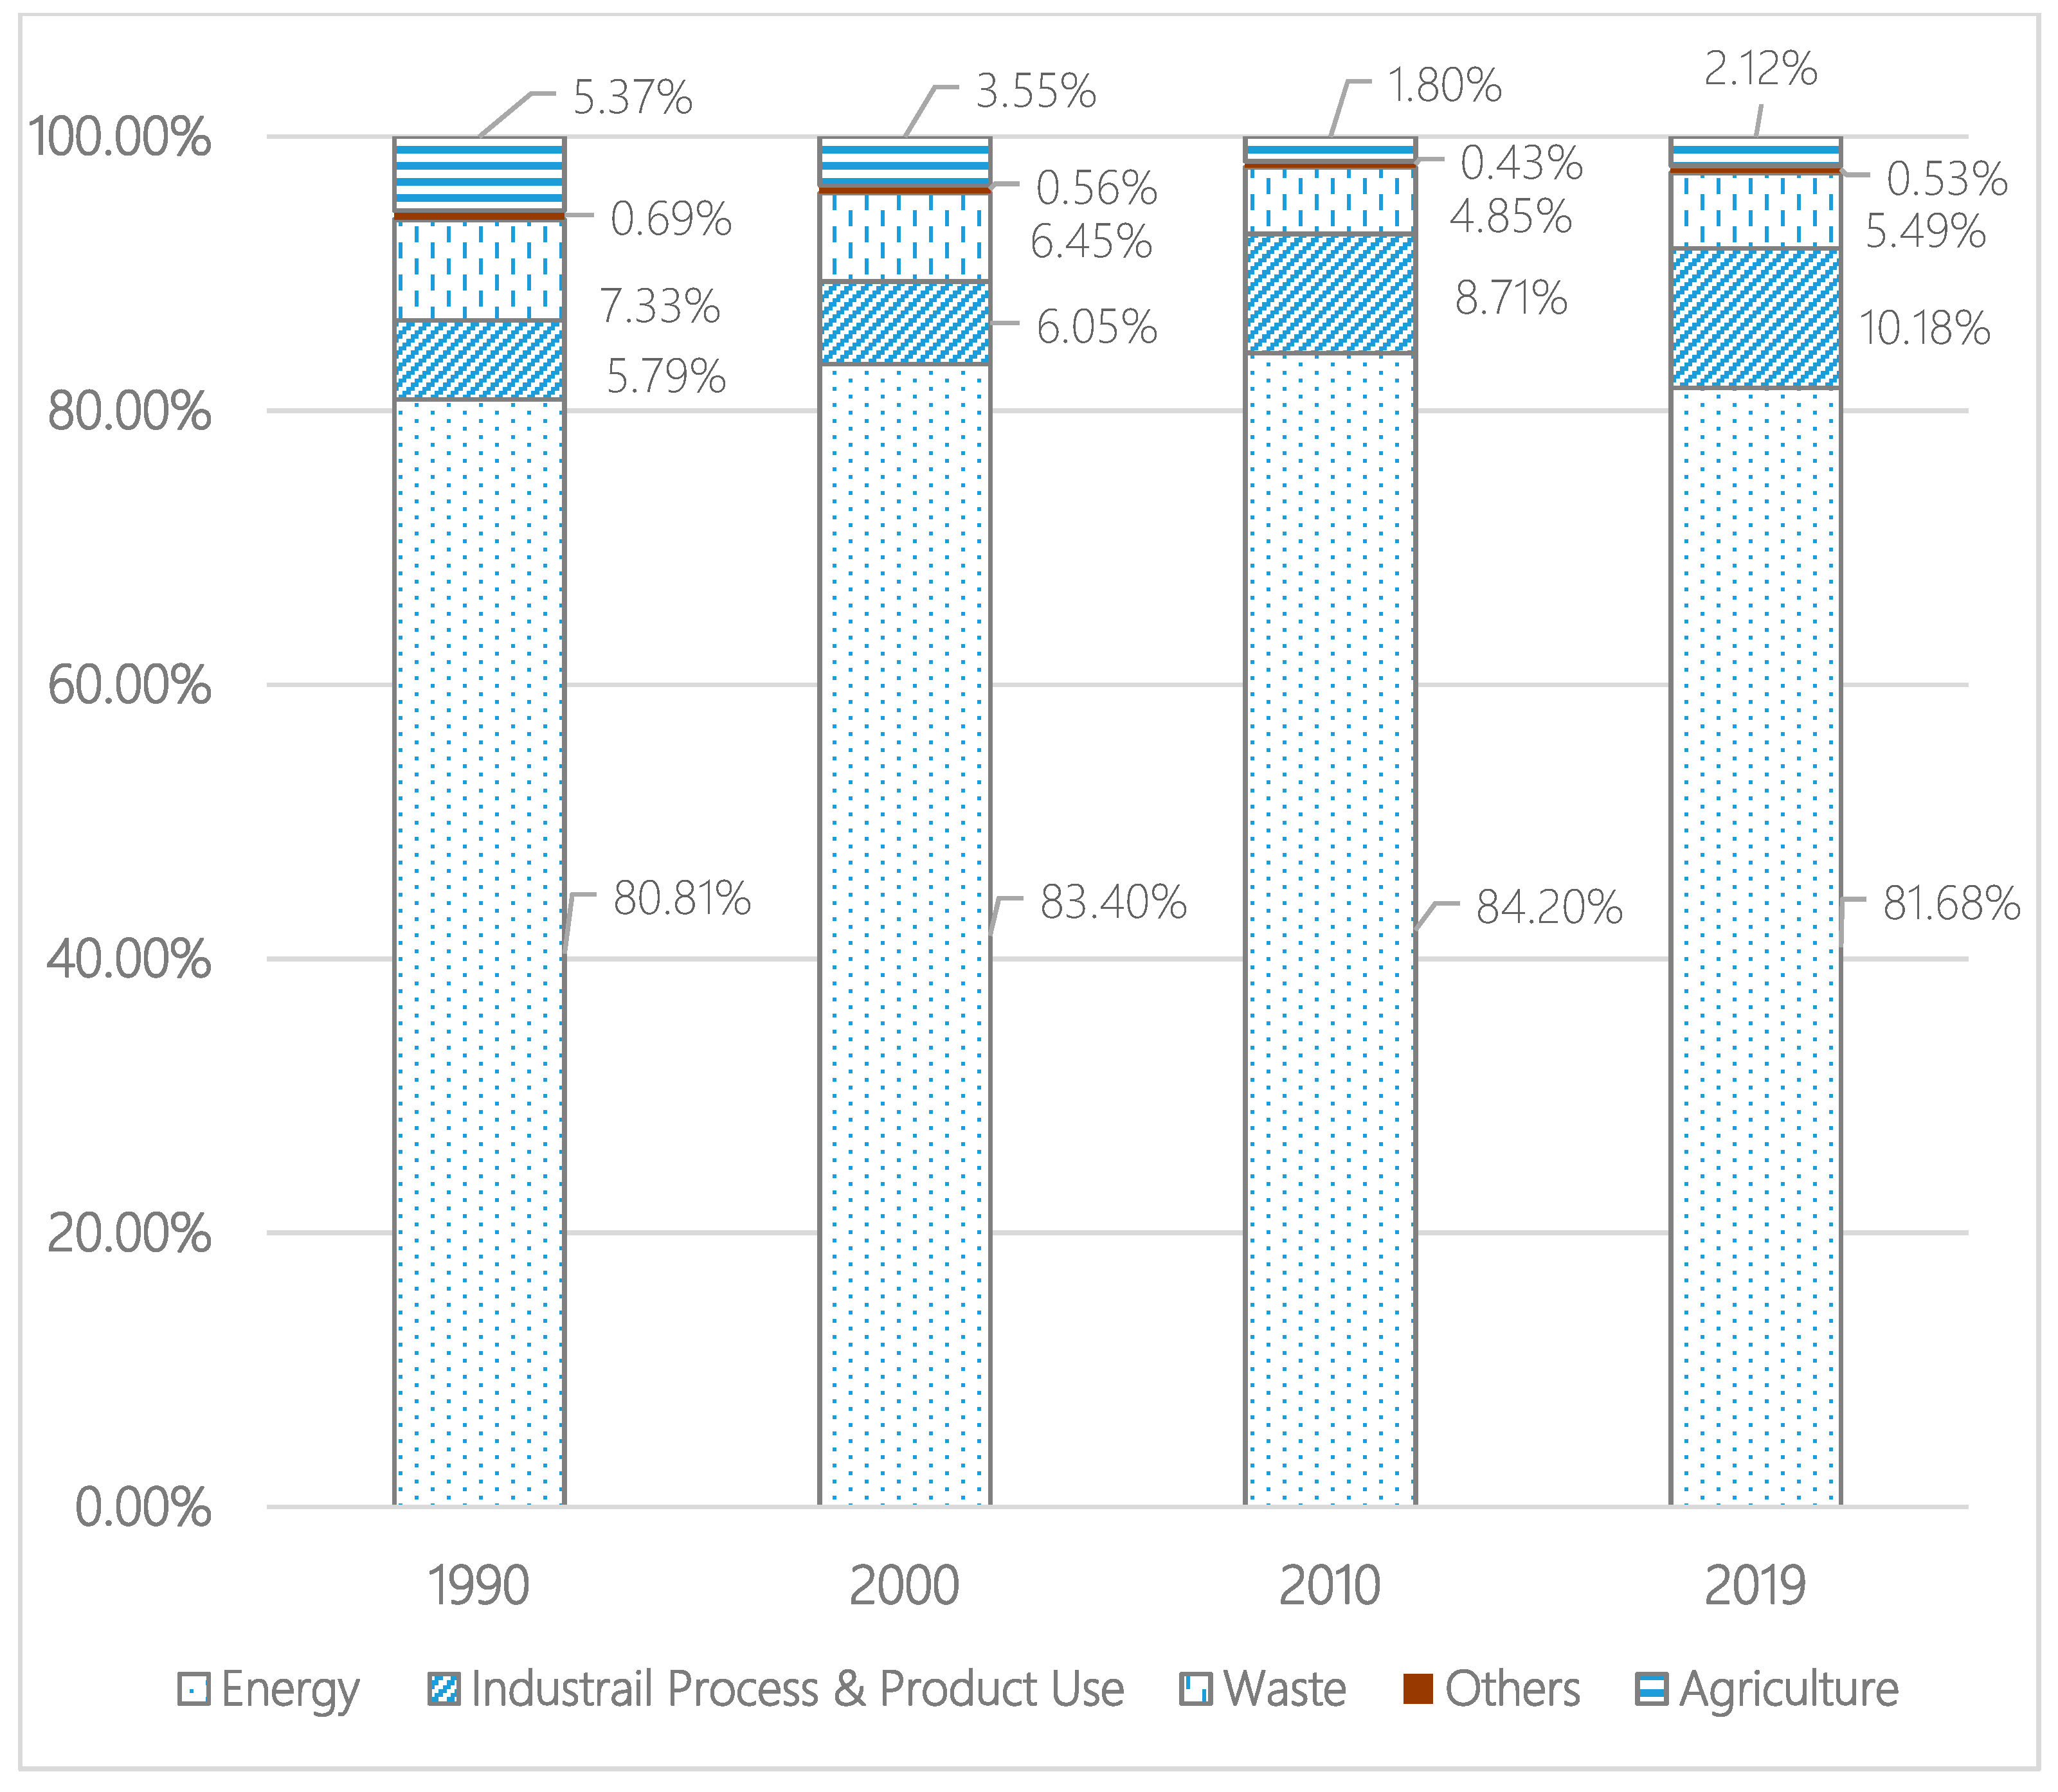
Figure 2. Saudi Arabia’s Sectorial GHG Emission (Mt) over the decades [14].
The generation of solid waste (SW) in the Kingdom of Saudi Arabia has been increasing due to population increase, urbanization, and industrial development. Hence, the accompanying greenhouse gas (GHG) emissions are also rising. The waste sector produces greenhouse gases because of industrial and municipal solid waste management and wastewater treatment facilities. Saudi Arabia’s waste sector accounted for 5.5% of the country’s total greenhouse gas emissions in 2019. Landfilling, recycling, and incineration are all options for solid waste disposal. In specific landfill regions, recyclables are separated. In Saudi Arabia, solid waste incineration is strictly controlled and prohibited on landfill grounds. As a result, landfills account for most greenhouse gas emissions from solid waste management. CH4 accounts for around half of the greenhouse gas produced in landfills. The amount of CH4 produced by solid waste management is projected to be 598 Gg, accounting for 76% of total methane produced. Municipal and industrial wastewater treatment plants additionally produce about 4.24 Gg of CH4. Methane emissions from total waste are expected to increase at an average annual rate of 5.13% between 2020 and 2050, reaching over 4000 Gg by the end of the year 2050, according to a study based on various population and GDP development scenarios [16].
Agriculture is another sector that insignificantly contributes to the Kingdom’s CO2 emission. According to 2019 GHG emission data, agriculture contributed 13.7 Mt (2.1%) of GHG to the Kingdom’s total GHG. Over the last few decades, the Kingdom’s agricultural development has seen substantial changes because of new policies to ensure food security. The government has supported this trend by transforming vast swaths of desert into farming land. This was made possible through the implementation of large-scale irrigation projects and the adoption of large-scale mechanization. Saudi Arabia’s agriculture is currently centered on the production of wheat, dates, fish, poultry, and other agricultural products, as well as the export of part of these volumes to neighboring nations and worldwide players. The government has launched many policies to maintain continuous development in the sector [15]. Under agriculture, according to the 2016 report of the 2010 GHG data inventory, field burning of agricultural leftovers was responsible for 100% of the CO2 emissions of the agriculture sector. Enteric fermentation accounted for 80% of CH4 emissions (59,270.6 tons), manure management accounted for 17.6% (13,085.6 tons), and field burning of agricultural residues accounted for 0.02% (1707.7 tons). Agricultural soils were responsible for 70% (19,772.8 tons) of agricultural N2O emissions, with manure management accounting for 30% (8590.1 tons) [15].
References
- Aljarallah, R.A. An assessment of the economic impact of natural resource rents in kingdom of Saudi Arabia. Resour. Policy 2021, 72, 102070.
- Yusuf, N.; Shesha, L.S. Economic Role of Population Density during Pandemics—A Comparative Analysis of Saudi Arabia and China. Int. J. Environ. Res. Public Health 2021, 18, 4318.
- The World Bank. Population, Total|Data; The World Bank: Washington, DC, USA, 2020.
- Friedlingstein, P.; O’sullivan, M.; Jones, M.W.; Andrew, R.M.; Hauck, J.; Olsen, A.; Peters, G.P.; Peters, W.; Pongratz, J.; Sitch, S.; et al. Global Carbon Budget 2020. Earth Syst. Sci. Data 2020, 12, 3269–3340.
- Andrew, R.M.; Peters, G.P. The Global Carbon Project’s Fossil CO2 Emissions Dataset; Zenodo: Geneva, Switzerland, 2021.
- United Nations/DESA. World Urbanization Prospects—Population Division; United Nations: New York, NY, USA, 2019.
- Ritchie, H. Sector by sector: Where do global greenhouse gas emissions come from?—Our World in Data. Our World Data. 2020. Available online: https://ourworldindata.org/ghg-emissions-by-sector (accessed on 19 March 2023).
- Friedlingstein, P.; Jones, M.W.; O’Sullivan, M.; Andrew, R.M.; Bakker, D.C.; Hauck, J.; Le, Q.C.; Peter, G.P.; Peters, W.; Pongratz, J.; et al. Global Carbon Budget 2021. Earth Syst. Sci. Data 2022, 14, 1917–2005.
- Bazoobandi, S. Old Fund, New Mandate: Saudi Arabia’s Public Investment Fund (PIF). Int. Polit. Econ. Ser. 2021, 207–231.
- Khondaker, A.N.; Rahman, S.M.; Malik, K.; Hossain, N.; Razzak, S.A.; Khan, R.A. Dynamics of energy sector and GHG emissions in Saudi Arabia. Clim. Policy 2014, 15, 517–541.
- Krane, J.; Wilson, W.S. Energy Governance in Saudi Arabia: An Assessment of the Kingdom’s Resources, Policies, and Climate Approach; Rice University’s Baker Institute for Public Policy: Houston, TX, USA, 2019.
- Rahman, S.M.; Khondaker, A.N.; Hossain, M.I.; Shafiullah, M.; Hasan, M.A. Neurogenetic modeling of energy demand in the United Arab Emirates, Saudi Arabia, and Qatar. Environ. Prog. Sustain. Energy 2017, 36, 1208–1216.
- International Energy Agency. Energy and Carbon Tracker Users Guide 2020 Edition Energy and Carbon Tracker Users Guide How to Use This Product; International Energy Agency: Paris, France, 2019.
- Gütschow, J.; Jeffery, M.L.; Gieseke, R.; Gebel, R.; Stevens, D.; Krapp, M.; Rocha, M. The PRIMAP-hist national historical emissions time series. Earth Syst. Sci. Data 2016, 8, 571–603.
- Ministry of Energy Industry and Mineral Resources. Third National Communication of the Kingdom of Saudi Arabia; Ministry of Energy Industry and Mineral Resources: Riyadh, Saudi Arabia, 2016; pp. 173–174.
- Selimuzzaman, S.M. Present and Future Solid Waste Management Practices in Saudi Arabia to combat Greenhouse Gas Emissions. In Proceedings of the 12th International Conference on Computational Science and Its Applications, Bahia, Brazil, 18–21 June 2012; pp. 1–13.
More
Information
Subjects:
Green & Sustainable Science & Technology
Contributors
MDPI registered users' name will be linked to their SciProfiles pages. To register with us, please refer to https://encyclopedia.pub/register
:
View Times:
772
Revisions:
3 times
(View History)
Update Date:
12 Apr 2023
Table of Contents


Notice
You are not a member of the advisory board for this topic. If you want to update advisory board member profile, please contact office@encyclopedia.pub.
OK
Confirm
Only members of the Encyclopedia advisory board for this topic are allowed to note entries. Would you like to become an advisory board member of the Encyclopedia?
Yes
No
${ textCharacter }/${ maxCharacter }
Submit
Cancel
Back
Comments
${ item }
|
${ item.createdUser.fullName }
${ item.createdAt }
${ item.vote }
${ item.reply }
Delete
${ reply.createdUser.fullName }
${ reply.createdAt }
${ reply.vote }
Delete
There is no reply to this comment~
${ item.replyTextCharacter }/${ item.replyMaxCharacter }
Submit
Cancel
More
No more~
There is no comment~
${ textCharacter }/${ maxCharacter }
Submit
Cancel
${ selectedItem.replyTextCharacter }/${ selectedItem.replyMaxCharacter }
Submit
Cancel
Confirm
Are you sure to Delete?
Yes
No