Your browser does not fully support modern features. Please upgrade for a smoother experience.
Submitted Successfully!
 +1 credit
Thank you for your contribution! You can also upload a video entry or images related to this topic.
For video creation, please contact our Academic Video Service.
| Version | Summary | Created by | Modification | Content Size | Created at | Operation |
|---|---|---|---|---|---|---|
| 1 | ABDALLAH YUSSUF ALI ABDELMAJEED | -- | 3491 | 2023-03-23 12:57:01 | | | |
| 2 | Dean Liu | -4 word(s) | 3487 | 2023-03-27 13:04:14 | | |
Video Upload Options
We provide professional Academic Video Service to translate complex research into visually appealing presentations. Would you like to try it?
Cite
If you have any further questions, please contact Encyclopedia Editorial Office.
Abdelmajeed, A.Y.A.; Albert-Saiz, M.; Rastogi, A.; Juszczak, R. Cloud-Based Remote Sensing for Wetland Monitoring. Encyclopedia. Available online: https://encyclopedia.pub/entry/42477 (accessed on 27 July 2026).
Abdelmajeed AYA, Albert-Saiz M, Rastogi A, Juszczak R. Cloud-Based Remote Sensing for Wetland Monitoring. Encyclopedia. Available at: https://encyclopedia.pub/entry/42477. Accessed July 27, 2026.
Abdelmajeed, Abdallah Yussuf Ali, Mar Albert-Saiz, Anshu Rastogi, Radosław Juszczak. "Cloud-Based Remote Sensing for Wetland Monitoring" Encyclopedia, https://encyclopedia.pub/entry/42477 (accessed July 27, 2026).
Abdelmajeed, A.Y.A., Albert-Saiz, M., Rastogi, A., & Juszczak, R. (2023, March 23). Cloud-Based Remote Sensing for Wetland Monitoring. In Encyclopedia. https://encyclopedia.pub/entry/42477
Abdelmajeed, Abdallah Yussuf Ali, et al. "Cloud-Based Remote Sensing for Wetland Monitoring." Encyclopedia. Web. 23 March, 2023.
Copy Citation
The rapid expansion of remote sensing provides recent and developed advances in monitoring wetlands. Integrating cloud computing with these techniques has been identified as an effective tool, especially for dealing with heterogeneous datasets.
wetland
peatland
cloud computing
remote sensing monitoring
1. Which Cloud Computing Service Model Has Been Utilized in Wetland Monitoring?
All the papers included used PaaS as a cloud computing model. PaaS is a development platform allowing researchers to develop and build RS-based applications directly on the PaaS cloud. Thus, SaaS and PaaS differ in that SaaS only hosts cloud applications that have already been developed, whereas PaaS offers a development platform that hosts both cloud applications that have already been developed and those that are still in development. PaaS must have a development infrastructure, including a programming environment, tools, configuration management, and other components, and an environment supporting application hosting to achieve this.
An example of PaaS is Google Earth Engine (GEE), which is most commonly used to implement the study and achieve the goal of CC [1][2][3][4][5][6][7][8][9]. GEE is a freely available platform with open-sourced scripting frequently used to automate the RS data for the area of interest, mainly at a big scale. It has a vast dataset for the world, mainly from satellites with a variety of spatial resolutions, from coarse (1 km, MODIS) to high (10 m, Sentinel 2), which are good enough for monitoring wetlands at different scales, from the local and regional to the continental and global scales. At a local scale, which is often the wetland level where some research infrastructure and experimental sites with small plots are located, wetlands can be monitored either by application of CC on the SaaS model (time and cost-efficient) or by the traditional methods, i.e., carrying out the ground-based measurements using the instruments in the field (time and not cost-efficient). However, using dedicated CC-based software, data from the fixed sensors in the study area can be read and analysed, and then quantitative and visualized results can be shown in real time. These time and cost-savings help researchers and professionals closely track the wetland status and minimize potential risks (e.g., fire) and maintenance costs. PaaS and RS can integrate a vast quantity of data, tools, and programs; then, by linking many wetlands with the same technology, global monitoring and tracking of the changes of those study areas will be possible and straightforward, thanks to Digital Twin, IoT, and CC.
2. How Widely Utilized Are the Different Monitoring Applications of Remote Sensing Data on Wetlands Using Cloud Computing, and What Are Their Limitations and Accuracy?
The requirements of the data needed to monitor an ecosystem depend on the purpose of its monitoring. Five types of monitoring purposes have been selected as subclasses of wetland monitoring in the articles analysed (Table 1).
Table 1. The subclasses of wetland monitoring strategies in the analysed articles.
| Monitoring Strategies | References |
|---|---|
| Prediction (1 article) | [10] |
| Time series analysis (6 articles) | [5][7][11][12][13][14] |
| Mapping (11 articles) | [8][12][15][16][17][18][19][20][21][22][23] |
| Classification (15 articles) | [1][4][24][25][26][27][28][29][30][31][32][33][34][35][36] |
| Change detection (17 articles) | [2][3][6][37][38][39][40][41][42][43][44][45][46][47][48][49][50] |
In most of the studies, satellite data is the most used; it has been used alone or in combination with other types of remote sensing data (airborne, UAV, or in situ), independent of the monitoring strategy applied (Figure 1). The satellite data’s widespread use is thanks to the open-access products of space agencies such as the European Space Agency (ESA) and the National Aeronautics and Space Administration (NASA), providing products with spatial resolutions of 10 m (Sentinel 2) or temporal coverages since 1972 (Landsat 1). These products were mostly used for the detection of changes in wetlands (34% of articles), wetland classification (30% of articles), and wetland mapping (22% of articles).
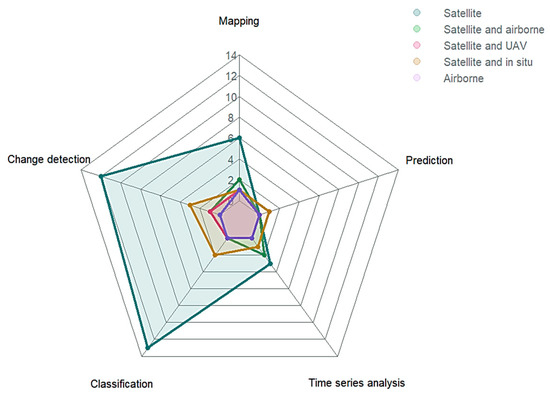
Figure 1. Distribution of the number of articles (y-axis) per monitoring strategy for each type of remote sensing data.
Only one article focused on predicting changes in wetlands, where a combination of in situ measurements and satellite data were applied to monitor plant phenology. However, weather conditions such as fog, made it impossible to use historical data to predict seasonality [10]. Additionally, climate change, with the variation in weather and seasonality, makes it more difficult to use historical data to predict future plant phenology as the future climate is unknown and unpredictable in the long term. Thus, approximately 12% of the articles primarily analysed time series data derived from satellite products. Three of them indicated problems with the number of images available [13], their spatial resolution [7], or the high level of moisture affecting vegetation index performance [14], but the average accuracy surpassed 90%. The accuracy refers from this point to the values provided by the authors in each publication, where accuracy is calculated from the percentage of hints compared to an already published result in the form of Corine land cover or ground control points grouped and averaged. The satellite products’ low number of images and low spatial resolution was also a problem faced in combining satellite and airborne data [11]. Differences among wetland sites were identified as the next source of uncertainty when multiple watersheds or wetlands are studied combined and treated equally, where the addition of in situ measurements is recommended to avoid errors [5]. However, in situ data in combination with low spatial resolution satellite products has reported the problem of pixels being too big [13], indicating that the combination with in situ data may still require high-resolution imagery either airborne or satellite. Furthermore, the accuracy was not reported in the studies combining airborne with satellite, and performing time series analysis [2][4][15]; hence, this SLR could not evaluate the accuracy.
In the case of wetland mapping, satellite data cannot provide enough information to differentiate among wetland classes, as it occurred for bogs and fens [21], and wetland types [9][23]. Another problem derived from satellite spatial resolution for mapping is the inability to distinguish water bodies, often masked by highly dense vegetation [15][22], or the inability to differentiate small fires; they are accounted for as giant fires, clustering several of them instead of treating them as small individual ones when burn severity is studied [18]. Five out of seven studies using satellite data for wetland mapping specifically reported problems with the spatial resolution of the imagery. In the only article using satellite data in combination with in situ measurements, a problem was reported with skewed data: a non-representative set of ground-based values was overestimating high values of soil organic carbon, for example, and underestimating low ones [20]. With the use of UAV data, the spatial resolution increased; however, when combined with satellite, the results faced issues with noise-free images to monitor phenology [16]. When combined with airborne data, multi-source satellite data were still needed for mapping due to the structural heterogeneity of some wetlands, such as peatlands [19].
Additionally, the low availability of airborne images per year could not capture rapid changes, such as inundation status, to map these processes [8]. Using satellite data with a higher resolution to validate results [17] can result in overestimating the actual accuracy (93.2% accuracy estimated), as it should be obtained from the comparison with ground-based data and not another remote sensing dataset. High-resolution data from UAVs or airborne missions have time, scale, and sometimes even price limitations, so their use also faces challenges [42]. Satellite data used for change detection analysis on wetlands faced the same problems with the heterogeneity and density of wetland vegetation, i.e., mapping, although the average accuracy of the results is higher (Table 2). However, the result can be biased because of the difference in the amount of articles for each monitoring type (Figure 1). The difference in spatial distribution and the spectral similarities among types of wetlands also caused challenges in change detection studies as it was impossible to select a specific shape and spectral indices to perfectly extract the changes over time [43][45][47]. The same can be observed when combining airborne and satellite datasets, [6][44] and satellite and in situ [46]. In contrast, for wetland mapping, the main challenge faced within change detection studies on wetlands was the processes of rapid changes caused by extreme events and strong seasonality of wetlands, with satellites not providing a high enough temporal resolution to monitor them [37][42][48]; the same occurred when combining it with airborne data [40]. The harmonic time series analysis can be used as a solution [49], increasing the accuracy from the average of 89% to 93.35% or by combining with UAV imagery, with 92% accuracy [50]. It is worth noting that the utilization of higher resolution satellite images for validating the results can potentially lead to an overestimation of accuracy. This is exemplified by the inundation and detection disturbances in land cover and their study of associated changes, which achieved a validation accuracy of 91.1% when using imagery from a private satellite, as opposed to in situ data [38].
Table 2. Average accuracy per monitoring strategy for each type of remote sensing data. Note: airborne data were excluded, as only one article used this data type, and the accuracy was not reported.
| Monitoring Strategy | Satellite | Satellite + Airborne | Satellite + In Situ | Satellite + UAV | Total |
|---|---|---|---|---|---|
| Prediction | NA * | NA * | 67% | NA * | 67% |
| Time series analysis | 94% | NA * | 85% | NA * | 91% |
| Mapping | 82% | 94% | 83% | 94% | 86% |
| Classification | 84% | NA* | 97% | NA * | 85% |
| Change detection | 89% | 86% | 89% | 92% | 89% |
| Average total | 85% | 91% | 87% | 93% | 86% |
* NA= not available.
Wetland classification was the second most used monitoring approach, with 15 articles, and was only surpassed by change detection. While not all articles in the remaining sections provide estimates of result accuracy due to insufficient ground-truth measurements, it is noteworthy that all classification analyses carried out in these studies include such estimates. The spectral similarities among wetland types or types of vegetation were again a source of errors (accuracies: 86–96%) [4][27]. However, the heterogeneity and complexity of the wetland ecosystem represented a more significant source of errors (with lower accuracies: 77–88%) [24][25], even with water bodies masked by dense vegetation [34]. The use of harmonic models can decrease the effect of these errors with accuracies of up to 91% [30]. High accuracies have been reported as average, though; sometimes, this is due to the use of other satellite-based classifications to validate the result instead of in situ data [28]. A lack of ground-truth data can affect the validation of the study, decreasing the overall accuracy (72%) [35]. Similarly, training data are needed when applying deep learning techniques. If the training data are not enough, the classification out of the algorithm shows a lowered accuracy (68.7–77.1%) [1][26]. Using a satellite topography data approach to classify wetlands dropped the accuracy of a land cover classification (81.85%) due to the heterogeneity and complexity of wetlands [33]. However, some benefits are added when simultaneously merging synthetic aperture radar (SAR) and optical remote sensing data (82.7% accuracy), as the number of variables used for classification increased [31]. The addition of multiple satellite sources (>4), including private ones with high resolution, especially in combination with ground-truth data, allows wetland classifications with the high level of resolution needed (e.g., for studying floristic composition). These analyses perform with very high accuracy (96%), and an increase in the number of in situ variables is suggested to approach even higher accuracy [32]. The combination of ground-truth data and satellite images, including in situ data, can reach up to 97% accuracy in classifying vegetation types on wetlands, despite some confusion between wetland and non-wetland vegetation [29].
The same sources of uncertainty are usually present independently of the type of monitoring used. The only exception appears with temporal-coverage-related uncertainties present for those using time series analysis, predictions, and detection of wetland changes. In most cases, the overall accuracy has been observed to increase over time due to enhancements in the quality of satellite data. For instance, in a study of land cover changes in a Chinese swamp, estimation accuracies improved from 82% in 1984 to 92% in 2018 [41]. However, no remote sensing data source can perform perfectly by itself. Additionally, applying robust algorithms in large areas implies a large use of computational resources [36]. Consequently, to better assess the uncertainties and improve the monitoring performance, a combination of automatic in situ meteorological stations and satellite and airborne/UAV data, validated with enough reliable in situ measurements using cloud computing services such as GEE, is recommended.
3. Which Monitoring Strategies Were Performed Using Cloud Computing Technology?
When deciding on the type of results, research can be classified according to two approaches: holistic and atomistic. The scale in which the area is analysed determines whether a generalized perspective is used (holistic), or a specific perspective is applied (atomistic). The number of details inside an area or the area covered is often prioritized. Thus, the type of wetland studied will vary with the scale. Minor scales usually focus on a particular type of wetland (e.g., marsh, bog, fen) as the limited area will include only that specific environment. With an increase in scale, the probability of identifying one type of wetland inside the area decreases, and the focus of the study will probably switch from specific vegetation identification to wetland delineation (Figure 2). From the articles reviewed, these two main approaches can be distinguished:
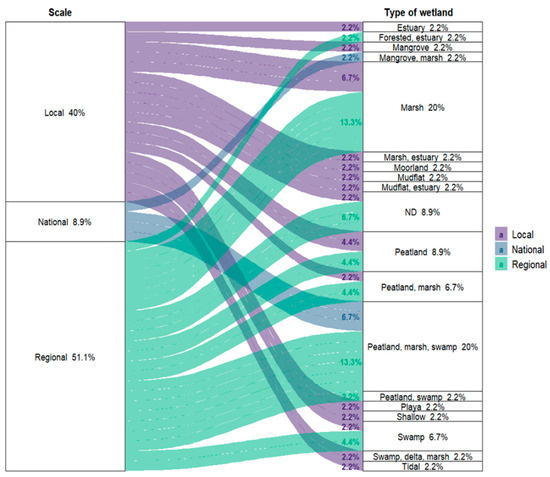
Figure 2. Percentage of papers depending on the scale used and type of wetland plus their distribution based on the relationship between these two parameters.
-
Larger areas with a regional or national scale, including more than one type of wetland;
-
Smaller areas focused on a specific protected area with no more than two types of wetlands.
The type of results varies depending on ecosystem characteristics, as the type of vegetation [2][30][37], water surface changes [39][48], or even burn severity [18] are most often limited to local scale studies. Wetland delineation [44][45], distinguishing types of wetland [6][21][24][26][36], land use [46], or carbon content in the peat [20] are usually completed for larger scale studies. The performance of cloud computing has been suitable in each of the distinct scale–wetland combinations, although the challenges of using remote sensing and cloud computing vary. At the regional scale, the main challenges reported were the similarities between wetland types due to their spectral similarities and spatial heterogeneity. The spectral similarities produced higher confusion among wetland types, with an accuracy for bogs of 86%; reduced to 80% for fens [45]; and 80% in saline marshes studied in China [46]. In a study in the Great Lakes, these spectral similarities induced confusion among wetlands and uplands [4]. Small and highly vegetated wetlands as potholes masked water bodies [22]. Spectral similarities did not allow the differentiation of herbaceous vegetation [25]. The spatial heterogeneity of peatland constrained the results, not allowing the proper distinction of bogs and fens in Canada and reducing the accuracy to 69% [21]. Due to spectral similarities and spatial heterogeneity, the accuracy was reduced to 77% in a Canadian wetland inventory map [24].
Furthermore, the difference in shapes and distribution made monitoring alpine wetlands and swamps in the same study complex [43]. The same occurred with bogs, fens, swamps, and marshes on the island of Newfoundland [6], although bogs showed the highest producer accuracies between 92% and 97%, and fens had the highest user accuracies between 66% and 86%. At the national scale, the challenges were the lack of adequate data with high resolution [26] and low noise [16], or both [7], and the high computational resources for such large datasets [36]. The local-scale studies also faced challenges due to spectral and spatial features. The use of NDVI in wetlands can be compromised by the high moisture content, making it challenging to acquire the best results [14]. Problems with the moisture or water table level were commonly faced at this scale [33] or due to its strong seasonality and fast changes [12][48]. The high heterogeneity of wetlands and spectral similarities, together with the moisture level, makes it almost mandatory to use multi-source approaches at local scales [19]. Apart from this, the same spectral similarities that do not allow the fine distinction among wetland types at a regional scale could make the reproducibility of algorithms hard when they are based on a particular type. Moreover, although high accuracy (96.44%) was displayed at a specific local scale, there is a large possibility that it will be restricted to a particular type of wetland [27]. The confusion occurs due to several uplands and the small areas covered by peatland, making monitoring difficult at the local scale [23][47].
For the excellent performance of the CC models, the generalization of scale adequacy for the CC methodology and its accuracy need to be evaluated. The decreased complexity in the analyses and the lower number of studies at the national scale resulted in the lowest accuracy among all the scales (Table 3). The second lowest was at the local scale, but a more comprehensive range of values for the standard deviation is shown in Table 3. Different monitoring techniques and distinct types of wetlands can be found inside each scale, and usually, the highest deviation is shown inside the groups with the most significant number of papers. This is why almost no deviation occurs at the national scale, as only four papers were found in this group. On average, individual (no more than two types) and mixed type of peatland studies show similar accuracies, 86.0% ± 41.0% and 86.9% ± 22.0%, respectively, but with a different number of papers analysed for each category (33 articles focused on individual types of wetlands and 18 mixed). As previously noted, the scale of wetland studies is often determined by the type of wetland under investigation, whether individual or mixed.
Table 3. Accuracy distribution depends on the study’s scale, with the average represented as the average value ± standard deviation.
| National | Regional | Local | |
|---|---|---|---|
| Average | 81.8 ± 9.6% | 86.9 ± 30.3% | 87 ± 42.5% |
| Max | 94% | 98.2% | 98% |
| Min | 71% | 69% | 67% |
Consequently, authors choose their study targets based on the specific wetland type, and their selection depends on the most suitable location for their research objectives. For this reason, accuracies are similar despite the number of types of wetlands studied. However, an accuracy increase will be expected when only one type of wetland and different performeances depending on the type of wetland (with higher standard deviation as the results) are studied.
Random forest (RF) has been the most widely used when considering the machine learning method (ML) applied, with 19 articles applying it [4][5][9][16][19][23][24][25][26][28][29][30][31][32][36][37][42][45][46] (Figure 3). Ordered from the most to the least repeated, the other ML techniques used have been classification/regression trees (accuracy = 79.2%, [12][21][33][41]), clustering (accuracy = 98%, [8][47][48]), support vector machines (SVM, accuracy = 93.4%, [7][44]), and artificial neuronal networks (ANN, accuracy = 96.4%, [27]). However, when the unique method used was not RF, the authors preferred a mix of multiple ML techniques with lower accuracies than RF reported as the average of all methods applied (accuracy = 85.9%, [1][2][6][20][22][35][49][50]). On the other hand, not all the authors considered ML the technique needed, and index thresholding [12][14][19], object-based image segmentation [17], trend analysis [14][40], or regressions [10][34][38][43] have been successfully used for peatland monitoring (accuracy = 88.8%, [3][15][39]). Because not all papers have reported accuracies, and the number of papers between classes is not comparable, the analysis of the success of each technique cannot be assessed. For example, not using ML presents almost the same average accuracy as RF because only six articles from the thirteen included in this group reported this value, while all the authors provided accuracy when using RF. ANN and SVM methods present the highest accuracies; this is not surprising considering that only three articles used these techniques [7][27][44].
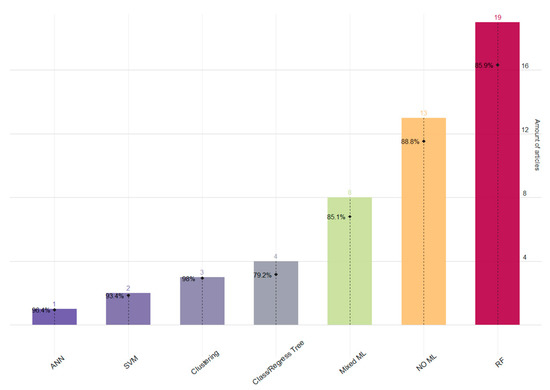
Figure 3. Distribution of the method used and average accuracy. The long-dash line indicates the accuracy scale from 0% to 100%; the dot marks the average accuracy (ANN = 96.4%, SVM = 93.4%, Clustering = 98%, Classification/Regression Tree = 79.2%, Mixed ML = 85.1%, NO ML = 88.8%, and RF = 85.9%).
4. What Economic Gains Can Be Realized from Integrating Cloud Computing and Remote Sensing Data in the Monitoring of Wetlands?
Cloud computing provides benefits at two levels: the first is scaling, as the user organizations save money because they purchase the cloud computing-related resources in massive quantities at lower costs, and thus can provide the services to end users at a lower cost. The second is the global reach of the companies/organizations, which also increases by using cloud computing. As a result, the end users can avoid the substantial up-front capital expenditure costs of purchasing their expensive infrastructure. As in other fields, scientists, companies, and organizations related to wetlands also benefit economically from implementing cloud computing and remote sensing data (Table 4).
Table 4. Cloud computing- and remote sensing-highlighted benefits and the different economic factors they influence in wetlands.
| Factors | RS—Without CC | Benefits Due to CC + RS |
|---|---|---|
| Resolution | Differs | Differs |
| Coverage | Varies | High |
| Capital expenses | High | Less |
| Cost | High | Less |
| Time | Long | Less |
| Human resources | High | Less |
| Global Reach | Limited | High |
Wetlands are ecosystems with very high productivity; thus, they are considered among the most economically valuable ecosystems for society [51]. Wetlands are ecosystems that offer a diverse array of ecosystem services and are regarded as vulnerable systems that exhibit rapid responses to alterations in the surrounding environment [52]. Unfortunately, in the last decades, wetlands have been lost worldwide [53], thus impacting the financial services they provide. Economic valuations of wetland services may provide a better understanding of the loss for an organization and government, but due to wetland location, cost, and time, a field survey is generally not a viable option, especially for poor or developing countries. Due to their significantly lower cost, time, and ability to monitor a large area of wetlands and their resources, cloud computing and remote sensing data may play a significant role in economic decision making by policymakers and stakeholders. Using GEE, researchers reported a significant loss in semi-arid southern African wetlands due to unsustainable use and poor management [54], thus pushing the authorities to act differently to preserve their resources. The authors also showed how cloud computing platforms might offer unique significant data handling and processing opportunities for scientists or workers with limited resources. Thus, economically favourable policies can be created for a wetland ecosystem using cloud computing and remote sensing.
References
- Gxokwe, S.; Dube, T.; Mazvimavi, D. Leveraging Google Earth Engine Platform to Characterize and Map Small Seasonal Wetlands in the Semi-Arid Environments of South Africa. Sci. Total Environ. 2022, 803, 150139.
- Long, X.; Li, X.; Lin, H.; Zhang, M. Mapping the Vegetation Distribution and Dynamics of a Wetland Using Adaptive-Stacking and Google Earth Engine Based on Multi-Source Remote Sensing Data. Int. J. Appl. Earth Obs. Geoinf. 2021, 102, 102453.
- Dervisoglu, A. Analysis of the Temporal Changes of Inland Ramsar Sites in Turkey Using Google Earth Engine. ISPRS Int. J. Geo-Inf. 2021, 10, 521.
- Valenti, V.L.; Carcelen, E.C.; Lange, K.; Russo, N.J.; Chapman, B. Leveraging Google Earth Engine User Interface for Semiautomated Wetland Classification in the Great Lakes Basin at 10 m with Optical and Radar Geospatial Datasets. IEEE J. Sel. Top. Appl. Earth Obs. Remote Sens. 2020, 13, 6008–6018.
- Campbell, A.D.; Wang, Y. Salt Marsh Monitoring along the Mid-Atlantic Coast by Google Earth Engine Enabled Time Series. PLoS ONE 2020, 15, e0229605.
- Mahdianpari, M.; Jafarzadeh, H.; Granger, J.E.; Mohammadimanesh, F.; Brisco, B.; Salehi, B.; Homayouni, S.; Weng, Q. A Large-Scale Change Monitoring of Wetlands Using Time Series Landsat Imagery on Google Earth Engine: A Case Study in Newfoundland. GISci. Remote Sens. 2020, 57, 1102–1124.
- Zhang, L.; Hu, Q.; Tang, Z. Assessing the Contemporary Status of Nebraska’s Eastern Saline Wetlands by Using a Machine Learning Algorithm on the Google Earth Engine Cloud Computing Platform. Environ. Monit. Assess. 2022, 194, 193.
- Wu, Q.; Lane, C.R.; Li, X.; Zhao, K.; Zhou, Y.; Clinton, N.; DeVries, B.; Golden, H.E.; Lang, M.W. Integrating LiDAR Data and Multi-Temporal Aerial Imagery to Map Wetland Inundation Dynamics Using Google Earth Engine. Remote Sens. Environ. 2019, 228, 1–13.
- Mahdianpari, M.; Brisco, B.; Granger, J.; Mohammadimanesh, F.; Salehi, B.; Homayouni, S.; Bourgeau-Chavez, L. The Third Generation of Pan-Canadian Wetland Map at 10 m Resolution Using Multisource Earth Observation Data on Cloud Computing Platform. IEEE J. Sel. Top. Appl. Earth Obs. Remote Sens. 2021, 14, 8789–8803.
- Miller, G.J.; Dronova, I.; Oikawa, P.Y.; Knox, S.H.; Windham-Myers, L.; Shahan, J.; Stuart-Haëntjens, E. The Potential of Satellite Remote Sensing Time Series to Uncover Wetland Phenology under Unique Challenges of Tidal Setting. Remote Sens. 2021, 13, 3589.
- Tang, Z.; Li, Y.; Gu, Y.; Jiang, W.; Xue, Y.; Hu, Q.; LaGrange, T.; Bishop, A.; Drahota, J.; Li, R. Assessing Nebraska Playa Wetland Inundation Status during 1985–2015 Using Landsat Data and Google Earth Engine. Environ. Monit. Assess. 2016, 188, 654.
- Alonso, A.; Muñoz-Carpena, R.; Kaplan, D. Coupling High-Resolution Field Monitoring and MODIS for Reconstructing Wetland Historical Hydroperiod at a High Temporal Frequency. Remote Sens. Environ. 2020, 247, 111807.
- Li, Z.; Sun, W.; Chen, H.; Xue, B.; Yu, J.; Tian, Z. Interannual and Seasonal Variations of Hydrological Connectivity in a Large Shallow Wetland of North China Estimated from Landsat 8 Images. Remote Sens. 2021, 13, 1214.
- Alonso, A.; Muñoz-Carpena, R.; Kennedy, R.E.; Murcia, C. Wetland Landscape Spatio-Temporal Degradation Dynamics Using the New Google Earth Engine Cloud-Based Platform: Opportunities for Non-Specialists in Remote Sensing. Trans. ASABE 2016, 59, 1333–1344.
- Hardy, A.; Oakes, G.; Ettritch, G. Tropical Wetland (TropWet) Mapping Tool: The Automatic Detection of Open and Vegetated Waterbodies in Google Earth Engine for Tropical Wetlands. Remote Sens. 2020, 12, 1182.
- Zhang, Z.; Xu, N.; Li, Y.; Li, Y. Sub-Continental-Scale Mapping of Tidal Wetland Composition for East Asia: A Novel Algorithm Integrating Satellite Tide-Level and Phenological Features. Remote Sens. Environ. 2022, 269, 112799.
- Steinbach, S.; Cornish, N.; Franke, J.; Hentze, K.; Strauch, A.; Thonfeld, F.; Zwart, S.J.; Nelson, A. A New Conceptual Framework for Integrating Earth Observation in Large-Scale Wetland Management in East Africa. Wetlands 2021, 41, 93.
- Lees, K.J.; Buxton, J.; Boulton, C.A.; Abrams, J.F.; Lenton, T.M. Using Satellite Data to Assess Management Frequency and Rate of Regeneration on Heather Moorlands in England as a Resilience Indicator. Environ. Res. Commun. 2021, 3, 085003.
- Amoakoh, A.O.; Aplin, P.; Awuah, K.T.; Delgado-Fernandez, I.; Moses, C.; Alonso, C.P.; Kankam, S.; Mensah, J.C. Testing the Contribution of Multi-source Remote Sensing Features for Random Forest Classification of the Greater Amanzule Tropical Peatland. Sensors 2021, 21, 3399.
- Sothe, C.; Gonsamo, A.; Arabian, J.; Snider, J. Large Scale Mapping of Soil Organic Carbon Concentration with 3D Machine Learning and Satellite Observations. Geoderma 2022, 405, 115402.
- DeLancey, E.R.; Kariyeva, J.; Bried, J.T.; Hird, J.N. Large-Scale Probabilistic Identification of Boreal Peatlands Using Google Earth Engine, Open-Access Satellite Data, and Machine Learning. PLoS ONE 2019, 14, e0218165.
- Sahour, H.; Kemink, K.M.; O’Connell, J. Integrating Sar and Optical Remote Sensing for Conservation-Targeted Wetlands Mapping. Remote Sens. 2022, 14, 159.
- Lamb, B.T.; Tzortziou, M.A.; McDonald, K.C. Evaluation of Approaches for Mapping Tidal Wetlands of the Chesapeake and Delaware Bays. Remote Sens. 2019, 11, 2366.
- Amani, M.; Brisco, B.; Afshar, M.; Mirmazloumi, S.M.; Mahdavi, S.; Mirzadeh, S.M.J.; Huang, W.; Granger, J. A Generalized Supervised Classification Scheme to Produce Provincial Wetland Inventory Maps: An Application of Google Earth Engine for Big Geo Data Processing. Big Earth Data 2019, 3, 378–394.
- Mahdianpari, M.; Salehi, B.; Mohammadimanesh, F.; Homayouni, S.; Gill, E. The First Wetland Inventory Map of Newfoundland at a Spatial Resolution of 10 m Using Sentinel-1 and Sentinel-2 Data on the Google Earth Engine Cloud Computing Platform. Remote Sens. 2019, 11, 43.
- Mahdianpari, M.; Salehi, B.; Mohammadimanesh, F.; Brisco, B.; Homayouni, S.; Gill, E.; DeLancey, E.R.; Bourgeau-Chavez, L. Big Data for a Big Country: The First Generation of Canadian Wetland Inventory Map at a Spatial Resolution of 10-m Using Sentinel-1 and Sentinel-2 Data on the Google Earth Engine Cloud Computing Platform. Can. J. Remote Sens. 2020, 46, 15–33.
- Ghorbanian, A.; Ahmadi, S.A.; Amani, M.; Mohammadzadeh, A.; Jamali, S. Application of Artificial Neural Networks for Mangrove Mapping Using Multi-Temporal and Multi-Source Remote Sensing Imagery. Water 2022, 14, 244.
- Lourenco, M.; Fitchett, J.M.; Woodborne, S. Angolan Highlands Peatlands: Extent, Age and Growth Dynamics. Sci. Total Environ. 2022, 810, 152315.
- Fekri, E.; Latifi, H.; Amani, M.; Zobeidinezhad, A. A Training Sample Migration Method for Wetland Mapping and Monitoring Using Sentinel Data in Google Earth Engine. Remote Sens. 2021, 13, 4169.
- Wu, N.; Shi, R.; Zhuo, W.; Zhang, C.; Zhou, B.; Xia, Z.; Tao, Z.; Gao, W.; Tian, B. A Classification of Tidal Flat Wetland Vegetation Combining Phenological Features with Google Earth Engine. Remote Sens. 2021, 13, 443.
- Sun, S.; Zhang, Y.; Song, Z.; Chen, B.; Zhang, Y.; Yuan, W.; Chen, C.; Chen, W.; Ran, X.; Wang, Y. Mapping Coastal Wetlands of the Bohai Rim at a Spatial Resolution of 10 M Using Multiple Open-Access Satellite Data and Terrain Indices. Remote Sens. 2020, 12, 4114.
- Honorio Coronado, E.N.; Hastie, A.; Reyna, J.; Flores, G.; Grández, J.; Lahteenoja, O.; Draper, F.C.; Åkesson, C.M.; Baker, T.R.; Bhomia, R.K.; et al. Intensive Field Sampling Increases the Known Extent of Carbon-Rich Amazonian Peatland Pole Forests. Environ. Res. Lett. 2021, 16, 074048.
- Hird, J.N.; DeLancey, E.R.; McDermid, G.J.; Kariyeva, J. Google Earth Engine, Open-Access Satellite Data, and Machine Learning in Support of Large-Area Probabilisticwetland Mapping. Remote Sens. 2017, 9, 1315.
- Pereira, O.J.R.; Merino, E.R.; Montes, C.R.; Barbiero, L.; Rezende-Filho, A.T.; Lucas, Y.; Melfi, A.J. Estimating Water PH Using Cloud-Based Landsat Images for a New Classification of the Nhecolândia Lakes (Brazilian Pantanal). Remote Sens. 2020, 12, 1090.
- DeLancey, E.R.; Simms, J.F.; Mahdianpari, M.; Brisco, B.; Mahoney, C.; Kariyeva, J. Comparing Deep Learning and Shallow Learning for Large-Scalewetland Classification in Alberta, Canada. Remote Sens. 2020, 12, 2.
- Amani, M.; Mahdavi, S.; Afshar, M.; Brisco, B.; Huang, W.; Mirzadeh, S.M.J.; White, L.; Banks, S.; Montgomery, J.; Hopkinson, C. Canadian Wetland Inventory Using Google Earth Engine: The First Map and Preliminary Results. Remote Sens. 2019, 11, 842.
- Wang, Z.; Ke, Y.; Chen, M.; Zhou, D.; Zhu, L.; Bai, J. Mapping Coastal Wetlands in the Yellow River Delta, China during 2008–2019: Impacts of Valid Observations, Harmonic Regression, and Critical Months. Int. J. Remote Sens. 2021, 42, 7880–7906.
- Vanderhoof, M.K.; Christensen, J.; Beal, Y.J.G.; DeVries, B.; Lang, M.W.; Hwang, N.; Mazzarella, C.; Jones, J.W. Isolating Anthropogenic Wetland Loss by Concurrently Tracking Inundation and Land Cover Disturbance across the Mid-Atlantic Region, U.S. Remote Sens. 2020, 12, 1464.
- Dervisoglu, A. Investigation of Long and Short-Term Water Surface Area Changes in Coastal Ramsar Sites in Turkey with Google Earth Engine. ISPRS Int. J. Geo-Inf. 2022, 11, 46.
- Al-Nasrawi, A.K.M.; Fuentes, I.; Al-Shammari, D. Changes in Mesopotamian Wetlands: Investigations Using Diverse Remote Sensing Datasets. Wetlands 2021, 41, 94.
- Cui, G.; Liu, Y.; Tong, S. Analysis of the Causes of Wetland Landscape Patterns and Hydrological Connectivity Changes in Momoge National Nature Reserve Based on the Google Earth Engine Platform. Arab. J. Geosci. 2021, 14, 170.
- Liu, Q.; Zhang, Y.; Liu, L.; Wang, Z.; Nie, Y.; Rai, M. A Novel Landsat-Based Automated Mapping of Marsh Wetland in the Headwaters of the Brahmaputra, Ganges and Indus Rivers, Southwestern Tibetan Plateau. Int. J. Appl. Earth Obs. Geoinf. 2021, 103, 102481.
- Wang, H.; Kong, X.; Luo, J.; Li, P.; Xie, T.; Yi, X.; Wang, F.; Xiao, J. A Novel Approach for Monitoring the Ecoenvironment of Alpine Wetlands Using Big Geospatial Data and Cloud Computing. Adv. Meteorol. 2022, 2022, 1–20.
- Gemechu, G.F.; Rui, X.; Lu, H. Wetland Change Mapping Using Machine Learning Algorithms, and Their Link with Climate Variation and Economic Growth: A Case Study of Guangling County, China. Sustainability 2022, 14, 439.
- Amani, M.; Mahdavi, S.; Kakooei, M.; Ghorbanian, A.; Brisco, B.; Delancey, E.; Toure, S.; Reyes, E.L. Wetland Change Analysis in Alberta, Canada Using Four Decades of Landsat Imagery. IEEE J. Sel. Top. Appl. Earth Obs. Remote Sens. 2021, 14, 10314–10335.
- Shi, S.; Chang, Y.; Li, Y.; Hu, Y.; Liu, M.; Ma, J.; Xiong, Z.; Wen, D.; Li, B.; Zhang, T. Using Time Series Optical and SAR Data to Assess the Impact of Historical Wetland Change on Current Wetland in Zhenlai County, Jilin Province, China. Remote Sens. 2021, 13, 4514.
- Yang, Y.; Zhang, Y.; Su, X.; Hou, H.; Zhang, S. The Spatial Distribution and Expansion of Subsided Wetlands Induced by Underground Coal Mining in Eastern China. Environ. Earth Sci. 2021, 80, 112.
- Gulácsi, A.; Kovács, F. Sentinel-1-Imagery-Based High-Resolutionwater Cover Detection on Wetlands, Aided by Google Earth Engine. Remote Sens. 2020, 12, 1614.
- Ashok, A.; Rani, H.P.; Jayakumar, K.V. Monitoring of Dynamic Wetland Changes Using NDVI and NDWI Based Landsat Imagery. Remote Sens. Appl. Soc. Environ. 2021, 23, 100547.
- Li, W.; Xue, P.; Liu, C.; Yan, H.; Zhu, G.; Cao, Y. Monitoring and Landscape Dynamic Analysis of Alpine Wetland Area Based on Multiple Algorithms: A Case Study of Zoige Plateau. Sensors 2020, 20, 7315.
- Chaikumbung, M.; Doucouliagos, H.; Scarborough, H. The Economic Value of Wetlands in Developing Countries: A Meta-Regression Analysis. Ecol. Econ. 2016, 124, 164–174.
- Alikhani, S.; Nummi, P.; Ojala, A. Urban Wetlands: A Review on Ecological and Cultural Values. Water 2021, 13, 3301.
- Murray, N.J.; Worthington, T.A.; Bunting, P.; Duce, S.; Hagger, V.; Lovelock, C.E.; Lucas, R.; Saunders, M.I.; Sheaves, M.; Spalding, M.; et al. High-Resolution Mapping of Losses and Gains of Earth’s Tidal Wetlands. Science 2022, 376, 744–749.
- Gxokwe, S.; Dube, T.; Mazvimavi, D.; Grenfell, M. Using Cloud Computing Techniques to Monitor Long-Term Variations in Ecohydrological Dynamics of Small Seasonally-Flooded Wetlands in Semi-Arid South Africa. J. Hydrol. 2022, 612, 128080.
More
Information
Subjects:
Remote Sensing
Contributors
MDPI registered users' name will be linked to their SciProfiles pages. To register with us, please refer to https://encyclopedia.pub/register
:
View Times:
741
Revisions:
2 times
(View History)
Update Date:
29 Mar 2023
Table of Contents


Notice
You are not a member of the advisory board for this topic. If you want to update advisory board member profile, please contact office@encyclopedia.pub.
OK
Confirm
Only members of the Encyclopedia advisory board for this topic are allowed to note entries. Would you like to become an advisory board member of the Encyclopedia?
Yes
No
${ textCharacter }/${ maxCharacter }
Submit
Cancel
Back
Comments
${ item }
|
${ item.createdUser.fullName }
${ item.createdAt }
${ item.vote }
${ item.reply }
Delete
${ reply.createdUser.fullName }
${ reply.createdAt }
${ reply.vote }
Delete
There is no reply to this comment~
${ item.replyTextCharacter }/${ item.replyMaxCharacter }
Submit
Cancel
More
No more~
There is no comment~
${ textCharacter }/${ maxCharacter }
Submit
Cancel
${ selectedItem.replyTextCharacter }/${ selectedItem.replyMaxCharacter }
Submit
Cancel
Confirm
Are you sure to Delete?
Yes
No