Your browser does not fully support modern features. Please upgrade for a smoother experience.
Submitted Successfully!
 +1 credit
Thank you for your contribution! You can also upload a video entry or images related to this topic.
For video creation, please contact our Academic Video Service.
| Version | Summary | Created by | Modification | Content Size | Created at | Operation |
|---|---|---|---|---|---|---|
| 1 | Samy sayed | -- | 2702 | 2023-02-17 13:41:00 | | | |
| 2 | Jason Zhu | -5 word(s) | 2674 | 2023-02-20 03:05:08 | | |
Video Upload Options
We provide professional Academic Video Service to translate complex research into visually appealing presentations. Would you like to try it?
Cite
If you have any further questions, please contact Encyclopedia Editorial Office.
Naresh, R.K.; Bhatt, R.; Chandra, M.S.; Laing, A.M.; Gaber, A.; Sayed, S.; Hossain, A. Improvement of Soil Organic Carbon and System Environmental. Encyclopedia. Available online: https://encyclopedia.pub/entry/41360 (accessed on 24 June 2026).
Naresh RK, Bhatt R, Chandra MS, Laing AM, Gaber A, Sayed S, et al. Improvement of Soil Organic Carbon and System Environmental. Encyclopedia. Available at: https://encyclopedia.pub/entry/41360. Accessed June 24, 2026.
Naresh, Rama Krishna, Rajan Bhatt, M. Sharath Chandra, Alison M. Laing, Ahmed Gaber, Samy Sayed, Akbar Hossain. "Improvement of Soil Organic Carbon and System Environmental" Encyclopedia, https://encyclopedia.pub/entry/41360 (accessed June 24, 2026).
Naresh, R.K., Bhatt, R., Chandra, M.S., Laing, A.M., Gaber, A., Sayed, S., & Hossain, A. (2023, February 17). Improvement of Soil Organic Carbon and System Environmental. In Encyclopedia. https://encyclopedia.pub/entry/41360
Naresh, Rama Krishna, et al. "Improvement of Soil Organic Carbon and System Environmental." Encyclopedia. Web. 17 February, 2023.
Copy Citation
A six-year experiment (2009 to 2015) was conducted on sugarcane-based cropping systems in farmers’ fields to examine the effects of precision land leveling (PLL) compared to traditional land leveling (TLL) in terms of soil organic carbon (SOC), greenhouse gas emissions, irrigation water requirements, and system productivity and profitability.
precision land leveling
soil organic carbon
crop diversification
energy use pattern
environmental footprint
1. Introduction
Sugarcane is an important food crop, from which jaggery, cane sugar, and refined sugar are produced [1]. The Indian state of Uttar Pradesh, which is the epicenter of the country’s sugarcane production, produces 135 m tons of sugar on over 2.2 Mha of land, and has 119 operational sugar processing factories. Sugarcane farming is the state’s most important source of revenue and industrial development [2][3][4][5]. By 2030 sugarcane demand is expected to increase, and the amount recovered after cane processing will need to increase by 10.75% to meet this demand [3]. Sugarcane can be planted either in autumn (October to November) or spring (February to March). Optimal cane germination occurs when average air temperatures range between 20 °C and 32 °C [6].
Aggregate stability is determined by the characteristics and amount of humic chemicals in the soil, as well as their level of interaction with clay particles. [7]. Many factors affect SOC levels within the soil, including aggregate type [8], aggregate physico-chemical characteristics, and aggregate organic carbon stability [9]. SOC storage and soil-nutrient turnover are affected by structural stability, soil aggregation, and the preference of some microbial groups for some soil micro-resources [10]. Soil structural stability is greatly influenced by land use change uses [11] and cultivation practice [12].
2. Production Efficiency and Land Use Efficiency
Of the twelve experimental treatments, the crop rotations with PLL combined with autumn- or spring-sown sugarcane had the highest average daily productivity, followed by their counterpart rotations under TLL (Table 1; Figure 1). The treatments with late-sown spring sugarcane had the lowest productivity under either laser leveling option. High potato and maize productivity potential, as well as higher bean yields in pea, black gram, and mustard, could explain why these systems are so efficient. Furthermore, as a result of increased output, higher reward was achieved. Potato/maize/mustard/pea/black gram-based systems reported to be productive and profitable than cereal-based systems. T5 and T6 showed [13] the highest production efficiency, better water and nutrient availability [14][15], and better soil microbial activities [16] due to PLL.
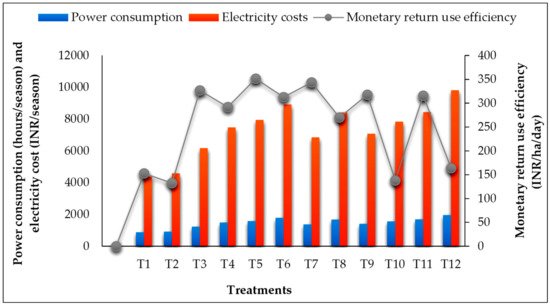
Figure 1. Power consumption, electricity cost, and monetary return use efficiency of experimental treatments.
Table 1. Water use efficiency, employment generation efficiency, productivity, net return, and system profitability of experimental treatments.
| Treatments | WUE (kg Grain m−3) Water Used) |
EGE (Man dayha−1 day−1) | Productivity (kg ha−1 day−1) |
Net Return (INR ha−1) | System Profitability (INR ha−1 day−1) |
|---|---|---|---|---|---|
| T1 | 2.149 | 0.58 | 49.8 | 55,520 | 174.2 |
| T2 | 0.963 | 0.96 | 45.1 | 48,410 | 163.9 |
| T3 | 1.678 | 1.52 | 83.3 | 126,689 | 346.8 |
| T4 | 0.784 | 1.73 | 55.9 | 59,091 | 176.8 |
| T5 | 2.892 | 1.56 | 89.7 | 154,030 | 388.9 |
| T6 | 1.058 | 1.95 | 80.3 | 123,933 | 346.2 |
| T7 | 1.883 | 1.38 | 88.6 | 141,765 | 376.2 |
| T8 | 0.875 | 1.65 | 79.3 | 119,793 | 328.6 |
| T9 | 2.216 | 0.64 | 84.2 | 138,050 | 361.4 |
| T10 | 0.986 | 1.21 | 71.8 | 102,142 | 288.8 |
| T11 | 1.378 | 1.25 | 81.2 | 131,800 | 359.3 |
| T12 | 0.635 | 1.41 | 57.4 | 68,600 | 188.7 |
3. Production, Monetary, and Employment Efficiencies
Maximum daily cropping system productivity (89.7 kg ha−1 day−1), daily monetary return use efficiency (351.6 INR ha−1 day−1), and daily cropping scheme profitability (388.9 INR ha−1 day−1) were observed in T5 (Table 1; Figure 1). Other treatments that performed well in terms of these metrics were T7 and T9; all three cropping systems included a spring-sown sugarcane and PLL. Of the cereal crops, maize has a higher economic value than rice, whereas potato, pea, and mustard are all higher-value vegetable crops: rotations with these crops (rather than those with lower-value crops) achieved higher system productivity and are thus more attractive options for smallholder famers. Thus, there is potential to replace the traditional rice and wheat crops, with which sugarcane is rotated, with other crops with both higher economic value and capacity to improve soil health.
As compared to the T11 system, T5, T7, and T9 gave 1.29, 1.27, and 1.21 times higher productivity, saved 51–69 cm of irrigation water. The T5 system used 51 cm less water and reported with highest productivity (89.7 kg ha−1 day−1) and has productivity margin of 8.5 kgha−1 day−1. The T7 system produced 88.6 kg ha−1 day−1 with 132 cm irrigation water (Table 1), resulting in a 61 cm water savings. T5 cropping system used 155 cm of irrigation water and produced 84.2 kgha−1 day−1, while T4 cropping system used 38 cm of irrigation water and produced 84.2 kgha−1 day−1. This could be due to the black gram pulse crop, which, when compared to the R-W-S-R-W system, reduced water loss due to evaporation, percolation, and seepage [15][16][17][18]. The highest net returns were INR 138,982 ha−1 annum−1 in the R-P-S-R-W system, which was 1.39 times greater than the R-W-S-R-W system (Table 1), followed by INR 130,779 and Rs. 120,096, respectively, in the R-M-S-R-W and R-P-S-R-W sequences. As compared to the R-W-S-R-W system, the R-P-S-R-W, R-M-S-R-W, and M-S-R-W consumed 17.9, 24.8, and 32.1% lesser irrigation water which further resulted in saving electricity consumption by 140, 300, and 460 electricity units’ ha−1, respectively (Table 1; Figure 1). Similar observations were also reported by Bohra et al. [19]; Rathore et al. [20].
4. Resource Use Efficiency
Cropping system profitability ranged from 163.9 (T2) to 388.9 (T5) INR ha−1 day−1, with MRUE values ranging from 132.6 (T2) to 351.6 (T5) INR ha−1 day−1 (Table 1). Similar trends of high profitability under PLL and spring-sown sugarcane were reported by Singh et al. [21] and Sharma [15][22].
Labor requirements where highest in the T6 cropping system (1.95 person days ha−1 day−1) and lowest in T1 (0.58 person days ha−1 da−1). Overall, in the more profitable spring-sown PLL treatments, labor requirements varied between 0.64 (T9) and 1.56 (T5) person days ha−1 day−1. Intercropping increased the labor required for weeding by 36% compared to the sole crops. T8, T10, and T12 only hire farmers for 1.73, 1.65, and 1.41 men days ha−1 day−1, respectively, but >0.58 men days ha−1 day−1 engagement in any order resulted in underemployment, as documented by [23][24][25][26] (Table 1; Figure 1).
5. Soil Organic Carbon Patterns
The treatment T5 had the greatest soil organic carbon concentration in the surface layer (0–15 cm) at 8.76 g kg−1, followed by T11 (8.52 g kg−1) (Table 2). Treatments with PLL achieved maximum soil organic carbon concentrations in the surface and lower soil layers than were observed in treatments with TLL. Across all treatments, the mean SOC concentration varied from 2.69 inT8 to 6.91 g kg−1 in T5 and with almost nil improvements in T2 emphasizing the role of laser levelling [27]. The greatest improvement in SOC concentration was observed in the T9 (8.25 g kg−1) and T3 (7.45 g kg−1) treatments.
Table 2. After 6 years, changes in soil organic carbon (SOC) concentration (g kg–1) under alternative agricultural systems and precision land levelling procedures.
| Soil Depth (cm) |
Inherent (2009) |
T1 | T2 | T3 | T4 | T5 | T6 | T7 | T8 | T9 | T10 | T11 | T12 | Mean |
|---|---|---|---|---|---|---|---|---|---|---|---|---|---|---|
| 0–15 | 6.7 ± 0.26 | 7.21 ± 0.74 d | 4.85 ± 0.23 c | 7.45 ± 1.40 d | 4.92 ± 0.23 a | 8.76 ± 0.21 c | 5.93 ± 0.28 a | 7.09 ± 1.09 b | 3.96 ± 0.18 b | 8.25 ± 1.16 b | 5.26 ± 0.2 b | 8.52 ± 1.40 c | 5.53 ± 0.26 a | 6.48 ± 0.62 |
| 15–30 | 6.2 ± 0.25 | 6.77 ± 0.30 d | 3.64 ± 0.18 c | 6.95 ± 1.16 b | 4.17 ± 0.21 b | 8.33 ± 1.15 c | 5.52 ± 0.23 a | 6.44 ± 1.84 c | 3.47 ± 0.17 a | 7.84 ± 1.08 d | 4.83 ± 0.19 b | 8.06 ± 1.30 d | 5.23 ± 0.22 a | 5.94 ± 0.67 |
| 30–60 | 5.1 ± 0.19 | 6.17 ± 0.12 a | 2.97 ± 0.15 c | 6.44 ± 1.16 a | 3.65 ± 0.18 c | 7.72 ± 0.34 a | 5.25 ± 0.21 b | 5.92 ± 0.35 b | 2.75 ± 0.13 a | 7.62 ± 0.33 b | 3.62 ± 0.18 c | 6.99 ± 0.34 b | 4.76 ± 0.19 b | 5.32 ± 0.31 |
| 60–90 | 4.3 ± 0.13 | 4.52 ± 0.14 c | 2.18 ± 0.11 a | 4.76 ± 0.21 c | 2.74 ± 0.14 a | 5.88 ± 0.09 a | 3.61 ± 0.19 c | 4.71 ± 0.22 d | 1.92 ± 0.11 a | 5.09 ± 0.09 b | 2.98 ± 0.15 c | 5.66 ± 0.12 a | 2.95 ± 0.15 a | 3.92 ± 0.14 |
| 90–120 | 3.4 ± 0.09 | 2.53 ± 0.18 a | 1.53 ± 0.07 b | 2.88 ± 0.09 a | 1.66 ± 0.09 b | 3.87 ± 0.12 b | 2.46 ± 0.13 d | 2.47 ± 0.23 b | 1.36 ± 0.07 d | 3.13 ± 0.23 a | 1.74 ± 0.10 b | 3.62 ± 0.33 b | 1.92 ± 0.12 b | 2.43 ± 0.15 |
| Mean | 5.14 ± 0.18 | 5.00 ± 0.29 | 3.03 ± 0.15 | 5.69 ± 0.80 | 3.43 ± 0.17 | 6.91 ± 0.38 | 4.55 ± 0.21 | 5.33 ± 0.75 | 2.69 ± 0.13 | 6.39 ± 0.58 | 3.69 ± 0.17 | 6.57 ± 0.69 | 4.08 ± 0.19 | - |
In 2012–13, SOC values were 11% higher under T5 than T8, and 10% higher with T11. By the end of the experiment (i.e., after six years), SOC was 25% higher in T5 than T8 and 16% higher with T11 and 17% higher with T9 than T8, respectively. However, the SOC contents was just 7% higher under conventional leveling. Under PLL in the 20–30 cm layer, recorded SOC values were 12% and 19% higher than with T2 and T8 treatments, respectively (Table 2).
6. Changes in SOC over Time: Temporal Comparison
Average SOC stocks in the top 400 kg of soil dropped from 5.92 to 5.41 kg C m−2 (Table 3). Between 2009 and 2015, changes in important treatments were −1.88 ± 0.04 kg C m−2 in T8 (i.e., 5.41 to 4.89 kg C m−2); −0.68 ± 0.2 kg C m−2 in T10 (i.e., 5.93 to 5.28 kg C m−2); −0.82 ± 0.09 kg C m−2 in T4 (i.e., 5.92 to 5.22 kg C m−2); and −0.700 ± 0.09 kg C m−2 in (i.e., 5.48 to 5.05 C m−2). PLL-treated plants stored larger fractions of atmospheric carbon and, in certain circumstances, established an equilibrium of C imports and exports. SOC stocks decreased after six years in TLL therapy. Over the six-year trial, similar trends in soil C content were seen in lower soil layers (i.e., 400–800 and 800–1200 kg of soil m−2): the average over all PLL treatments was −0.070 ± 0.06 and −0.020 ± 0.02 kg C m−2 in the 400–800 and 800–1200 kg of soil−2 intervals, respectively. This approximates an average yearly rate of change of −6.9 and −5.6 g C m−2 year−1 for the mid and lower soil layers, respectively (Table 3).
Table 3. Annual rate of change in multiple soil mass intervals and variations in SOC stocks from (averaged over alternative cropping systems and precision land leveling practices) 2009 and in 2015.
| Crop Sequences | Soil Organic Carbon ( ± Standard Error) | |||||||||||
|---|---|---|---|---|---|---|---|---|---|---|---|---|
| 0–400 kg of Soil m−2 (Approx. 0–30 cm) |
SOC Change Rate g of Cm−2 year−1 |
400–800 kg of Soil m−2 (Approx. 30–60 cm) |
Annual SOC Change Rate g of C m−2 year−1 |
800–1200 kg of Soil m−2 (Approx. 60–90 cm) |
SOC Change Rate g of Cm−2 year−1 |
|||||||
| 2009 | 2015 | Difference | 2009 | 2015 | Difference | 2009 | 2015 | Difference | ||||
| kg m−2 | kg m−2 | kg m−2 | ||||||||||
| T1 | 8.12 | 9.11 * | 0.99 ± 0.2 | 46.2 | 5.47 | 5.57 | 0.10 ± 0.09 | 7.1 | 3.38 | 3.47 | 0.01 ± 0.11 | 4.4 |
| T2 | 5.48 | 5.05 | −0.70 ± 0.09 | −23.3 | 3.85 | 3.18 | −0.09 ± 0.06 | −6.1 | 2.92 | 2.57 | −0.02 ± 0.02 | −5.4 |
| T3 | 8.81 | 8.75 | 0.06 ± 0.05 | 25.7 | 5.82 | 5.31 * | 0.51 ± 0.2 | 4.5 | 2.93 | 2.67 | 0.26 ± 0.02 | 5.7 |
| T4 | 5.92 | 5.22 | −0.82 ± 0.09 | −21.4 | 4.05 | 3.98 | −0.07 ± 0.09 | −5.5 | 2.42 | 2.37 | −0.05 ± 0.02 | −4.2 |
| T5 | 9.18 * | 9.87 | −0.69 ± 0.2 | 82.1 | 7.62 | 7.64 | 0.02 ± 0.2 | 8.8 | 5.04 | 5.08 | 0.04 ± 0.01 | 7.2 |
| T6 | 6.62 | 6.18 | −0.79 ± 0.2 | −13.6 | 5.36 | 5.27 | −0.46 ± 0.07 | −4.8 | 3.56 | 3.28 | −0.18 ± 0.02 | −1.8 |
| T7 | 7.46 | 7.15 * | 0.31 ± 0.03 | 28.2 | 5.39 | 5.65 | 0.26 ± 0.09 | 3.9 | 4.14 | 4.12 | 0.02 ± 0.01 | 1.8 |
| T8 | 5.41 | 4.89 | −1.88 ± 0.04 | −67.8 | 3.35 | 3.08 | −0.07 ± 0.06 | −6.9 | 2.72 | 2.37 | −0.02 ± 0.02 | −5.6 |
| T9 | 8.98 * | 9.77 | 0.79 ± 0.2 | 57.4 | 7.03 | 7.11 | 0.08 ± 0.2 | 1.5 | 3.72 | 3.81 | 0.09 ± 0.11 | 5.1 |
| T10 | 5.93 | 5.28 | −0.68 ± 0.2 | −19.2 | 4.05 | 3.98 | −0.07 ± 0.09 | −5.5 | 2.42 | 2.37 | −0.05 ± 0.02 | −3.9 |
| T11 | 9.15 | 9.29 | 0.14 ± 0.9 | 19.6 | 5.72 | 5.88 | 0.16 ± 0.09 | 7.3 | 4.57 | 4.58 | 0.01 ± 0.01 | 0.6 |
| T12 | 6.01 | 5.75 | −0.70 ± 0.09 | −16.3 | 4.85 | 4.18 | −0.31 ± 0.09 | −5.1 | 3.42 | 3.37 | −0.15 ± 0.02 | −2.4 |
Due to associated errors during its calculation, SOC estimates in the 400–800 and 800–1200 kg m−2 layers were small. Over the entire 0 to 1200 kg m−2 soil depth, SOC stocks did not vary greatly under different land leveling treatments (Table 3), although superficial differences were observed during 2015 between rotations.
Under T5, SOC increased from 22.33 to 24.31 kg C m−2 between 2009 and 2015. Changes were also observed in T11 (20.89 to 21.86 kg C m−2), T7 (14.96 to 14.13 kg C m−2), and T8 (13.08 to 12.35 kg C m−2). Archived samples exposed that decomposition degree of SOC under T5, T8, and T7 was 1.5 times greater, and significantly higher than that of R-W-S-R-WPLL with PLL (Table 7) and hence to evaluate the effect of applied treatments on SOC, previous year samples are certainly important [28].
Between 2009 and 2015, the average SOC in 0–1200 kg m−2 of soil (i.e., around 1 m soil depth) in T8 treatments declined by −1.97+0.06 kg m−2, from 13.08 to 12.35 kg C m−2. SOC stocks in 0–1200 kg m−2 of soil grew by +1.98 kg m−2 (i.e., from 22.33 to 14.13 kg m−2) in T5 (i.e., from 22.33 to 24.31 kg m−2) and +0.83 ± 0.3 kg m−2 in T7 (i.e., from 14.96 to 14.13 kg m−2) in T5 (i.e., from 22.33 to 24.31 kg m−2. Between 2009 and 2015, C was removed from the soil rather than absorbed from the environment in the TLL treatments.
7. SOC and Tillage Practices
Under T7, SOC in the first 400 kg m−2 soil (about the top 30 cm) had higher profile than under T5. While SOC stocks were higher (+10%) in precision land levelling (T5) than in T7, they were marginally lower (−5.6%) and (−1.8 %) in T8 than in T6, respectively (Table 2). SOC stocks, on the other hand, were consistently lower under T12 than they were under T5 or T7. (Table 3). There were no significant variations in SOC stocks between T7 and T12 when the 0–400 kg of soil m−2 under R-M-S-R-W and R-P-S-R-W with or without land levelling was investigated, whereas T12 had 16% less SOC (Table 3). T12’s soil disturbance in the top 400 kg of soil m−2 may have accelerated the rate of SOC loss compared to T11.
Traditional field levelling has been shown to destabilize aggregates, lowering physical protection and exposing previously inaccessible SOC to microbial destruction [29]. When compared to archival soil samples, six years of treatment demonstrated a decrease in SOC stocks in the first 400 kg of soil m−2 for all TLL treatments (Table 3). This shows that six years were insufficient to produce detectable differences in SOC across the T7, T5, and T11 plots. Long-term studies are necessary to determine the differences in the effect of management practices, according to several studies [30][31]. Given the high SOC background in the entire soil profile and small annual changes, long-term studies are essential to determine differences in the effect of management practices. When SOC stocks were examined over time in the soil layer immediately below the plough layer (400–800 kg m−2), it was clear that during the period between soil samplings (2009–2015), SOC levels had fallen significantly under T8 plots while remaining virtually unaltered under T7 or T5 plots (Table 3). Under T7 and T5, there was no difference in SOC stocks between 2009 and 2015. (Table 2). Under R-M-S-R-WTLL (T8), the yearly rate of SOC loss in the 400–800 kg of soil m−2 interval was −6.9 g C m−2 year−1, while the rate of SOC change in the T1 and T5 plots was +7.1 and +8.8 g C m−2 year−1, respectively (Table 3). SOC stocks under T1 and T5 were assumed unaffected by land levelling at this soil mass interval due to the estimation error. As a result, compared to T1 or less intrusive PLL as T5 cropping system, significant soil disturbance with T8 could have resulted in a quick rise in soil aeration (as well as changes in soil temperature and moisture) at larger depths. SOM decomposition would be accelerated if exposed to higher oxidative conditions at deep [32], and this could be the source of SOC depletion at the 400–800 kg of soil m−2 interval in T8 plots. SOC was unaffected by management techniques in the 800–1200 kg of soil m−2 interval (about 60–90 cm) and remained constant under all of the examined treatments, as expected (Table 3).
Finally, there were differences across tillage treatments when evaluating soil C changes in the entire 1200 kg of soil m−2 (about 90 cm depth) in 2009, but they grew wider to become significant in 2015. Over the last 06 years of the trial, soil C stocks increased by 4.4, 5.1, 5.7, and 7.2, 0.74, 0.76, 0.97, and 1.98 kg C m−2 under T1, T9, T3, and T5 treatments, respectively (Table 2). T8 twice the rate of SOC change under T9 or T5, 57.4, 63.3, 82.1, and 99.2 g C m−2 year−1, respectively, assuming a constant rate of change in SOC stocks for the last 06 years (Table 3). Despite the observed differences between treatments, the differences were statistically significant when C changes for each treatment were evaluated over time (Table 3).
After six years, more SOC stores were discovered in the surface 400 kg of soil m−2 under T9 or T5 compared to T8. T8 lost more SOC than T9 or T5 with PLL, despite the fact that the temporal difference was not judged significant. Given the parameters of this experiment, it is likely that more than 06 years will be necessary to identify variations between the examined cropping systems and land levelling procedures in the surface 400 kg of soil m−2 (approx. 30 cm). SOC stores in the 400–800 kg soil m−2 range were found to diminish after only 06 years under T8, but remained constant under T9 and T5. Leveling choices have no effect on SOC stores in the 800–1200 kg of soil m−2 range. Comparison between old and fresh soil samples revealed that higher fraction of carbon was recorded in the T9 and T5 plots where PLL followed than T8 plots where TLL was practiced. Further, plots under TLL with time lost the SOC. The yearly SOC change rate (g of cm−2 year−1) under both alternative cropping systems and precision land leveling practices indicated that rice-black gram-autumn sugarcane-ratoon sugarcane-wheat, maize-autumn sugarcane-ratoon sugarcane-wheat, rice-potato-spring sugarcane-ratoon sugarcane-wheat, rice-mustard-spring sugarcane-ratoon sugarcane-wheat, rice-pea-spring sugarcane-ratoon sugarcane-wheat, and rice-wheat-late spring sugarcane-ratoon sugarcane-wheat under precision laser leveling showed the positive SOC than traditional laser leveling (Figure 2)
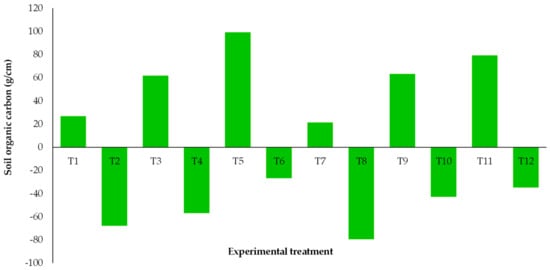
Figure 2. Yearly SOC change rate (g of cm−2 year−1) under alternative cropping systems and precision land leveling practices.
8. Future
Cropping systems that used PLL had higher total SOC stocks compared to their counterparts with TLL which might be due to inherent low C status of the experimental site. Under R-P-S-R-WPLL, M-S-R-WPLL, R-M-S-R-WPLL, and R-B-S-R-WPLL plots, SOC concentrations and storage were maximum in the upper 0.3 m soil depth. The active C and N pools in the conventional rice-wheat-sugarcane cropping system decreased as system productivity grew with the addition of P to N, and then increased even more with the addition of N, P, and K. In a cropping system, the administration of N fertilizer at the recommended dose to each crop is suggested, as is the careful adjustment of P fertilizer doses, taking into account the type of fertilizer, soil features and yield levels, the extent of P removal, and the growing environment. The active C and N pools in the conventional rice-wheat-sugarcane cropping system decreased as system productivity grew with the addition of P to N, and increased even more with the addition of N, P, and K. In a cropping system, the administration of N fertilizer at the required dose to each crop is suggested, as is the careful adjustment of P fertilizer dose, taking into account the type of fertilizer, soil features and yield levels, the extent of P removal, and the growing environment. Relative to conventional TLL practices, PLL improves carbon sequestration, cropping system energy requirements, water productivity, and system productivity and profitability.
References
- Samui, R.A. Critical Evaluation of sugarcane yield variation as influenced by climatic parameters in Uttar Pradesh and Maharashtra states. Time J. Agric. Vet. Sci. 2014, 2, 63–69.
- Indian Institute of Sugarcane Research. Vision 2030; Indian Institute of Sugarcane Research: Lucknow, India, 2011; pp. 1–28.
- Department of Sugar Industries and Cane Development. Sugar Policy—A Vision Becomes Reality: Engaging Partnership; Department of Sugar Industries and Cane Development: Uttar Pradesh, India, 2013; pp. 1–31.
- DSD (Directorate of Sugarcane Development). Staus Paper on Sugarcane, Directorate of Sugarcane Development; Ministry of Agriculture: Lucknow, India, 2013; pp. 1–16.
- Samui, R.P.; John, G.; Kulkarni, M.B. Impact of weather on yield of sugarcane at different growth stages. J. Agric. Phys. 2003, 3, 119–125.
- Jastrow, J.; Miller, R.; Lussenhop, J. Contributions of interacting biological mechanisms to soil aggregate stabilization in restored prairie. Soil Biol. Biochem. 1998, 30, 905–916.
- Carter, M.R. Analysis of soil organic matter storage in agro-ecosystems. In Structure and Organic Matter Storage in Agricultural Soils; Carter, M.R., Stewart, B.A., Eds.; CRC/Lewis Publishers: Boca Raton, FL, USA, 1996; Volume 25, pp. 3–11.
- Debasish, S.; Kukal, S.S.; Sharma, S. Land use impacts on SOC fractions and aggregate stability in typic ustochrepts of Northwest India. Plant Soil 2011, 339, 457–470.
- Belay-Tedla, A.; Zhou, X.; Su, B.; Wan, S.; Luo, Y. Labile, recalcitrant and microbial carbon and nitrogen pools of a tall grass prairie soil in the US Great Plains subjected to experimental warming and clipping. Soil Biol. Biochem. 2009, 41, 110–116.
- Maharning, A.; Mills, A.A.; Adl, S.M. Soil community changes during secondary succession to naturalized grasslands. Appl. Soil Ecol. 2009, 41, 137–147.
- Kumar, R.; Rawat, K.S.; Singh, J.; Singh, A.; Rai, A. Soil aggregation dynamics and carbon sequestration. J. Appl. Nat. Sci. 2013, 5, 250–267.
- Singh, R.K.; Bohra, J.S.; Nath, T.; Singh, Y.; Singh, K. Integrated assessment of diversification of rice-wheat cropping system in Indo-Gangetic plain. Arch. Agron. Soil Sci. 2011, 57, 489–506.
- Bhatt, R.; Sharma, M. Laser Leveller for Precision Land Levelling for Judicious Use of Water in Punjab; Extension Bulletin, Krishi Vigyan Kendra, Kapurthala; Punjab Agricultural University: Ludhiana, India, 2009; pp. 1–10.
- Naresh, R.K.; Singh, S.P.; Misra, A.K.; Tomar, S.S.; Kumar, P.; Kumar, V.; Kumar, S. Evaluation of the laser leveled land leveling technology on crop yield and water use productivity in Western Uttar Pradesh. Afr. J. Agric. Res. 2014, 9, 473–478.
- Banik, P.; Sharma, R.C. Effect of organic and inorganic sources of nutrients on the winter crops-rice cropping system in sub-humid tropics of India. Arch. Agron. Soil Sci. 2009, 55, 285–294.
- Singh, H.P.; Malhotra, S.K. Trend of horticultural research particularly vegetables in India and its regional prospects. In Proceedings of the Regional Symposium on High Value Vegetables in Southeast Asia—Production, Supply and Demand, AVRDC World Vegetable Centre, Chiang Mai, Taiwan, 24–26 January 2012; pp. 321–343.
- Choudhary, A.K.; Thakur, S.K.; Suri, V.K. Technology transfer model on integrated nutrient management technology for sustainable crop production in high value cash crops and vegetables in north western Himalayas. Commun. Soil Sci. Plant Anal. 2013, 44, 1684–1699.
- Bohra, J.S.; Singh, R.K.; Singh, U.N.; Singh, K.; Singh, R.P. Effect of crop diversification in rice-wheat cropping system on productivity, economics, land use and energy use efficiency under irrigated ecosystem of Varanasi. Oryza 2007, 44, 320–324.
- Rathore, S.S.; Shekhawat, K.; Rajanna, G.A.; Upadhyayand, P.K.; Singh, V.K. Crop Diversification for Resilience in Agriculture and Doubling Farmers’ Income; ICAR—Indian Agricultural Research Institute (IARI) Pusa: New Delhi, India, 2019; p. 210.
- Singh, R.P.; Das, S.K.; Bhaskara, R.V.M.; Narayana Reddy, M. Towards Sustainable Dryland Agricultural Practices; Central Research Institute for Dryland Agriculture: Hyderabad, India, 1990; pp. 5–8.
- Sharma, B.R. Efficient conservation and management of water resources for sustainable agriculture. Ind. Farming. 2002, 52, 66–70.
- Gangwar, B.; Baldev, R. Diversification opportunities in rice-wheat cropping. In Alternative Farming System; Singh, K., Gangwar, B., Sharma, S.K., Eds.; FSRDA, PDCSR: Modipuram, Meerut, India, 2005; pp. 154–162.
- Chandrappa, H.; Prabhakara, B.N.; Mallikarjuna, G.B.; Denesh, G.R. Identification of efficient, employment generative and profitable cropping systems for southern transitional zone of Karnataka. Indian Agric. Sci. 2005, 75, 490–492.
- Bastia, D.K.; Garnayak, L.M.; Barik, T.K. Diversification of rice (Oryza sativa) wheat (Triticum aestivum) based cropping systems for higher productivity, resource use efficiency and economics. Indian J. Agron. 2008, 53, 22–26.
- Sharma, A.K.; Thakur, N.P.; Koushal, S.; Kachroo, D. Profitable and energy efficient rice-based cropping system under subtropical irrigated conditions of Jammu. In Proceedings of the Extended summaries 3rd National Symposium on Integrated Farming Systems, Jaipur, India, 26–28 October 2007.
- Lorenz, K.; Lal, R. The Depth Distribution of Soil Organic Carbon in Relation to Land Use and Management and the Potential of Carbon Sequestration in Subsoil Horizons. Adv. Agron. 2005, 88, 35–66.
- Potter, K.N. Soil carbon content after 55 years of management of a Vertisol in central Texas. J. Soil Water Conserve 2006, 61, 358–363.
- Six, J.; Bossuyt, H.; Degryze, S.; Denef, K. A history of research on the link between (micro) aggregates, soil biota, and soil organic matter dynamics. Soil Tillage Res. 2004, 79, 7–31.
- Vanden Bygaart, A.J.; Angers, D.A. Towards accurate measurements of soil organic carbon stock change in agro-ecosystems. Can. J. Soil Sci. 2006, 86, 465–471.
- Baker, J.M.; Ochsner, T.E.; Ventura, R.T.; Griffis, T.J. Tillage and soil carbon sequestration—What do we really know? Agric. Ecosyst. Environ. 2007, 118, 1–5.
- Halvorson, A.D.; Weinhold, B.J.; Black, A.L. Tillage, nitrogen, and cropping system effects on soil carbon sequestration. Soil Sci. Soc. Am. J. 2002, 66, 906–912.
More
Information
Subjects:
Agronomy
Contributors
MDPI registered users' name will be linked to their SciProfiles pages. To register with us, please refer to https://encyclopedia.pub/register
:
View Times:
667
Revisions:
2 times
(View History)
Update Date:
20 Feb 2023
Table of Contents


Notice
You are not a member of the advisory board for this topic. If you want to update advisory board member profile, please contact office@encyclopedia.pub.
OK
Confirm
Only members of the Encyclopedia advisory board for this topic are allowed to note entries. Would you like to become an advisory board member of the Encyclopedia?
Yes
No
${ textCharacter }/${ maxCharacter }
Submit
Cancel
Back
Comments
${ item }
|
${ item.createdUser.fullName }
${ item.createdAt }
${ item.vote }
${ item.reply }
Delete
${ reply.createdUser.fullName }
${ reply.createdAt }
${ reply.vote }
Delete
There is no reply to this comment~
${ item.replyTextCharacter }/${ item.replyMaxCharacter }
Submit
Cancel
More
No more~
There is no comment~
${ textCharacter }/${ maxCharacter }
Submit
Cancel
${ selectedItem.replyTextCharacter }/${ selectedItem.replyMaxCharacter }
Submit
Cancel
Confirm
Are you sure to Delete?
Yes
No