 +1 credit
| Version | Summary | Created by | Modification | Content Size | Created at | Operation |
|---|---|---|---|---|---|---|
| 1 | Camila Xu | -- | 1323 | 2022-11-03 01:33:30 |
Video Upload Options
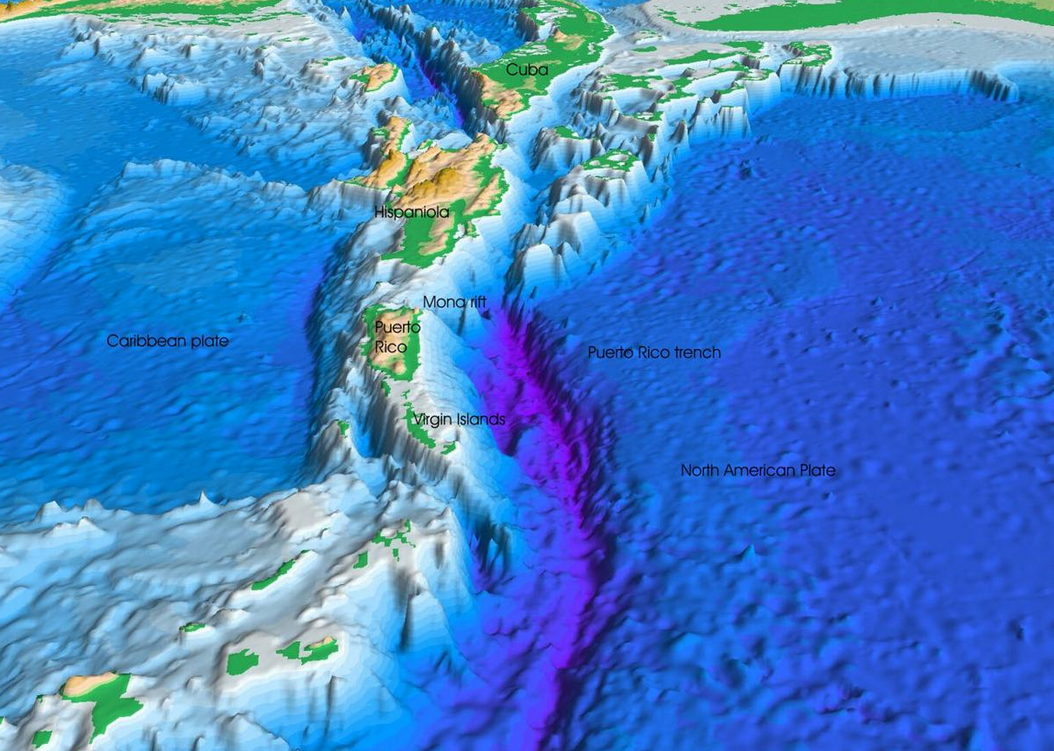
A bathymetric chart is a type of isarithmic map that depicts the submerged topography and physiographic features of ocean and sea bottoms. Their primary purpose is to provide detailed depth contours of ocean topography as well as provide the size, shape and distribution of underwater features. Topographic maps display elevation above ground and are complementary to bathymetric charts. Charts use a series of lines and points at equal intervals to showcase depth or elevation. A closed shape with increasingly smaller shapes inside of it can indicate an ocean trench or a seamount, or underwater mountain, depending on whether the depths increase or decrease going inward.Bathymetric surveys and charts are associated with the science of oceanography, particularly marine geology, and underwater engineering or other specialized purposes. thumb|Bathymetric Map of Medicine Lake, CABathymetric data used to produce charts can also be converted to bathymetric profiles which are vertical sections through a feature.thumb|right|Bathymetric chart of Bear Lake
1. History
1.1. Ancient Egypt
The use of bathymetry and the development of bathymetric charts dates back around the 19th century BC to ancient Egypt. Depictions on tomb walls such as the bas-relief carvings of Deir al-Bahri commissioned by Queen Hatshepsut in the 16th century BC show ancient mariners using long slender poles as sounding poles to determine the depth of the Nile River and into the Nile River Delta.[1]
1.2. Ancient Greece
The first written account and mapped records of sounding did not occur until 1000 years after the Egyptians had begun sounding and mapping the Nile. The Greek historian Herodotus writes of a sounding in 66 feet of water of the mouth of the Nile in the river delta. He writes of yellow mud being brought up similar to the same that was deposited with the yearly floods.[2] These accounts show a heightened awareness of regional depths and seafloor characteristics among ancient mariners and demonstrate that discoveries in bathymetry and the use of bathymetric charts had progressed significantly.
1.3. Ancient Rome
The New Testament recounts soundings being taken with the shipwreck of Paul on the island of Malta in the Book of Acts. Chapter 27, verses 27-44[3] recount the experience:
27 "...as we were driven up and down in Adria, about midnight the shipmen deemed that they drew near to some country;"
28 "And sounded, and found it twenty fathoms: and when they had gone a little further, they sounded again, and found it fifteen fathoms."
29 "Then fearing lest we should have fallen upon rocks, they cast four anchors out of the stern..."
39 "And when it was day, they knew not the land..."
40 "And when they had taken up the anchors, they committed themselves unto the sea . . . and made toward shore."
41 And falling into a place where two seas met, they ran the ship aground; and the forepart stuck fast, and remained unmoveable, but the hinder part was broken with the violence of the waves.
Verse 39 states that "they knew not the land" indicating that their knowledge of sea was obtained from the experiences of others as well as the memory of having been there before. Sailing directions called a periplus did exist by the First Century A.D. giving general coastal configurations. Commercially available charts of the depths of the sea and surrounding coast would not be available for almost another thousand years.
1.4. Early Modern Period
Up to this point, bathymetric charts were rare as mariners continued to rely on heavy ropes and lead weights to take depth readings and chart the open ocean. Minor advances in the surveying and depth charting of the oceans occurred in the 200 years since Columbus sailed to the Americas. In 1647, Robert Dudley published the atlas, 'Dell'Arcano del Mare' (Secrets of the Sea). His work far outpaced anything that had been published previously with maps and charts constructed in the Mercator projection as well as containing some of the first charts to show printed depths on the North American Atlantic Seaboard. His publication provided the groundwork for future mariners and inventors to continue to develop new and inventive ways to produce high quality charts and surveys of the world's lakes and oceans.
2. Comparison with Hydrographic Chart
A bathymetric chart differs from a hydrographic chart in that accurate presentation of the underwater features is the goal, while safe navigation is the requirement for the hydrographic chart.
A hydrographic chart will obscure the actual features to present a simplified version to help mariners avoid underwater hazards.
3. Joining a Bathymetric Chart and Topographic Map
In an ideal case, the joining of a bathymetric chart and topographic map of the same scale and projection of the same geographic area would be seamless. The only difference would be that the values begin increasing after crossing the zero at the designated sea level datum. Thus the topographic map's mountains have the greatest values while the bathymetric chart's greatest depths have the greatest values.
Simply put, the bathymetric chart is intended to show the land if overlying waters were removed in exactly the same manner as the topographic map.
4. Within Hydrography
Bathymetric surveys are a subset of the science of hydrography. They differ slightly from the surveys required to create the product of hydrography in its more limited application and as conducted by the national and international agencies tasked with producing charts and publications for safe navigation. That chart product is more accurately termed a navigation or hydrographic chart with a strong bias toward the presentation of essential safety information.
5. Bathymetric Surveys
Originally, bathymetry involved the measurement of ocean depth through depth sounding. Early techniques used weighted rope or cable lowered over a ship's side.[4] This technique measures the depth at one point at a time, and is therefore inefficient. It is also subject to movements of the ship and currents moving the line out of true and stretch of the line, therefore is not accurate.
The data used to make bathymetric maps typically comes from an echosounder (sonar) mounted beneath or over the side of a boat, "pinging" a beam of sound downward at the seafloor or from remote sensing LIDAR or LADAR systems.[5] The time it takes for the sound or light to travel through the water, bounce off the seafloor, and return to the transducer is proportional to the distance to the seafloor. LIDAR/LADAR surveys are usually conducted by airborne systems.
Since the early 1930s, single-beam sounders were used to make bathymetry maps. More recently multibeam echosounders (MBES) are typically used, which use hundreds of very narrow adjacent beams arranged in a fan-like swath of typically 90 to 170 degrees across. The tightly packed array of narrow individual beams provides very high angular resolution. The width of the swath is depth dependent, and allows a boat to map more seafloor per transect than a single-beam echosounder by making fewer passes. The beams update many times per second (typically 0.1–50 Hz depending on water depth), allowing faster boat speed while maintaining high coverage of the seafloor. Attitude sensors provide data for the correction of the boat's roll and pitch, and a gyrocompass provides accurate heading information to correct for vessel yaw. A Global Navigation Satellite System (GNSS)) positions the soundings with respect to the surface of the earth. Sound speed profiles (speed of sound in water as a function of depth) of the water column correct for refraction or "ray-bending" of the sound waves owing to non-uniform water column characteristics such as temperature, conductivity, and pressure. A computer system processes all the data, correcting for all of the above factors as well as for the angle of each individual beam. The resulting sounding measurements are then processed to produce a map.
Satellites are also used to measure bathymetry. Satellite radar maps deep-sea topography by detecting the subtle variations in sea level caused by the gravitational pull of undersea mountains, ridges, and other masses. On average, sea level is higher over mountains and ridges than over abyssal plains and trenches.[6]
References
- Hamden, Mohammad Hanif; Md Din, Ami Hassan (2018-07-31). "A review of advancement of hydrographic surveying towards ellipsoidal referenced surveying technique" (in en). IOP Conference Series: Earth and Environmental Science 169 (1): 012019. doi:10.1088/1755-1315/169/1/012019. ISSN 1755-1315. https://dx.doi.org/10.1088%2F1755-1315%2F169%2F1%2F012019
- "NOAA History - Tools of the Trade/Surveying and Mapping/Sounding Pole to Sea Beam". https://www.history.noaa.gov/stories_tales/poletobeam.html.
- "Acts 27". https://www.churchofjesuschrist.org/study/scriptures/nt/acts/27?lang=eng.
- Audrey, Furlong (November 7, 2018). "NGA Explains: What is hydrography?". National Geospatial-Intelligence Agency via YouTube. https://www.youtube.com/watch?v=gtKMrMy6arw.
- Olsen, R. C. (2007), Remote Sensing from Air and Space, SPIE, ISBN 978-0-8194-6235-0
- Thurman, H. V. (1997), Introductory Oceanography, New Jersey, USA: Prentice Hall College, ISBN 0-13-262072-3


