 +1 credit
| Version | Summary | Created by | Modification | Content Size | Created at | Operation |
|---|---|---|---|---|---|---|
| 1 | Javier Martin | + 4313 word(s) | 4313 | 2020-10-14 08:32:08 | | | |
| 2 | Rita Xu | -1510 word(s) | 2803 | 2020-10-22 03:01:51 | | |
Video Upload Options
We have shown that environmental surveillance can be used to monitor SARS-CoV-2 transmission detecting virus variants specifically circulating in England and identifying changes in virus variant predominance known to have occurred during the COVID-19 epidemic. It is hoped that environmental surveillance can be used for the early detection of peaks in virus transmission for public health interventions to be timely implemented.
1. Introduction
A global pandemic of coronavirus disease (COVID-19) caused by a new betacoronavirus named Severe Acute Respiratory Syndrome Coronavirus 2 (SARS-CoV-2) is currently ongoing [1]. The outbreak was first detected in Wuhan (China) in December 2019 and spread rapidly to 213 countries/territories with 33.50 million confirmed cases and 1,004,421 deaths as of 30th September 2020 [2]. While the majority of infections result in no apparent symptoms or mild ones, some progress to acute respiratory disease, multi-organ failure, and death [3]. Respiratory transmission is the primary route for SARS-CoV-2 infection although faecal–oral transmission is possible as high levels of viral RNA have been detected in stool samples of a proportion of infected individuals [4]. Studies have shown that viral RNA of titres up to 8.0 Log10 genome copies (gc)/gram of faeces can be detected in stools of infected people for prolonged periods of time, long after the virus is no longer detected in respiratory samples [5][6][7][8]. Correspondingly, SARS-CoV-2 RNA has been found in wastewater samples in some countries with viral RNA loads ranging between 2.0 and 6.0 Log10 gc/L of sewage and generally a good correlation between RNA levels and numbers of COVID-19 confirmed cases [9][10][11][12][13][14][15][16][17][18].
SARS-CoV-2 has spread very rapidly in the population resulting in a high number of people requiring hospitalization. Consequently, many countries have been forced to implement severe lockdown measures to ensure physical distance between people and interrupt virus transmission [19][20][21][22]. These measures have largely reduced the number of confirmed cases in several countries, but outbreaks are emerging in some areas following the ease of lockdown measures [23]. As a large proportion of the population appears to remain susceptible for SARS-CoV-2 infection [24][25][26][27], the risk of new waves of infection is high. Four successive waves were observed during the global 1918 influenza pandemic, which lasted from February 1918 to April 1920 infecting an estimated 500 million people and causing between 17 and 50 million deaths [28]. As with the influenza pandemic, the quality and length of lockdown measures will determine its effectiveness in reducing deaths and future peaks of COVID-19 disease [29]. In this context, monitoring virus spread and understanding virus transmission patterns becomes critical. In a situation in which a high proportion of asymptomatic infected individuals occurs, with potential to silently spread the disease, environmental surveillance (ES) could prove to be a very useful tool to track virus circulation. A good example is poliovirus as ES has been shown to be a very sensitive method to detect poliovirus circulation [30], even in the absence of reported paralytic polio cases [31], and has helped tracing the elimination of wild and vaccine poliovirus in some areas largely contributing to global polio eradication efforts. Although there is some evidence of the early detection of viral RNA in sewage even before COVID-19 cases had been reported [10][11][32], it still remains to be determined how well virus found in sewage represents virus circulating in humans and whether ES can help in the early detection of peaks in virus transmission for a public response to be timely effective.
Apart from establishing an alert system for virus detection by ES, phylogenetic analysis of viral RNA found in sewage [14][16] can also help in understanding virus transmission patterns, tracing virus variants, and detecting virus importations. Analysis of SARS-CoV-2 RNA nucleotide sequences from clinical samples reveals some level of genetic variation including non-synonymous changes observed during the COVID-19 pandemic [33][34][35][36][37][38][39][40][41]. This includes a relevant virus variant containing an amino acid change from aspartate (D) to glycine (G) at residue 614 in the SARS-CoV-2 spike (S) protein, responsible for virus attachment to the Angiotensin-converting enzyme 2 (ACE2) receptor on host cells and subsequent cell entry. This virus, named the G614 variant, has become the dominant pandemic form globally although its biological significance is still not clear [42].
With the above scientific information in mind, we aimed at investigating whether we could detect the presence of SARS-CoV-2 in wastewater samples from England (United Kingdom) using standard real-time quantitative reverse transcription-polymerase chain reaction (RTqPCR) assays as reported in different countries. Raw inlet sewage samples collected between 14th January and 12th May 2020 were analysed. In addition, nested reverse transcription-polymerase chain reaction (nPCR) assays specifically targeting SARS-CoV-2 sequences were designed to complement the RTqPCR assays and provide nucleotide sequence information to confirm the association between viral sequences found in clinical samples and those found in sewage. This could eventually help to improve the predicting value of ES for SARS-CoV-2 detection.
2. Detection of SARS-CoV-2 RNA in Wastewater Samples
Following concentration of raw sewage as described in Section 2.1, we tested a minimum of five replicate RNA samples from at least two independent wastewater concentration processes for each sample. Further replicate RNAs were tested for positive samples to obtain more accurate viral RNA quantification. SARS-CoV-2 RNA in wastewater samples was quantified using a real-time quantitative polymerase chain reaction (RTqPCR) assay targeting the RNA-dependent RNA Polymerase (RdRP) gene. A second RTqPCR assay targeting the envelope protein (E) gene was used for confirmation. The E-gene RTqPCR assay was less sensitive and accurate as the limit of quantitation (LOQ) was higher. The LOQ was 32 genome copies of SARS-CoV-2 RNA per reaction for the RdRP-gene assay and 160 genome copies per reaction for the E-gene assay as found using RNA extracted from the NIBSC virus reagent 19/304. These LOQ values correspond to 3.50 and 4.20 Log10 gc/L of sewage, respectively, when maximum concentration is achieved. As shown in Table 1, positive RTqPCR signals were obtained for the samples from March, April, and May.
Table 1. Detection of Severe Acute Respiratory Syndrome Coronavirus 2 (SARS-CoV-2) viral RNA in wastewater concentrates by RTqPCR and nPCR.
|
|
SARS-CoV-2 RTqPCR (No. of replicates) 1 |
Nested RT-PCR Gene Target (PCR Product Size) 2 |
Genome Sequenced (No. of nucleotides) |
|||||||
|
Sampling Date |
RdRP Gene (log10 gc/L sewage) |
E Gene (log10 gc/L sewage) |
nsp2-PLPro Gene nPCR1 (714 nt) |
RdRP Gene nPCR2 (523 nt) |
RdRP Gene nPCR3 (527 nt) |
RdRP Gene nPCR4 (235 nt) |
ORF8b-N Gene nPCR5 (612 nt) |
|||
|
14-Jan-20 |
- |
- |
- |
- |
- |
- |
- |
- |
||
|
11-Feb-20 |
- |
- |
- |
- |
- |
+ |
+ |
847 |
||
|
11-Mar-20 |
4.84 ± 0.45 [4.18–5.52] (n = 10) |
4.98 ± 0.40 [4.63–5.41] (n = 3) |
+ |
+ |
+ |
+ |
+ |
2376 |
||
|
14-Apr-20 |
5.27 ± 0.30 [4.77–5.91] (n = 11) |
5.78 ± 0.07 [5.71–5.84] (n = 3) |
+ |
+ |
+ |
+ |
+ |
2376 |
||
|
12-May-20 |
<3.5 (n = 11) 3 |
- |
+ |
+ |
+ |
+ |
+ |
2376 |
||
Wastewater samples were concentrated using a standard filtration–centrifugation method (concentration factor: 20–60×).1 Mean values of log10 SARS-CoV-2 genome copy (SC2 gc)/L wastewater with standard deviations are shown. 2 Dark grey indicates positive in at least 1/5 replicate nPCR reactions. Light grey indicates positive only after additional concentration (up to 500×). Positive PCR results were obtained for Feb–May samples in at least two independent concentration processes for at least two different gene targets. The January sample remained negative even after a second concentration step.3 Only 3/11 replicates gave positive RTqPCR signals with RdRP target, so viral RNA quantification was not possible.
The sample from May was only positive in 3 out of 11 replicate assays with the RdRP-gene reaction and in none of the reactions with E-gene primers, so accurate quantification of viral RNA in this sample was not possible. However, it was clear that there was a large reduction of SARS-CoV-2 RNA concentration in sewage between 14th April and 12th May. Positive and negative results were independently confirmed using a second real-time PCR platform (Stratagene 3000P) in a different NIBSC laboratory (data not shown). Integrity of process was confirmed through use of previous experience with enteroviruses. This was demonstrated both by detection of enteroviral RNA and recovery of infectious virus in cell cultures from all wastewater concentrates following WHO-recommended protocols as described in Materials and Methods.
3. Analysis of Nucleotide Sequence Variation among SARS-CoV-2 RNA Sequences from Clinical Samples
Details of the number of sequences analysed by date and country are given in Table S1. The frequency of sequence variation at each genomic nucleotide position was determined with respect to the reference Wuhan-Hu-1 strain (NCBI accession no. MN908947) for each dataset. Figure 1 shows nucleotide positions at which sequence variation in >1% of viral RNA sequences from England and the rest of the world were observed.
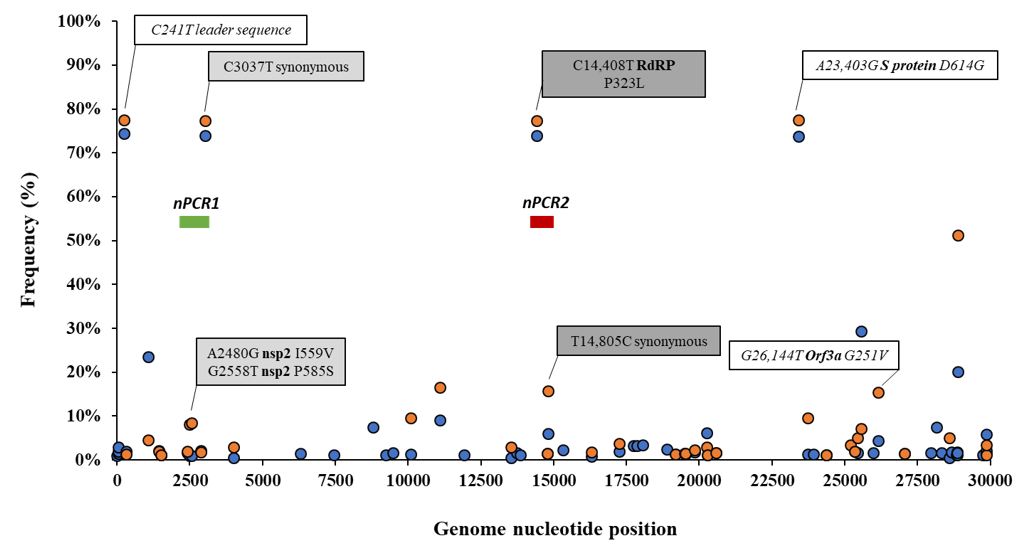
Figure 1. Analysis of nucleotide sequence variation among SARS-CoV-2 RNA sequences from clinical samples. Nucleotide positions at which sequence variation in >1% of viral RNA sequences from England (orange circles) or the rest of the world (blue circles) was observed are shown. Relevant nucleotide positions contained in nPCR1 (light grey shaded box) and nPCR2 (dark grey box) products are shown together with associated nucleotide variations (white boxes) observing very similar frequencies as expected. The genome locations of nPCR1 and nPCR2 products are shown in green and red boxes. The Wuhan-Hu-1 strain (NCBI accession no. MN908947) was used as reference. Whole-genome SARS-CoV-2 sequences used in this analysis were downloaded from the GISAID database [43].
Differences in nucleotide sequence frequencies at some of these common positions were noticeable indicating a different prevalence of some sequence variants between viral sequences in England and the rest of the world. We used this information to select genomic regions for our sequence analysis. Key nucleotide positions 2480, 2558, 3037, 14,408, and 14,805 were targeted in two nPCR products, nPCR1 and nPCR2. nPCR1 spans nucleotides 2344–3118 and nPCR2 covers nucleotides 14,342–14,913 (Figure S1). The nPCR1 product includes nucleotide variants A2480G and C2558T, which result in amino acid changes I559V and P585S in nsp2 protein and which are often associated between them. The nPCR1 product also includes nucleotide C3037T, which is almost always associated with nucleotide sequence variations C241T, C14408T, and A23403G; mapping in the leader sequence; RNA polymerase (P323L amino acid change); and Spike protein (D614G amino acid change), respectively. This virus variant containing these four nucleotide variations, named G614, has become the dominant pandemic virus around the world [42]. The nPCR2 product includes nucleotide variant C14408T, also part of the dominant G614 pandemic strain, and synonymous change T14805C often associated with variation G26144T, which results in amino acid change G251V in Orf3a protein. The frequency of T14805C is 15.8% in England versus 6.1 % in the rest of the world. Table S2 shows how nucleotide sequences at these selected five nucleotide positions most commonly combine in SARS-CoV-2 isolates. We also show in Figure 2 how the frequency of sequence variants at these five positions has changed during the pandemic in different countries/regions of the world.
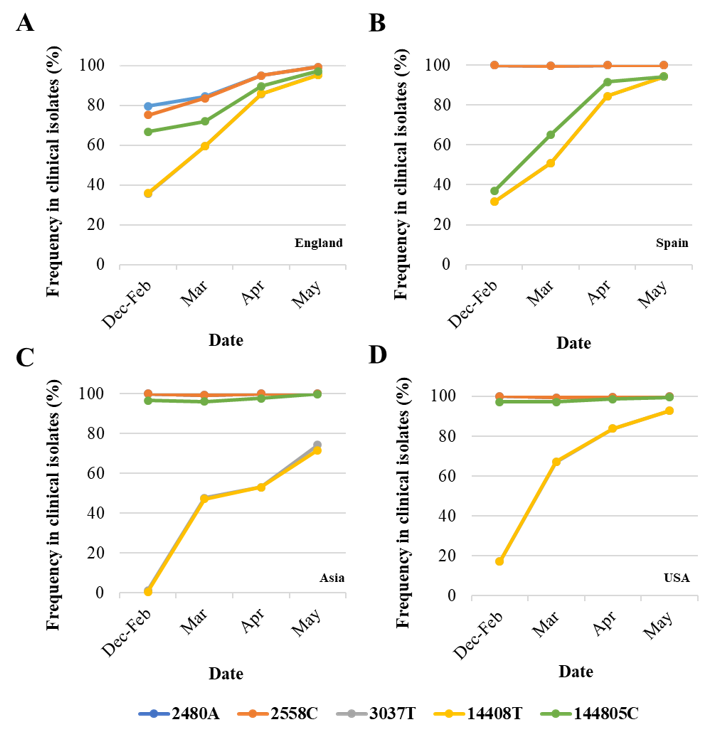
Figure 2. Changes in nucleotide sequence frequency at five selected SARS-CoV-2 genomic positions during the coronavirus disease (COVID-19) pandemic. The frequencies of 2480A (blue), 2558C (orange), 3037T (grey), 14408T (yellow), and 14805C (green) in England (A), Spain (B), Asia (C), and USA (D) are shown. Lines for nucleotides 2480 and 2554 and those for nucleotides 3037 and 14,408 mostly overlap as they correspond to associated sequence variations. Whole-genome SARS-CoV-2 sequences used in this analysis were downloaded from the GISAID database [43].
As can be noted, differences in sequence composition at these positions were notable between clinical samples from different countries/regions, likely reflecting differences in the circulation of different virus variants. Variants A2480G and C2558T were present in very low proportion in Spain, Asia, and USA as compared to the proportion in England. Variant C14480T was particularly prevalent in Spain and increase in the proportion of nucleotide variations characteristic of G614 pandemic variant was delayed in Asia with respect to the other regions analysed. Three additional nPCR assays were designed as described in Materials and Methods and section 3.3 below.
4. Generation of nPCR Products for Nucleotide Sequence Analyses
Five different RNA replicates from each wastewater concentrate were initially used to generate nPCR products with the different primer combinations shown in Figure S1. As shown in Table 1, positive RT-PCR products were obtained for all five nPCR reactions using RNA extracted from March, April, and May wastewater concentrates. The February wastewater concentrate only produced positive results with nPCR4 and nPCR5 reactions, and only after an additional concentration step to the standard 20–60× concentration procedure was performed (Table 1). The results obtained with nPCR reactions were in good agreement with those from RTqPCR assays as the proportion of positive nPCR reactions closely matched that of the viral RNA concentration values. nPCR assays allowed confirmation by Sanger sequencing and NGS analysis. For all positive samples, positive nPCR results were obtained for at least two different gene targets and from RNA extracted from at least two different independent wastewater concentration processes. nPCR positive reactions produced clean and clear bands following electrophoresis on agarose gels. None of the nPCR reactions with RNA from the wastewater sample collected on 14th January 2020 and none of the multiple RNA extraction and PCR reaction negative controls produced SARS-CoV-2 nPCR products. The RTqPCR and nPCR results are summarized in Figure 3 in the context of epidemiological data.
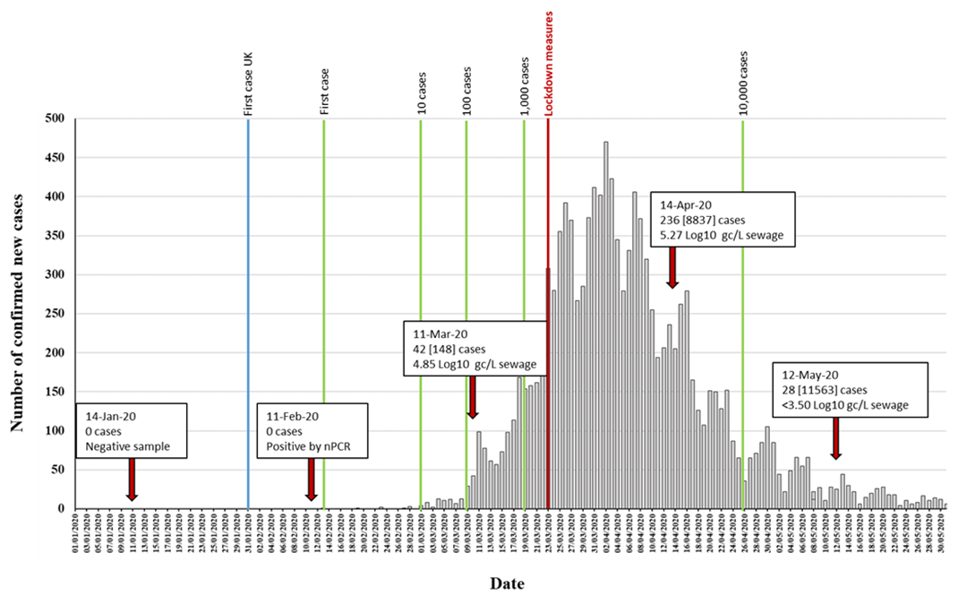
Figure 3. Detection of SARS-CoV-2 RNA in relation to COVID-19 confirmed cases. The number of daily reported new COVID-19 cases in the catchment area covered by the sewage plant is shown as grey columns. The time points at which 1, 10, 100, 1000, and 10,000 confirmed cases where reached in the area are indicated with green vertical lines. The blue vertical line indicates the time point of the first U.K. confirmed case, outside the sampling area. Environmental surveillance (ES) sampling time points are shown with red arrows. Data on SARS-CoV-2 viral RNA detection is shown in boxes. The number of daily new cases (with total accumulated cases in brackets) at each sampling date is shown. RTqPCR quantification results obtained with the RdRP reaction are shown. The time point at which lockdown measures were introduced is indicated in red. Source for COVID-19 cases data: https://coronavirus.data.gov.uk/.
5. Nucleotide Sequence Analysis of nPCR Products from Wastewater Concentrates
The amount of SARS-CoV-2 nucleotide sequences obtained by Sanger analysis for each sample is shown in Table 1 and ranged between 847 and 2376 nucleotides per wastewater concentrate. Sequences from several nPCR replicates were generated from each concentrate. Nucleotide sequences for nPCR3, nPCR4, and nPCR5 products for all samples were identical to those of the consensus sequence from clinical samples from England except for few nucleotide changes found in a few nPCR replicates. Nucleotide differences and mixed bases in sequence electropherograms were observed for nPCR1 and nPCR2 products from March and April at nucleotide positions where sequence variations had been observed between clinical samples in England as discussed above. The nPCR products were analysed by NGS with an aim to quantify the proportion of different nucleotides at mixed base positions. Between 82,000 and 200,000 filtered reads were sequenced per nPCR product with >99% of reads typically mapping to SARS-CoV-2 reference sequences. An example of the results for both Sanger and NGS analyses of nPCR1 products obtained with different RNA replicates from each sample are shown in Figure S2. NGS quantification results were in excellent agreement with those observed in Sanger sequence electropherograms although no mixed peaks were detected in Sanger sequences when the minor nucleotide component was below 20%, showing the inferior sensitivity of the Sanger sequence analysis. Differences in sequence composition were found between RNA replicates from samples from March and April reflecting the presence of virus mixtures in both samples, 15 replicate nPCR1 and nPCR2 products were sequenced from each sewage concentrate. Mean sequence frequency values at the five selected nucleotide positions for each month are shown in Figure 4.
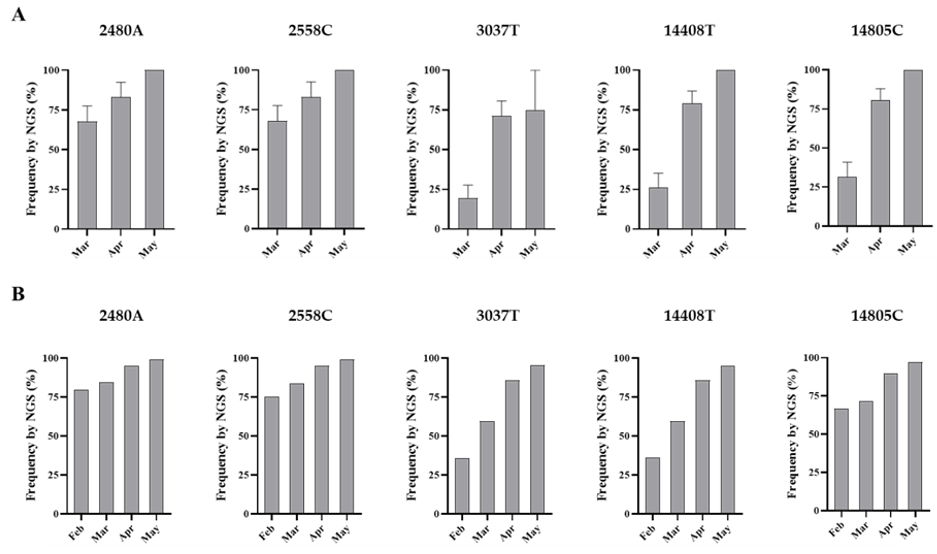
Figure 4. Nucleotide sequence variation at five selected genomic positions in SARS-CoV-2 RNA from wastewater concentrates. Comparison of mean sequence frequency values of nucleotides 2480A, 2558C, 3037T, 14408T, and 14805C found in nPCR1 and nPCR2 products (A) are shown and compared with mean sequence frequency values in clinical samples from England for the corresponding months (B). Error bars indicate standard error of the mean. Whole-genome SARS-CoV-2 sequences used in this analysis were downloaded from the GISAID database [43].
Overall, the nucleotide sequence composition at all five selected nucleotide positions changed between March and April. Viral RNA samples containing A2480G and C2558T nucleotide variations decreased between March and April. The proportion of T at positions 3037 and 14,408, genetic markers of the G614 dominant strain, increased between March and April. Finally, the predominant sequence at position 14,805 also switched from T in March to C in April. The same trend in sequence composition continued in May although a similar in-depth analysis was not possible since fewer replicate nPCRs were sequenced successfully. No mixed bases were identified by Sanger or NGS analysis in any of the nPCR products from the RNA samples from May. Sequence results from four nPCR1 replicates from the May sewage found an A at nucleotide 2480 and a C at residue 2558 in all four replicates and a T at position 3037 in 3/4 of the replicates in agreement with their predominance observed in April. A single nPCR2 product sequenced from May also contained the nucleotide sequences of G614 dominant strain at positions 14,408 and 14,805. Few additional sequence variations were identified in few PCR products, but none were present in more than one replicate.
References
- Zhou, P.; Yang, X.L.; Wang, X.G.; Hu, B.; Zhang, L.; Zhang, W.; Si, H.R.; Zhu, Y.; Li, B.; Huang, C.L.; et al. A pneumonia outbreak associated with a new coronavirus of probable bat origin. Nature 2020, 579, 270–273, doi:10.1038/s41586-020-2012-7.
- World Health Organization. Coronavirus disease (COVID-19) pandemic. Availabe online: https://www.who.int/emergencies/diseases/novel-coronavirus-2019 (accessed on 10 July2020).
- Huang, C.; Wang, Y.; Li, X.; Ren, L.; Zhao, J.; Hu, Y.; Zhang, L.; Fan, G.; Xu, J.; Gu, X.; et al. Clinical features of patients infected with 2019 novel coronavirus in Wuhan, China. Lancet 2020, 395, 497–506, doi:10.1016/S0140-6736(20)30183-5.
- Xu, Y.; Li, X.; Zhu, B.; Liang, H.; Fang, C.; Gong, Y.; Guo, Q.; Sun, X.; Zhao, D.; Shen, J.; et al. Characteristics of pediatric SARS-CoV-2 infection and potential evidence for persistent fecal viral shedding. Med. 2020, 26, 502–505, doi:10.1038/s41591-020-0817-4.
- Wu, Y.; Guo, C.; Tang, L.; Hong, Z.; Zhou, J.; Dong, X.; Yin, H.; Xiao, Q.; Tang, Y.; Qu, X.; et al. Prolonged presence of SARS-CoV-2 viral RNA in faecal samples. Lancet Gastroenterol Hepatol 2020, 5, 434–435, doi:10.1016/S2468-1253(20)30083-2.
- Zhang, N.; Gong, Y.; Meng, F.; Bi, Y.; Yang, P.; Wang, F. Virus shedding patterns in nasopharyngeal and fecal specimens of COVID-19 patients. medRxiv 2020, 10.1101/2020.03.28.20043059, 2020.2003.2028.20043059, doi:10.1101/2020.03.28.20043059.
- Wolfel, R.; Corman, V.M.; Guggemos, W.; Seilmaier, M.; Zange, S.; Muller, M.A.; Niemeyer, D.; Jones, T.C.; Vollmar, P.; Rothe, C.; et al. Virological assessment of hospitalized patients with COVID-2019. Nature 2020, 581, 465–469, doi:10.1038/s41586-020-2196-x.
- Lescure, F.X.; Bouadma, L.; Nguyen, D.; Parisey, M.; Wicky, P.H.; Behillil, S.; Gaymard, A.; Bouscambert-Duchamp, M.; Donati, F.; Le Hingrat, Q.; et al. Clinical and virological data of the first cases of COVID-19 in Europe: A case series. Lancet Infect. Dis. 2020, 20, 697–706, doi:10.1016/S1473-3099(20)30200-0.
- Ahmed, W.; Angel, N.; Edson, J.; Bibby, K.; Bivins, A.; O’Brien, J.W.; Choi, P.M.; Kitajima, M.; Simpson, S.L.; Li, J.; et al. First confirmed detection of SARS-CoV-2 in untreated wastewater in Australia: A proof of concept for the wastewater surveillance of COVID-19 in the community. Total Environ. 2020, 728, 138764, doi:10.1016/j.scitotenv.2020.138764.
- Wu, F.; Zhang, J.; Xiao, A.; Gu, X.; Lee, W.L.; Armas, F.; Kauffman, K.; Hanage, W.; Matus, M.; Ghaeli, N.; et al. SARS-CoV-2 Titers in Wastewater Are Higher than Expected from Clinically Confirmed Cases. mSystems 2020, 5, doi:10.1128/mSystems.00614-20.
- Randazzo, W.; Truchado, P.; Cuevas-Ferrando, E.; Simon, P.; Allende, A.; Sanchez, G. SARS-CoV-2 RNA in wastewater anticipated COVID-19 occurrence in a low prevalence area. Water Res. 2020, 181, 115942, doi:10.1016/j.watres.2020.115942.
- Wurtzer, S.; Marechal, V.; Mouchel, J.-M.; Maday, Y.; Teyssou, R.; Richard, E.; Almayrac, J.L.; Moulin, L. Evaluation of lockdown impact on SARS-CoV-2 dynamics through viral genome quantification in Paris wastewaters. medRxiv 2020, 10.1101/2020.04.12.20062679, 2020.2004.2012.20062679, doi:10.1101/2020.04.12.20062679.
- Medema, G.; Heijnen, L.; Elsinga, G.; Italiaander, R.; Brouwer, A. Presence of SARS-Coronavirus-2 in sewage. medRxiv 2020, 10.1101/2020.03.29.20045880, 2020.2003.2029.20045880, doi:10.1101/2020.03.29.20045880.
- La Rosa, G.; Iaconelli, M.; Mancini, P.; Bonanno Ferraro, G.; Veneri, C.; Bonadonna, L.; Lucentini, L.; Suffredini, E. First detection of SARS-CoV-2 in untreated wastewaters in Italy. Water Res. 2020, 736, doi:https://doi.org/10.1016/j.scitotenv.2020.139652.
- Lodder, W.; de Roda Husman, A.M. SARS-CoV-2 in wastewater: Potential health risk, but also data source. Lancet Gastroenterol Hepatol 2020, 5, 533–534, doi:10.1016/S2468-1253(20)30087-X.
- Nemudryi, A.; Nemudraia, A.; Wiegand, T.; Surya, K.; Buyukyoruk, M.; Cicha, C.; Vanderwood, K.K.; Wilkinson, R.; Wiedenheft, B. Temporal Detection and Phylogenetic Assessment of SARS-CoV-2 in Municipal Wastewater. Cell Rep. Med. 2020, 1, 100098, doi:10.1016/j.xcrm.2020.100098.
- Kitajima, M.; Ahmed, W.; Bibby, K.; Carducci, A.; Gerba, C.P.; Hamilton, K.A.; Haramoto, E.; Rose, J.B. SARS-CoV-2 in wastewater: State of the knowledge and research needs. Total Environ. 2020, 739, 139076, doi:10.1016/j.scitotenv.2020.139076.
- Foladori, P.; Cutrupi, F.; Segata, N.; Manara, S.; Pinto, F.; Malpei, F.; Bruni, L.; La Rosa, G. SARS-CoV-2 from faeces to wastewater treatment: What do we know? A review. Total Environ. 2020, 743, 140444, doi:10.1016/j.scitotenv.2020.140444.
- Flaxman, S.; Mishra, S.; Gandy, A.; Unwin, H.J.T.; Mellan, T.A.; Coupland, H.; Whittaker, C.; Zhu, H.; Berah, T.; Eaton, J.W.; et al. Estimating the effects of non-pharmaceutical interventions on COVID-19 in Europe. Nature 2020, 584, 257–261, doi:10.1038/s41586-020-2405-7.
- Walker, P.G.T.; Whittaker, C.; Watson, O.J.; Baguelin, M.; Winskill, P.; Hamlet, A.; Djafaara, B.A.; Cucunuba, Z.; Olivera Mesa, D.; Green, W.; et al. The impact of COVID-19 and strategies for mitigation and suppression in low- and middle-income countries. Science 2020, 369, 413–422, doi:10.1126/science.abc0035.
- Davies, N.G.; Kucharski, A.J.; Eggo, R.M.; Gimma, A.; Edmunds, W.J.; Centre for the Mathematical Modelling of Infectious Diseases, C.-w.g. Effects of non-pharmaceutical interventions on COVID-19 cases, deaths, and demand for hospital services in the UK: A modelling study. Lancet Public Health 2020, 5, e375–e385, doi:10.1016/S2468-2667(20)30133-X.
- Kucharski, A.J.; Klepac, P.; Conlan, A.J.K.; Kissler, S.M.; Tang, M.L.; Fry, H.; Gog, J.R.; Edmunds, W.J.; Group, C.C.-w. Effectiveness of isolation, testing, contact tracing, and physical distancing on reducing transmission of SARS-CoV-2 in different settings: A mathematical modelling study. Lancet Infect. Dis. 2020, 20, 1151–1160, doi:10.1016/S1473-3099(20)30457-6.
- European Centre for Disease Prevention and Control (ECDC). COVID-19 pandemic. Availabe online: https://www.ecdc.europa.eu/en/covid-19-pandemic (accessed on 20 September 2020).
- Pollan, M.; Perez-Gomez, B.; Pastor-Barriuso, R.; Oteo, J.; Hernan, M.A.; Perez-Olmeda, M.; Sanmartin, J.L.; Fernandez-Garcia, A.; Cruz, I.; Fernandez de Larrea, N.; et al. Prevalence of SARS-CoV-2 in Spain (ENE-COVID): A nationwide, population-based seroepidemiological study. Lancet 2020, 396, 535–544, doi:10.1016/S0140-6736(20)31483-5.
- Xu, X.; Sun, J.; Nie, S.; Li, H.; Kong, Y.; Liang, M.; Hou, J.; Huang, X.; Li, D.; Ma, T.; et al. Seroprevalence of immunoglobulin M and G antibodies against SARS-CoV-2 in China. Med. 2020, 26, 1193–1195, doi:10.1038/s41591-020-0949-6.
- Stringhini, S.; Wisniak, A.; Piumatti, G.; Azman, A.S.; Lauer, S.A.; Baysson, H.; De Ridder, D.; Petrovic, D.; Schrempft, S.; Marcus, K.; et al. Seroprevalence of anti-SARS-CoV-2 IgG antibodies in Geneva, Switzerland (SEROCoV-POP): A population-based study. Lancet 2020, 396, 313–319, doi:10.1016/S0140-6736(20)31304-0.
- Public Health England. Weekly Coronavirus Disease 2019 (COVID-19) Surveillance Report. Week: 22; 2020.
- Johnson, N.P.; Mueller, J. Updating the accounts: Global mortality of the 1918-1920 “Spanish” influenza pandemic. Hist Med. 2002, 76, 105–115, doi:10.1353/bhm.2002.0022.
- Bootsma, M.C.; Ferguson, N.M. The effect of public health measures on the 1918 influenza pandemic in U.S. cities. Natl. Acad. Sci. USA 2007, 104, 7588–7593, doi:10.1073/pnas.0611071104.
- Asghar, H.; Diop, O.M.; Weldegebriel, G.; Malik, F.; Shetty, S.; El Bassioni, L.; Akande, A.O.; Al Maamoun, E.; Zaidi, S.; Adeniji, A.J.; et al. Environmental surveillance for polioviruses in the Global Polio Eradication Initiative. Infect. Dis. 2014, 210, S294–S303, doi:10.1093/infdis/jiu384.
- Shulman, L.M.; Gavrilin, E.; Jorba, J.; Martin, J.; Burns, C.C.; Manor, Y.; Moran-Gilad, J.; Sofer, D.; Hindiyeh, M.Y.; Gamzu, R.; et al. Molecular epidemiology of silent introduction and sustained transmission of wild poliovirus type 1, Israel, 2013. Surveill 2014, 19, 20709.
- La Rosa, G.; Mancini, P.; Bonanno Ferraro, G.; Veneri, C.; Iaconelli, M.; Bonadonna, L.; Lucentini, L.; Suffredini, E. SARS-CoV-2 has been circulating in northern Italy since December 2019: Evidence from environmental monitoring. Total Environ. 2020, 750, 141711, doi:10.1016/j.scitotenv.2020.141711.
- MacLean, O.A.; Orton, R.J.; Singer, J.B.; Robertson, D.L. No evidence for distinct types in the evolution of SARS-CoV-2. Virus Evolution 2020, 6, doi:https://doi.org/10.1093/ve/veaa034.
- Tang, X.; Wu, C.; Li, X.; Song, Y.; Yao, X.; Wu, X.; Duan, Y.; Zhang, H.; Wang, Y.; Qian, Z.; et al. On the origin and continuing evolution of SARS-CoV-2. Sci. Rev. 2020, 7, 1012–1023, doi:https://doi.org/10.1093/nsr/nwaa036.
- van Dorp, L.; Acman, M.; Richard, D.; Shaw, L.P.; Ford, C.E.; Ormond, L.; Owen, C.J.; Pang, J.; Tan, C.C.S.; Boshier, F.A.T.; et al. Emergence of genomic diversity and recurrent mutations in SARS-CoV-2. Genet. Evol. 2020, 83, 104351, doi:10.1016/j.meegid.2020.104351.
- Yin, C. Genotyping coronavirus SARS-CoV-2: Methods and implications. Genomics 2020, 112, 3588–3596, doi:10.1016/j.ygeno.2020.04.016.
- Pachetti, M.; Marini, B.; Benedetti, F.; Giudici, F.; Mauro, E.; Storici, P.; Masciovecchio, C.; Angeletti, S.; Ciccozzi, M.; Gallo, R.C.; et al. Emerging SARS-CoV-2 mutation hot spots include a novel RNA-dependent-RNA polymerase variant. Transl. Med. 2020, 18, 179, doi:10.1186/s12967-020-02344-6.
- Wang, M.; Li, M.; Ren, R.; Li, L.; Chen, E.Q.; Li, W.; Ying, B. International Expansion of a Novel SARS-CoV-2 Mutant. Virol. 2020, 94, doi:10.1128/JVI.00567-20.
- Su, Y.C.; Anderson, D.E.; Young, B.E.; Zhu, F.; Linster, M.; Kalimuddin, S.; Low, J.G.; Yan, Z.; Jayakumar, J.; Sun, L.; et al. Discovery of a 382-nt deletion during the early evolution of SARS-CoV-2. bioRxiv 2020, 10.1101/2020.03.11.987222, 2020.2003.2011.987222, doi:10.1101/2020.03.11.987222.
- Van Dorp, L.; Richard, D.; Tan, C.C.; Shaw, L.P.; Acman, M.; Balloux, F. No evidence for increased transmissibility from recurrent mutations in SARS-CoV-2. bioRxiv 2020, 10.1101/2020.05.21.108506, 2020.2005.2021.108506, doi:10.1101/2020.05.21.108506.
- Volz, E.M.; Hill, V.; McCrone, J.T.; Price, A.; Jorgensen, D.; O’Toole, A.; Southgate, J.A.; Johnson, R.; Jackson, B.; Nascimento, F.F.; et al. Evaluating the effects of SARS-CoV-2 Spike mutation D614G on transmissibility and pathogenicity. medRxiv 2020, 2020.2007.2031.20166082.
- Korber, B.; Fischer, W.M.; Gnanakaran, S.; Yoon, H.; Theiler, J.; Abfalterer, W.; Hengartner, N.; Giorgi, E.E.; Bhattacharya, T.; Foley, B.; et al. Tracking Changes in SARS-CoV-2 Spike: Evidence that D614G Increases Infectivity of the COVID-19 Virus. Cell 2020, 182, 812–827 e819, doi:10.1016/j.cell.2020.06.043.
- Elbe, S.; Buckland-Merrett, G. Data, disease and diplomacy: GISAID’s innovative contribution to global health. Glob. Chall 2017, 1, 33–46.

