 +1 credit
| Version | Summary | Created by | Modification | Content Size | Created at | Operation |
|---|---|---|---|---|---|---|
| 1 | Nataša Anastasov | + 3519 word(s) | 3519 | 2020-09-24 10:46:40 | | | |
| 2 | Dean Liu | -1137 word(s) | 2382 | 2020-10-13 05:57:39 | | | | |
| 3 | Dean Liu | Meta information modification | 2382 | 2020-10-26 09:27:19 | | |
Video Upload Options
Label-free quantitative proteomics analysis showed that proteins involved in the lipid metabolism, sirtuin signaling, mitochondrial function, cytoskeletal organization, and antioxidant defense were the most affected. A histopathological analysis elucidated large foci of fibrotic tissue, myocardial lipomatosis and lymphocytic infiltrations in the irradiated samples. These data highlight the suitability of FFPE material for proteomics analysis. The study confirms the previous results emphasizing the role of adverse metabolic changes in the radiation-associated IHD. Most importantly, it excludes age at the time of death as a confounding factor.
1. Introduction
Epidemiological studies in the Mayak Production Association occupationally exposed to chronic low-dose-rate radiation have shown a significant increase in the incidence of ischemic heart disease (IHD) causally associated with the total external gamma-ray dose. The association remains after correction for multiple competing factors such as smoking and alcohol consumption[1][2][3][4].
Previous proteomics study using fresh-frozen tissue obtained at autopsy from the cardiac left ventricle from Mayak workers showed a dose-dependent downregulation of proteins involved in mitochondrial energy metabolism, cardiac cytoskeleton, and oxidative stress response when compared to the samples from non-irradiated controls[5][6]. However, in this study, the individuals in the occupationally exposed group (>500 mGy) were on average 10 years older than the control subjects[5]. We applied a statistical method to distinguish the dose-only dependent protein expression changes from those of the age-only dependent changes. The analysis indicated that the majority of the proteins were deregulated by the radiation dose and not the age [6]. However, the confounding role of age could not be totally excluded. To address this issue, we initiated a new study where the control group was older than the irradiated group. Due to the difficulty of obtaining additional fresh-frozen material, we decided to use formalin-fixed, paraffin-embedded (FFPE) left ventricle tissue in the new study.
FFPE tissue is an ideal source of analytical material for clinical investigations due to its stability in long-term storage[7][8][9][10][11][12][13]. The technical improvement of proteome analysis using FFPE material is a prerequisite for the successful elucidation of biological pathways. However, in spite of several technical improvements, proteomic analysis using FFPE material as an alternative to fresh-frozen tissue remains a challenge [14][15][16][17][18][19][20][21]. The harsh conditions typically used for fixation have previously prohibited successful protein identification and reproducible protein quantification[18][19][22][23]. During the formalin fixation proteins undergo degradation and cross-linking. The fixation results in a 30 Da Hydroxymethyl modification, tagged mainly on lysine residues contributing to the inter- and intramolecular cross-linking reactions[19][22][24][25]. Lysine modification affects the efficiency of protein extraction and digestion[19][26][27]. The Mass Spectrometry analysis often showed a general preferential detection of tryptic peptides with the C-terminal arginine over lysine indicating that modified lysine residues are inaccessible to protease during digestion[19][26][27].
A variety of methods that have been developed allowing the extraction of proteins from FFPE samples[9][28][29][30] have proven to be quite successful in performing proteomics analysis[9][31]. However, only a few proteomics studies using human FFPE cardiac tissue exist, probably due to the lack of this type of biomaterial[32][33].
The data presented here show the compatibility of FFPE tissue for a proteomic approach. The study suggests that chronic radiation exposure induces alterations in the heart metabolism, structure and oxidative stress response that may contribute to the radiation-induced IHD. Furthermore, it shows that these alterations are not caused by normal ageing.
2. Proteomic Analysis of FFPE Cardiac Tissue Showed Alteration of the Heart Proteome after Chronic Irradiation
Among the quantified proteins with two or more unique peptides, the expression level of 196 proteins was significantly different between irradiated samples and controls (2 unique peptides; ±1.3-fold; p < 0.05). Of these, 105 proteins were downregulated and 91 upregulated in the irradiated samples (Table 1).
Table 1. Significantly deregulated proteins in irradiated cardiac left ventricle proteome. The proteins listed in the table were identified and quantified by two or more unique peptides; fold changes and p-values are shown.
| Accession | ID | Annotation | Fold Changes | p-Value |
|---|---|---|---|---|
| P00746 | CFD | Complement factor D | 9.3 | 7.86 × 10⁻³ |
| Q96PD5 | PGLYRP2 | N-acetylmuramoyl-L-alanine amidase | 7.7 | 9.62 × 10⁻³ |
| P04745 | AMY1B | Amylase, alpha 1B | 7.3 | 4 × 10⁻² |
| Q96JB5 | CDK5RAP3 | CDK5 regulatory subunit-associated protein 3 | 6.3 | 3.31 × 10⁻⁴ |
| P34897 | SHMT2 | Serine hydroxymethyltransferase, mitochondrial | 6.0 | 2.99 × 10⁻² |
| Q9BQE5 | APOL2 | Apolipoprotein L2 | 5.8 | 3.82 × 10⁻⁵ |
| P20700 | LMNB1 | Lamin-B1 | 5.7 | 1.87 × 10⁻² |
| P05452 | CLEC3B | Tetranectin | 5.6 | 4.23 × 10⁻² |
| O60784 | TOM1 | Target of Myb protein 1 | 4.4 | 1.10 × 10⁻² |
| Q6ICL3 | TANGO2 | Transport and golgi organization 2 homolog | 3.7 | 2.41 × 10⁻² |
| Q08209 | PPP3CA | Serine/threonine-protein phosphatase 2B catalytic alpha | 3.4 | 2.22 × 10⁻² |
| P37802 | TAGLN2 | Transgelin-2 | 3.3 | 1.67 × 10⁻³ |
| Q01518 | CAP1 | Adenylyl cyclase-associated protein 1 | 3.3 | 1.84 × 10⁻⁵ |
| A0A0A0MS15 | IGHV3-49 | Immunoglobulin heavy variable 3-49 | 3.2 | 1.98 × 10⁻² |
| P13591 | NCAM1 | Neural cell adhesion molecule 1 | 3.1 | 4.16 × 10⁻² |
| O95336 | PGLS | 6-phosphogluconolactonase | 3.1 | 3.25 × 10⁻² |
| Q99715 | COL12A1 | Collagen alpha-1(XII) chain | 3.1 | 2.22 × 10⁻² |
| O95865 | DDAH2 | N(G),N(G)-dimethylarginine dimethylaminohydrolase 2 | 3.0 | 5.28 × 10⁻³ |
| Q5T0D9 | TPRG1L | Tumor protein p63 regulated 1 like | 3.0 | 3.05 × 10⁻⁴ |
| P31327 | CPS1 | Carbamoyl-phosphate synthase, mitochondrial | 2.9 | 3.27 × 10⁻² |
| P07738 | BPGM | Bisphosphoglycerate mutase | 2.9 | 1.28 × 10⁻² |
| P61221 | ABCE1 | ATP-binding cassette sub-family E member 1 | 2.9 | 4.21 × 10⁻² |
| Q7Z3Y8 | KRT27 | Keratin, type I cytoskeletal 27 | 2.7 | 4.64 × 10⁻³ |
| Q16610 | ECM1 | Extracellular matrix protein 1 | 2.7 | 3.03 × 10⁻² |
| P05156 | CFI | Complement factor I | 2.7 | 1.41 × 10⁻² |
| P01780 | IGHV3-7 | Immunoglobulin heavy variable 3-7 | 2.6 | 1.14 × 10⁻² |
| P05546 | SERPIND1 | Heparin cofactor 2 | 2.6 | 5.00 × 10⁻² |
| O75122 | CLASP2 | CLIP-associating protein 2 | 2.6 | 4.21 × 10⁻² |
| Q2TAA2 | IAH1 | Isoamyl acetate-hydrolyzing esterase 1 homolog | 2.5 | 3.13 × 10⁻² |
| P16070 | CD44 | CD44 antigen | 2.4 | 4.01 × 10⁻³ |
| P49721 | PSMB2 | Proteasome subunit beta type-2 | 2.4 | 6.87 × 10⁻⁷ |
| P13667 | PDIA4 | Protein disulfide-isomerase A4 | 2.4 | 6.55 × 10⁻³ |
| P35858 | IGFALS | Insulin-like growth factor-binding protein complex acid labile | 2.3 | 3.50 × 10⁻² |
| P19652 | ORM2 | Alpha-1-acid glycoprotein 2 | 2.3 | 2.06 × 10⁻² |
| O96007 | MOCS2 | Molybdopterin synthase catalytic subunit | 2.3 | 8.91 × 10⁻⁴ |
| P08294 | SOD3 | Extracellular superoxide dismutase [Cu-Zn] | 2.2 | 5.01 × 10⁻² |
| Q6FI13 | HIST2H2AA | Histone cluster 2 H2A family member a4 | 2.2 | 3.55 × 10⁻³ |
| P00488 | F13A1 | Coagulation factor XIII A chain | 2.2 | 3.71 × 10⁻³ |
| P02649 | APOE | Apolipoprotein E | 2.2 | 3.95 × 10⁻² |
| Q9HBI1 | PARVB | Beta-parvin | 2.2 | 1.49 × 10⁻² |
| Q9BR76 | CORO1B | Coronin-1B | 2.1 | 1.26 × 10⁻² |
| P28074 | PSMB5 | Proteasome subunit beta type-5 | 2.1 | 9.94 × 10⁻⁴ |
| P01714 | IGLV3-19 | Immunoglobulin lambda variable 3-19 | 2.0 | 1.91 × 10⁻² |
| O60888 | CUTA | Protein CutA | 2.0 | 1.25 × 10⁻² |
| Q16658 | FSCN1 | Fascin | 2.0 | 3.42 × 10⁻² |
| Q9ULV4 | CORO1C | Coronin-1C | 2.0 | 1.02 × 10⁻² |
| P17655 | CAPN2 | Calpain-2 catalytic subunit | 2.0 | 1.58 × 10⁻² |
| Q15582 | TGFBI | Transforming growth factor-beta-induced protein ig-h3 | 2.0 | 3.83 × 10⁻² |
| P15144 | ANPEP | Aminopeptidase N | 1.9 | 3.32 × 10⁻² |
| P01008 | SERPINC1 | Antithrombin-III | 1.9 | 2.66 × 10⁻² |
| Q96HY7 | DHTKD1 | Probable 2-oxoglutarate dehydrogenase E1 component | 1.9 | 4.54 × 10⁻² |
| P39059 | COL15A1 | Collagen alpha-1(XV) chain | 1.8 | 3.28 × 10⁻² |
| P35754 | GLRX | Glutaredoxin-1 | 1.8 | 4.58 × 10⁻² |
| P40121 | CAPG | Macrophage-capping protein | 1.8 | 2.32 × 10⁻² |
| P36269 | GGT5 | Glutathione hydrolase 5 proenzyme | 1.8 | 3.04 × 10⁻² |
| O75340 | PDCD6 | Programmed cell death protein 6 | 1.8 | 9.00 × 10⁻³ |
| P12109 | COL6A1 | Collagen alpha-1(VI) chain | 1.8 | 3.09 × 10⁻² |
| P19827 | ITIH1 | Inter-alpha-trypsin inhibitor heavy chain H1 | 1.7 | 4.77 × 10⁻² |
| P05109 | S100A8 | Protein S100-A8 | 1.7 | 3.47 × 10⁻² |
| P36543 | ATP6V1E1 | V-type proton ATPase subunit E 1 | 1.7 | 1.10 × 10⁻² |
| P04040 | CAT | Catalase | 1.7 | 2.98 × 10⁻² |
| P12110 | COL6A2 | Collagen alpha-2(VI) chain | 1.7 | 3.98 × 10⁻² |
| P62191 | PSMC1 | 26S proteasome regulatory subunit 4 | 1.7 | 3.55 × 10⁻² |
| Q16647 | PTGIS | Prostacyclin synthase | 1.6 | 2.95 × 10⁻² |
| Q9NZN3 | EHD3 | EH domain-containing protein 3 | 1.6 | 6.77 × 10⁻³ |
| Q9UJZ1 | STOML2 | Stomatin-like protein 2, mitochondrial | 1.6 | 2.81 × 10⁻² |
| P25786 | PSMA1 | Proteasome subunit alpha type-1 | 1.6 | 3.65 × 10⁻² |
| Q8IUE6 | HIST2H2AB | Histone H2A type 2-B | 1.5 | 1.13 × 10⁻² |
| Q13084 | MRPL28 | Mitochondrial ribosomal protein L28 | 1.5 | 5.01 × 10⁻² |
| Q13162 | PRDX4 | Peroxiredoxin-4 | 1.5 | 3.24 × 10⁻² |
| Q9Y490 | TLN1 | Talin-1 | 1.5 | 2.94 × 10⁻² |
| Q15121 | PEA15 | Astrocytic phosphoprotein PEA-15 | 1.5 | 3.16 × 10⁻² |
| Q9H4M9 | EHD1 | EH domain-containing protein 1 | 1.5 | 1.64 × 10⁻² |
| O75396 | SEC22B | Vesicle-trafficking protein SEC22b | 1.5 | 7.62 × 10⁻³ |
| P24821 | TNC | Tenascin | 1.4 | 4.70 × 10⁻³ |
| P02766 | TTR | Transthyretin | 1.4 | 4.35 × 10⁻³ |
| P02042 | HBD | Hemoglobin subunit delta | 1.4 | 2.66 × 10⁻² |
| P78527 | PRKDC | DNA-dependent protein kinase catalytic subunit | 1.4 | 4.48 × 10⁻² |
| P25788 | PSMA3 | Proteasome subunit alpha type-3 | 1.4 | 4.59 × 10⁻² |
| P68871 | HBB | Hemoglobin subunit beta | 1.4 | 1.54 × 10⁻² |
| P07451 | CA3 | Carbonic anhydrase 3 | 1.4 | 4.69 × 10⁻² |
| P26447 | S100A4 | S100 calcium binding protein A4 | 1.4 | 9.24 × 10⁻³ |
| P0C0S5 | H2AFZ | Histone H2A.Z | 1.4 | 1.23 × 10⁻² |
| P51398 | DAP3 | 28S ribosomal protein S29, mitochondrial | 1.4 | 4.85 × 10⁻⁴ |
| P28072 | PSMB6 | Proteasome subunit beta type-6 | 1.4 | 3.67 × 10⁻² |
| P23284 | PPIB | Peptidyl-prolyl cis-trans isomerase B | 1.4 | 2.32 × 10⁻² |
| P04196 | HRG | Histidine-rich glycoprotein | 1.3 | 4.56 × 10⁻² |
| Q14697 | GANAB | Neutral alpha-glucosidase AB | 1.3 | 4.40 × 10⁻² |
| P00915 | CA1 | Carbonic anhydrase 1 | 1.3 | 1.55 × 10⁻² |
| Q96QK1 | VPS35 | Vacuolar protein sorting-associated protein 35 | 1.3 | 2.98 × 10⁻² |
| P69905 | HBA2 | Hemoglobin subunit alpha 2 | 1.3 | 3.55 × 10⁻² |
| P35613 | BSG | Basigin | 0.76 | 7.53 × 10⁻³ |
| P51649 | ALDH5A1 | Succinate-semialdehyde dehydrogenase, mitochondrial | 0.76 | 2.80 × 10⁻² |
| P62263 | RPS14 | Ribosomal protein S14 | 0.76 | 4.03 × 10⁻² |
| P09429 | HMGB1 | High mobility group protein B1 | 0.76 | 5.01 × 10⁻² |
| Q9H7Z7 | PTGES2 | Prostaglandin E synthase 2 | 0.76 | 3.68 × 10⁻² |
| Q9Y2Z9 | COQ6 | Ubiquinone biosynthesis monooxygenase COQ6 | 0.75 | 1.62 × 10⁻² |
| Q8NDY3 | ADPRHL1 | [Protein ADP-ribosylarginine] hydrolase-like protein 1 | 0.75 | 4.76 × 10⁻² |
| Q7Z406 | MYH14 | Myosin-14 | 0.75 | 4.69 × 10⁻² |
| Q16698 | DECR1 | 2,4-dienoyl-CoA reductase, mitochondrial | 0.75 | 4.16 × 10⁻² |
| Q03252 | LMNB2 | Lamin-B2 | 0.75 | 8.66 × 10⁻³ |
| P10916 | MYL2 | Myosin regulatory light chain 2, ventricular/cardiac | 0.75 | 2.03 × 10⁻² |
| Q0ZGT2 | NEXN | Nexilin | 0.74 | 4.74 × 10⁻² |
| E7EW31 | PROB1 | Proline rich basic protein 1 | 0.74 | 4.33 × 10⁻² |
| P52179 | MYOM1 | Myomesin-1 | 0.73 | 8.85 × 10⁻³ |
| Q9Y265 | RUVBL1 | RuvB-like 1 | 0.73 | 3.98 × 10⁻² |
| P46777 | RPL5 | 60S ribosomal protein L5 | 0.73 | 3.86 × 10⁻³ |
| P30038 | ALDH4A1 | Delta-1-pyrroline-5-carboxylate dehydrogenase | 0.73 | 2.60 × 10⁻² |
| P32119 | PRDX2 | Peroxiredoxin-2 | 0.73 | 2.77 × 10⁻² |
| P45379 | TNNT2 | Troponin T, cardiac muscle | 0.73 | 8.78 × 10⁻³ |
| O75521 | ECI2 | Enoyl-CoA delta isomerase 2, mitochondrial | 0.72 | 4.43 × 10⁻² |
| Q16836 | HADH | Hydroxyacyl-coenzyme A dehydrogenase, mitochondrial | 0.72 | 1.58 × 10⁻² |
| Q9BTZ2 | DHRS4 | Dehydrogenase/reductase SDR family member 4 | 0.72 | 1.67 × 10⁻² |
| P07339 | CTSD | Cathepsin D | 0.72 | 1.31 × 10⁻³ |
| Q9BX66 | SORBS1 | Sorbin and SH3 domain-containing protein 1 | 0.72 | 3.43 × 10⁻² |
| Q15046 | KARS | Lysine—tRNA ligase | 0.71 | 2.49 × 10⁻² |
| O75438 | NDUFB1 | NADH dehydrogenase [ubiquinone] 1 beta subcomplex 1 | 0.71 | 1.62 × 10⁻² |
| O95817 | BAG3 | BAG family molecular chaperone regulator 3 | 0.71 | 3.99 × 10⁻² |
| Q9UL25 | RAB21 | Ras-related protein Rab-21 | 0.71 | 3.92 × 10⁻² |
| P21397 | MAOA | Amine oxidase [flavin-containing] A | 0.70 | 7.04 × 10⁻³ |
| Q96HS1 | PGAM5 | Serine/threonine-protein phosphatase PGAM5 | 0.70 | 1.43 × 10⁻² |
| Q9Y5J7 | TIMM9 | Mitochondrial import inner membrane translocase | 0.70 | 1.36 × 10⁻² |
| O75947 | ATP5H | ATP synthase subunit d, mitochondrial | 0.70 | 2.39 × 10⁻² |
| P19429 | TNNI3 | Troponin I, cardiac muscle | 0.69 | 9.61 × 10⁻³ |
| P62753 | RPS6 | 40S ribosomal protein S6 | 0.69 | 2.02 × 10⁻² |
| Q13045 | FLII | Protein flightless-1 homolog | 0.69 | 1.78 × 10⁻² |
| O95292 | VAPB | Vesicle-associated membrane protein-associated protein | 0.68 | 1.72 × 10⁻² |
| P02511 | CRYAB | Alpha-crystallin B chain | 0.67 | 3.99 × 10⁻³ |
| P15121 | AKR1B1 | Aldose reductase | 0.67 | 5.01 × 10⁻² |
| Q9NUJ1 | ABHD10 | Mycophenolic acid acyl-glucuronide esterase | 0.67 | 1.49 × 10⁻³ |
| P46779 | RPL28 | 60S ribosomal protein L28 | 0.67 | 3.76 × 10⁻² |
| Q6PIU2 | NCEH1 | Neutral cholesterol ester hydrolase 1 | 0.67 | 4.07 × 10⁻² |
| Q8WWI1 | LMO7 | LIM domain only protein 7 | 0.66 | 5.01 × 10⁻² |
| Q9UFN0 | NIPSNAPA | Nipsnap homolog 3A | 0.66 | 2.13 × 10⁻³ |
| Q14118 | DAG1 | Dystroglycan | 0.66 | 7.65 × 10⁻³ |
| Q5BKX8 | MURC | Caveolae-associated protein 4 | 0.65 | 1.78 × 10⁻³ |
| Q6IAA8 | LAMTOR1 | Ragulator complex protein LAMTOR1 | 0.65 | 2.14 × 10⁻² |
| O43676 | NDUFB3 | NADH dehydrogenase [ubiquinone] 1 beta subcomplex 3 | 0.65 | 3.38 × 10⁻² |
| P49368 | CCT3 | T-complex protein 1 subunit gamma | 0.64 | 1.01 × 10⁻² |
| P63220 | RPS21 | Ribosomal protein S21 | 0.64 | 1.14 × 10⁻² |
| Q9UMR2 | DDX19B | ATP-dependent RNA helicase DDX19B | 0.64 | 5.87 × 10⁻⁵ |
| Q8NBN7 | RDH13 | Retinol dehydrogenase 13 | 0.64 | 4.74 × 10⁻² |
| Q14192 | FHL2 | Four and a half LIM domains protein 2 | 0.64 | 5.01 × 10⁻² |
| O76024 | WFS1 | Wolframin | 0.64 | 4.83 × 10⁻² |
| P30084 | ECHS1 | Enoyl-CoA hydratase, mitochondrial | 0.63 | 5.17 × 10⁻³ |
| Q9HBL7 | PLGRKT | Plasminogen receptor (KT) | 0.63 | 2.44 × 10⁻² |
| P26440 | IVD | Isovaleryl-CoA dehydrogenase, mitochondrial | 0.63 | 2.67 × 10⁻² |
| P60866 | RPS20 | Ribosomal protein S20 | 0.62 | 3.18 × 10⁻² |
| Q6DN03 | HIST2H2BC | Putative histone H2B type 2-C | 0.62 | 1.71 × 10⁻² |
| Q99460 | PSMD1 | 26S proteasome non-ATPase regulatory subunit 1 | 0.61 | 1.71 × 10⁻² |
| Q96PE7 | MCEE | Methylmalonyl-CoA epimerase, mitochondrial | 0.61 | 1.44 × 10⁻² |
| Q8N3J5 | PPM1K | Protein phosphatase 1K, mitochondrial | 0.61 | 2.98 × 10⁻² |
| Q9Y5K5 | UCHL5 | Ubiquitin carboxyl-terminal hydrolase isozyme L5 | 0.61 | 1.82 × 10⁻⁴ |
| Q9H987 | SYNPO2L | Synaptopodin 2-like protein | 0.60 | 2.82 × 10⁻² |
| O95182 | NDUFA7 | NADH dehydrogenase [ubiquinone] 1 alpha 7 | 0.59 | 8.36 × 10⁻³ |
| Q9NQR4 | NIT2 | Omega-amidase NIT2 | 0.59 | 1.48 × 10⁻² |
| Q96ND0 | FAM210A | Protein FAM210A | 0.58 | 3.74 × 10⁻² |
| P46109 | CRKL | Crk-like protein | 0.58 | 2.56 × 10⁻² |
| Q13409 | DYNC1I2 | Cytoplasmic dynein 1 intermediate chain 2 | 0.57 | 9.61 × 10⁻³ |
| P62906 | RPL10A | 60S ribosomal protein L10a | 0.57 | 1.81 × 10⁻² |
| Q8NF91 | SYNE1 | Nesprin-1 | 0.57 | 2.02 × 10⁻² |
| O94875 | SORBS2 | Sorbin and SH3 domain-containing protein 2 | 0.56 | 2.55 × 10⁻² |
| Q9BS92 | NIPSNAP3B | Nipsnap homolog 3B | 0.56 | 5.01 × 10⁻² |
| Q13151 | HNRNPA0 | Heterogeneous nuclear ribonucleoprotein A0 | 0.55 | 1.94 × 10⁻² |
| P82675 | MRPS5 | Mitochondrial ribosomal protein S5 | 0.55 | 1.17 × 10⁻² |
| P22830 | FECH | Ferrochelatase, mitochondrial | 0.55 | 9.32 × 10⁻³ |
| Q5HYJ1 | TECRL | trans-2,3-enoyl-CoA reductase like | 0.55 | 4.59 × 10⁻³ |
| Q9Y285 | FARSA | phenylalanyl-tRNA synthetase alpha subunit | 0.54 | 2.10 × 10⁻⁴ |
| Q8TB22 | SPATA20 | Spermatogenesis-associated protein 20 | 0.53 | 4.46 × 10⁻³ |
| Q9NP72 | RAB18 | Ras-related protein Rab-18 | 0.52 | 4.87 × 10⁻³ |
| O75190 | DNAJB6 | DnaJ homolog subfamily B member 6 | 0.52 | 8.53 × 10⁻³ |
| P35542 | SAA4 | Serum amyloid A-4 protein | 0.51 | 3.04 × 10⁻² |
| E9PAV3 | NACA | Nascent polypeptide-associated complex subunit alpha | 0.49 | 5.23 × 10⁻⁵ |
| Q8N6M3 | FITM2 | Fat storage-inducing transmembrane protein 2 | 0.48 | 1.85 × 10⁻² |
| P27816 | MAP4 | Microtubule-associated protein 4 | 0.47 | 4.48 × 10⁻² |
| P0CAP1 | MYZAP | Myocardial zonula adherens protein | 0.47 | 1.87 × 10⁻² |
| Q96AB3 | ISOC2 | Isochorismatase domain containing 2 | 0.46 | 9.70 × 10⁻³ |
| Q562R1 | ACTBL2 | Beta-actin-like protein 2 | 0.44 | 3.63 × 10⁻² |
| Q9NS69 | TOMM22 | Mitochondrial import receptor subunit TOM22 homolog | 0.43 | 1.34 × 10⁻² |
| Q9BXK5 | BCL2L13 | Bcl-2-like protein 13 | 0.42 | 2.93 × 10⁻² |
| Q16543 | CDC37 | Hsp90 co-chaperone Cdc37 | 0.42 | 5.00 × 10⁻² |
| P43155 | CRAT | Carnitine O-acetyltransferase | 0.42 | 1.24 × 10⁻³ |
| Q5VWP3 | MLIP | Muscular LMNA-interacting protein | 0.41 | 3.38 × 10⁻² |
| O60488 | ACSL4 | Long-chain-fatty-acid—CoA ligase 4 | 0.40 | 2.89 × 10⁻⁴ |
| Q08722 | CD47 | Leukocyte surface antigen CD47 | 0.39 | 6.97 × 10⁻³ |
| Q6Y288 | B3GALTL | Beta-1,3-glucosyltransferase | 0.38 | 4.29 × 10⁻³ |
| P43487 | RANBP1 | Ran-specific GTPase-activating protein | 0.35 | 1.93 × 10⁻⁶ |
| P01040 | CSTA | Cystatin-A | 0.33 | 3.50 × 10⁻² |
| P48506 | GCLC | Glutamate—cysteine ligase catalytic subunit | 0.33 | 4.30 × 10⁻² |
| P08621 | SNRNP70 | U1 small nuclear ribonucleoprotein 70 kDa | 0.30 | 2.09 × 10⁻³ |
| P23919 | DTYMK | Thymidylate kinase | 0.30 | 6.33 × 10⁻³ |
| O95394 | PGM3 | Phosphoacetylglucosamine mutase | 0.29 | 4.82 × 10⁻² |
| P12829 | MYL4 | Myosin light chain 4 | 0.26 | 2.84 × 10⁻⁴ |
| Q9NX40 | OCIAD1 | OCIA domain-containing protein 1 | 0.19 | 1.96 × 10⁻³ |
| Q08830 | FGL1 | Fibrinogen-like protein 1 | 0.12 | 4.76 × 10⁻³ |
| Q08397 | LOXL1 | Lysyl oxidase homolog 1 | 0.08 | 2.20 × 10⁻² |
A volcano plot of all quantified and significantly deregulated proteins is shown in Figure 1A. The heat map based on the intensity of differentially regulated proteins in all individual samples showed a clear difference between the control and irradiated groups (Figure 1B).
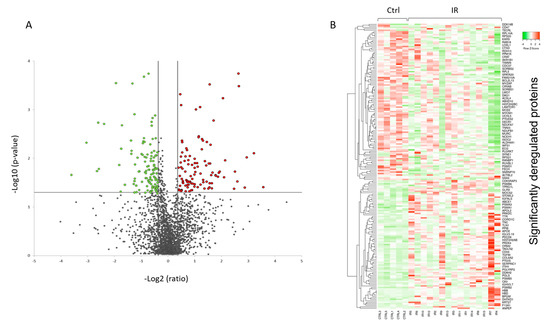
Figure 1. Graphical representation of quantitative proteomics data of human FFPE cardiac tissue after chronic irradiation. Proteins are ranked in a volcano plot according to the −log10 of their statistical p-value (y-axis) and log2 fold change (x-axis). The green and red points represent the significantly downregulated and upregulated proteins, respectively (A). The heat map shows hierarchical clustering (average linkage, Spearman ranked correlation) of significantly deregulated proteins in 5 controls (Ctrl) and 15 irradiated (IR) samples (B). The green bars indicate downregulation and the red bars upregulation. The analysis was performed using Heatmapper web server.
Among the differentially regulated proteins were several lipid metabolism enzymes (Table 1). Long-chain-fatty-acid—CoA ligase 4 (ACSL4), hydroxyacyl-coenzyme A dehydrogenase (HADH), 2,4-dienoyl-CoA reductase (DECR1), enoyl-CoA hydratase (ECHS1), isovaleryl-CoA dehydrogenase (IVD), and enoyl-CoA delta isomerase 2 (ECI2) were all downregulated.
A number of proteins belonging to the sirtuin pathway and mitochondrial respiratory chain were also significantly downregulated in the irradiated samples (Table 1). The level of mitochondrial import inner membrane translocase (TIMM9), mitochondrial import receptor (TOMM22), and that of several proteins in the mitochondrial complexes I and V was reduced in the irradiated samples (Table 1).
Similarly, the data also showed downregulation in the expression of actin cytoskeleton components such as troponin I (TNNI3), troponin T (TNNT2), and different myosin isoforms including myosin heavy chain 14 (MYH14), myosin regulatory light chain 2 (MYL2), myosin light chain 4 (MYL4), and myomesin-1 (MYOM1) (Table 1). In contrast, several collagen isoforms were upregulated in the proteomics data, including collagen type XII alpha 1 chain (COL12A1), collagen type XV alpha 1 chain (COL15A), collagen type VI alpha 1 chain (COL6A) and collagen type VI alpha 2 chain (COL6A2) (Table 1).
The levels of several proteins of the oxidative stress response, namely catalase (CAT), peroxiredoxin 2 (PRDX2), peroxiredoxin 4 (PRDX4), extracellular superoxide dismutase [Cu-Zn] (SOD3), glutathione hydrolase 5 (GGT5), and glutaredoxin-1 (GLRX), were altered, most showing upregulation (Table 1).
A detailed analysis of the functional interactions and biological pathways of the deregulated proteins was performed using Ingenuity Pathway Analysis (IPA) software. Fatty acid metabolism, sirtuin signaling, mitochondrial dysfunction, protein ubiquitination, tissue fibrosis, cytoskeleton organization, and oxidative stress were the most affected pathways in the irradiated samples compared to the control (Figure 2A). Especially two biological networks showed enrichment of deregulated proteins. The predicted regulators of these networks were the peroxisome proliferator-activated receptor (PPAR) alpha and transforming growth factor beta-1 (TGFB1) (Figure 2B,C). PPAR alpha was predicted to be inactivated in irradiated samples, whilst TGF beta was predicted to be activated. Differentially expressed proteins were associated with cardiotoxicity-related pathways including cardiac dilation, cardiac enlargement, cardiac dysfunction, heart failure, and cardiac fibrosis.
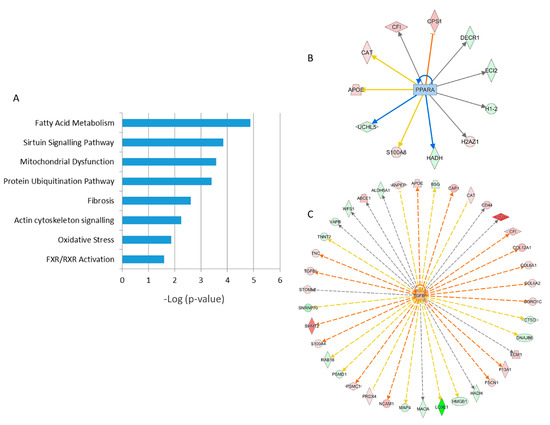
Figure 2. Pathway analysis of differentially regulated proteins from human FFPE heart tissues. The most significant canonical pathways altered by irradiation are shown. The analyses were generated using Ingenuity Pathway Analysis (IPA) (QIAGEN Inc., Hilden, Germany). The bars indicate canonical pathways and the y-axis displays the −(log p) enrichment significance. The tall bars are more significant than the short ones (A). Graphical representation of the deregulated protein networks with their upstream transcriptional regulators peroxisome proliferator-activated receptor (PPAR) alpha (B) and transforming growth factor beta (TGFB) (C) are shown. The upregulated proteins are marked in red and the downregulated in green. The nodes in blue (inhibition) and orange (activation) represent transcription factors. The full protein names are given in Table 1.
References
- Azizova, T.V.; Grigorieva, E.S.; Hunter, N.; Pikulina, M.V.; Moseeva, M.B. Risk of mortality from circulatory diseases in Mayak workers cohort following occupational radiation exposure. J. Radiol. Prot. 2015, 35, 517–538.
- Azizova, T.V.; Muirhead, C.R.; Druzhinina, M.B.; Grigoryeva, E.S.; Vlasenko, E.V.; Sumina, M.V.; O’Hagan, J.A.; Zhang, W.; Haylock, R.G.; Hunter, N. Cardiovascular diseases in the cohort of workers first employed at Mayak PA in 1948–1958. Radiat. Res. 2010, 174, 155–168.
- Azizova, T.V.; Muirhead, C.R.; Moseeva, M.B.; Grigoryeva, E.S.; Vlasenko, E.V.; Hunter, N.; Haylock, R.G.; O’Hagan, J.A. Ischemic heart disease in nuclear workers first employed at the Mayak PA in 1948–1972. Health Phys. 2012, 103, 3–14.
- Azizova, T.V.; Grigoryeva, E.S.; Haylock, R.G.; Pikulina, M.V.; Moseeva, M.B. Ischaemic heart disease incidence and mortality in an extended cohort of Mayak workers first employed in 1948–1982. Br. J. Radiol. 2015, 88, 20150169.
- Azimzadeh, O.; Azizova, T.; Merl-Pham, J.; Subramanian, V.; Bakshi, M.V.; Moseeva, M.; Zubkova, O.; Hauck, S.M.; Anastasov, N.; Atkinson, M.J.; et al. A dose-dependent perturbation in cardiac energy metabolism is linked to radiation-induced ischemic heart disease in Mayak nuclear workers. Oncotarget 2017, 8, 9067–9078.
- Papiez, A.; Azimzadeh, O.; Azizova, T.; Moseeva, M.; Anastasov, N.; Smida, J.; Tapio, S.; Polanska, J. Integrative multiomics study for validation of mechanisms in radiation-induced ischemic heart disease in Mayak workers. PLoS ONE 2018, 13, e0209626.
- Bayer, M.; Angenendt, L.; Schliemann, C.; Hartmann, W.; Konig, S. Are formalin-fixed and paraffin-embedded tissues fit for proteomic analysis? J. Mass Spectrom. 2019, 55, e4347.
- Zhu, Y.; Weiss, T.; Zhang, Q.; Sun, R.; Wang, B.; Yi, X.; Wu, Z.; Gao, H.; Cai, X.; Ruan, G.; et al. High-throughput proteomic analysis of FFPE tissue samples facilitates tumor stratification. Mol. Oncol. 2019, 13, 2305–2328.
- Giusti, L.; Angeloni, C.; Lucacchini, A. Update on proteomic studies of formalin-fixed paraffin-embedded tissues. Expert Rev. Proteom. 2019, 16, 513–520.
- Tapio, S.; Hornhardt, S.; Gomolka, M.; Leszczynski, D.; Posch, A.; Thalhammer, S.; Atkinson, M.J. Use of proteomics in radiobiological research: Current state of the art. Radiat. Environ. Biophys. 2010, 49, 1–4.
- Tapio, S.; Atkinson, M.J. Molecular information obtained from radiobiological tissue archives: Achievements of the past and visions of the future. Radiat. Environ. Biophys. 2008, 47, 183–187.
- Tapio, S.; Schofield, P.N.; Adelmann, C.; Atkinson, M.J.; Bard, J.L.; Bijwaard, H.; Birschwilks, M.; Dubus, P.; Fiette, L.; Gerber, G.; et al. Progress in updating the European Radiobiology Archives. Int. J. Radiat. Biol. 2008, 84, 930–936.
- Gustafsson, O.J.; Arentz, G.; Hoffmann, P. Proteomic developments in the analysis of formalin-fixed tissue. Biochim. Biophys. Acta 2015, 1854, 559–580.
- Nirmalan, N.J.; Harnden, P.; Selby, P.J.; Banks, R.E. Development and validation of a novel protein extraction methodology for quantitation of protein expression in formalin-fixed paraffin-embedded tissues using western blotting. J. Pathol. 2009, 217, 497–506.
- Tanca, A.; Addis, M.F.; Pagnozzi, D.; Cossu-Rocca, P.; Tonelli, R.; Falchi, G.; Eccher, A.; Roggio, T.; Fanciulli, G.; Uzzau, S. Proteomic analysis of formalin-fixed, paraffin-embedded lung neuroendocrine tumor samples from hospital archives. J. Proteom. 2011, 74, 359–370.
- Azimzadeh, O.; Scherthan, H.; Yentrapalli, R.; Barjaktarovic, Z.; Ueffing, M.; Conrad, M.; Neff, F.; Calzada-Wack, J.; Aubele, M.; Buske, C.; et al. Label-free protein profiling of formalin-fixed paraffin-embedded (FFPE) heart tissue reveals immediate mitochondrial impairment after ionising radiation. J. Proteom. 2012, 75, 2384–2395.
- Tanca, A.; Pagnozzi, D.; Burrai, G.P.; Polinas, M.; Uzzau, S.; Antuofermo, E.; Addis, M.F. Comparability of differential proteomics data generated from paired archival fresh-frozen and formalin-fixed samples by GeLC-MS/MS and spectral counting. J. Proteom. 2012, 77, 561–576.
- Giusti, L.; Lucacchini, A. Proteomic studies of formalin-fixed paraffin-embedded tissues. Expert Rev. Proteom. 2013, 10, 165–177.
- Azimzadeh, O.; Barjaktarovic, Z.; Aubele, M.; Calzada-Wack, J.; Sarioglu, H.; Atkinson, M.J.; Tapio, S. Formalin-fixed paraffin-embedded (FFPE) proteome analysis using gel-free and gel-based proteomics. J. Proteome Res. 2010, 9, 4710–4720.
- Wisniewski, J.R.; Dus, K.; Mann, M. Proteomic workflow for analysis of archival formalin-fixed and paraffin-embedded clinical samples to a depth of 10000 proteins. Proteom. Clin. Appl. 2013, 7, 225–233. [Google Scholar] [CrossRef]
- Wisniewski, J.R.; Zougman, A.; Nagaraj, N.; Mann, M. Universal sample preparation method for proteome analysis. Nat. Methods 2009, 6, 359–362.
- Metz, B.; Kersten, G.F.; Hoogerhout, P.; Brugghe, H.F.; Timmermans, H.A.; de Jong, A.; Meiring, H.; ten Hove, J.; Hennink, W.E.; Crommelin, D.J.; et al. Identification of formaldehyde-induced modifications in proteins: Reactions with model peptides. J. Biol. Chem. 2004, 279, 6235–6243.
- Steiner, C.; Ducret, A.; Tille, J.C.; Thomas, M.; McKee, T.A.; Rubbia-Brandt, L.; Scherl, A.; Lescuyer, P.; Cutler, P. Applications of mass spectrometry for quantitative protein analysis in formalin-fixed paraffin-embedded tissues. Proteomics 2014, 14, 441–451.
- Fowler, C.B.; Cunningham, R.E.; O’Leary, T.J.; Mason, J.T. ‘Tissue surrogates’ as a model for archival formalin-fixed paraffin-embedded tissues. Lab. Investig. 2007, 87, 836–846.
- Nirmalan, N.J.; Harnden, P.; Selby, P.J.; Banks, R.E. Mining the archival formalin-fixed paraffin-embedded tissue proteome: Opportunities and challenges. Mol. Biosyst. 2008, 4, 712–720.
- Jiang, X.; Jiang, X.; Feng, S.; Tian, R.; Ye, M.; Zou, H. Development of efficient protein extraction methods for shotgun proteome analysis of formalin-fixed tissues. J. Proteome Res. 2007, 6, 1038–1047.
- Sprung, R.W., Jr.; Brock, J.W.; Tanksley, J.P.; Li, M.; Washington, M.K.; Slebos, R.J.; Liebler, D.C. Equivalence of protein inventories obtained from formalin-fixed paraffin-embedded and frozen tissue in multidimensional liquid chromatography-tandem mass spectrometry shotgun proteomic analysis. Mol. Cell. Proteom. 2009, 8, 1988–1998.
- Azimzadeh, O.; Atkinson, M.J.; Tapio, S. Qualitative and quantitative proteomic analysis of formalin-fixed paraffin-embedded (FFPE) tissue. Methods Mol. Biol. 2015, 1295, 109–115.
- Foll, M.C.; Fahrner, M.; Oria, V.O.; Kuhs, M.; Biniossek, M.L.; Werner, M.; Bronsert, P.; Schilling, O. Reproducible proteomics sample preparation for single FFPE tissue slices using acid-labile surfactant and direct trypsinization. Clin. Proteom. 2018, 15, 1
- Quesada-Calvo, F.; Bertrand, V.; Longuespee, R.; Delga, A.; Mazzucchelli, G.; Smargiasso, N.; Baiwir, D.; Delvenne, P.; Malaise, M.; De Pauw-Gillet, M.C.; et al. Comparison of two FFPE preparation methods using label-free shotgun proteomics: Application to tissues of diverticulitis patients. J. Proteom. 2015, 112, 250–261.
- Gaffney, E.F.; Riegman, P.H.; Grizzle, W.E.; Watson, P.H. Factors that drive the increasing use of FFPE tissue in basic and translational cancer research. Biotech. Histochem. 2018, 93, 373–386.
- Kakimoto, Y.; Ito, S.; Abiru, H.; Kotani, H.; Ozeki, M.; Tamaki, K.; Tsuruyama, T. Sorbin and SH3 domain-containing protein 2 is released from infarcted heart in the very early phase: Proteomic analysis of cardiac tissues from patients. J. Am. Heart Assoc. 2013, 2, e000565.
- Holub, D.; Flodrova, P.; Pika, T.; Flodr, P.; Hajduch, M.; Dzubak, P. Mass Spectrometry Amyloid Typing Is Reproducible across Multiple Organ Sites. BioMed Res. Int. 2019, 2019, 3689091.


