Your browser does not fully support modern features. Please upgrade for a smoother experience.
Submitted Successfully!
 +1 credit
Thank you for your contribution! You can also upload a video entry or images related to this topic.
For video creation, please contact our Academic Video Service.
| Version | Summary | Created by | Modification | Content Size | Created at | Operation |
|---|---|---|---|---|---|---|
| 1 | Guo Hongxu | -- | 3072 | 2022-06-24 10:53:26 | | | |
| 2 | Sirius Huang | Meta information modification | 3072 | 2022-06-24 11:18:27 | | |
Video Upload Options
We provide professional Academic Video Service to translate complex research into visually appealing presentations. Would you like to try it?
Cite
If you have any further questions, please contact Encyclopedia Editorial Office.
Guo, H.; Luo, Z.; Li, M.; Kong, S.; Jiang, H.; Hongxu, G. Big Data-Based Urban Park Research. Encyclopedia. Available online: https://encyclopedia.pub/entry/24436 (accessed on 14 June 2026).
Guo H, Luo Z, Li M, Kong S, Jiang H, Hongxu G. Big Data-Based Urban Park Research. Encyclopedia. Available at: https://encyclopedia.pub/entry/24436. Accessed June 14, 2026.
Guo, Hongxu, Zhuoqiao Luo, Mengtian Li, Shumin Kong, Haiyan Jiang, Guo Hongxu. "Big Data-Based Urban Park Research" Encyclopedia, https://encyclopedia.pub/entry/24436 (accessed June 14, 2026).
Guo, H., Luo, Z., Li, M., Kong, S., Jiang, H., & Hongxu, G. (2022, June 24). Big Data-Based Urban Park Research. In Encyclopedia. https://encyclopedia.pub/entry/24436
Guo, Hongxu, et al. "Big Data-Based Urban Park Research." Encyclopedia. Web. 24 June, 2022.
Copy Citation
Urban parks provide multiple benefits to human well-being and human health. Big data provide new and powerful ways to study visitors’ feelings, activities in urban parks, and the effect they themselves have on urban parks. Big data benefits urban park research by providing low-cost, timely information, a people-oriented perspective, and fine-grained site information.
perception
social media
mobile phone data
urban parks
1. Introduction
Urban parks have generally been considered as places of welfare and public good that offer a variety of benefit to citizen, including health and happiness. Visitors’ feeling, activities and effect they have on urban parks will influence the planning and management of the parks. Therefore, studies on visitors’ satisfaction, well-being and emotion are hot topics [1][2]. Over the past few years, most of the studies have entailed the use of questionnaire-based surveys, onsite semi-structured individual interviews, and systematic observations of urban residents [3][4][5] to obtain accurate knowledge and insights regarding users’ subjective evaluations and experiences. However, the application of these methods is usually site-specific and time-consuming, and the use of limited samples constrains data availability for the studies of large populations [6] and may not accurately reflect the understanding of urban agglomeration [7].
At the beginning of 2000s, people’s lives have been influenced by digital data as more people started to use computer and smartphone. In this moment, big data was launched by the Special Issue in Nature in 2008 and defined as a system with huge amount of information and complex software [8]. After that, the concept of big data went vital and was widely used by researchers because big data, such as mobile phone signal data, social media data, Open Street Map (OSM), can help to deal with problems in urban parks. With the popularization of iPhone and other smartphone installed with Android System, many social media started to apply in smartphone in these 10 years. Thus, the location-based mobile social networks can cover more information of human beings and collect spatial information and social communication of human nimbly and reliably. First, GPS and mobile base stations are used to collect mobility records, such as ID, trajectory, coordinate, and time of visitors [9]. China’s scholars have used mobile phone data to examine the visitor mobility in metropolis, such as Beijing [10], Shanghai [11], and Nanjing [12]. These findings provide new insights into the trajectory of visitors at fine spatiotemporal scales, contributing a lot to local municipal policymakers in the planning of an urban park system [13][14]. Second, social media, such as major social networking sites Facebook and Twitter, have gained popularity across nations, cities, and demographic groups since the beginning of the 2000s, and there have been numerous attempts in academia to define and describe the potential roles of social media in our society [15]. Different elements of user-generated data sets, such as geotags, timestamps, content, and user information, provide new possibilities for studying the thought of visitors from different perspectives [16]. Third, mobile application, mobile signal and social media data can not only collect the reaction and mobility of visitors but can also combine with OSM, Baidu map, and Remote Sensing (RS) to assess park service range, environment services, and surrounding transport, revealing the problem happened in public health. For example, some researchers assessed the cultural ecosystem service in support for maintaining the sustainable development of urban parks for human well-being and ecological conservation of park green space. In addition, some research used OSM and questionnaires to assess whether the activities happened in parks can improve the health quality of visitors [17]. Using big data to study trajectory of visitors, thought of visitors affect human health and the understanding of human–environment relationship in parks. Additionally, it can optimize park planning, management and design to create a human-friendly urban park.
2. Types of Big Data Used in Urban Park Research
Big data, which can be classified into different types according to various criteria, such as data source, data environment, and data geometry, have been used to describe the real-time status of urban environmental factors, economic activities, and the behavioral patterns of urbanites. The classification was divided into six types based on the attribute of data sources; they are user days data, comment data, map data, phone data, image data, and other data.
User days is a data source that contain users, coordinate, date information, text or photograph within a given period [18] on Twitter, Sina, Flickr, Instagram, Jiepang and Facebook. Twitter and Flickr are used the most on urban park research, which can represent tweet and photo user days, respectively. This data can get more information than other kinds of data, but they are also limited by the age and the location of users. Comment data includes Tripadivsor, Ctrip, Dianping, and platforms having user reviews. This kind of data source always provide the review of the users who went to some places and wrote some reviews to express their feelings. The reviews contain titles, bodies, rate-values and dates [19]. It has some limitations that it cannot get the detail information of the reviewers, and the keyword of the comments may be not useful for judging the type and value of the service. In addition, it also cannot get the elderly and children comments. The map data including POI, heat map, and route map, is usually used widely in helping other kinds of data source to solve problems, including AMAP, Baidu, OSM, and Google map. These map platforms provide an objective view of services in the park, but they could not estimate the exact number of differences between different urban parks. Mobile signal data and phone application are phone data, both of which can provide the trajectories of visitors, consider the elderly can be considered and they can add new way for accessibility. However, they are limited by the location of source. For example, China Mobile company can only provide the information of their own country, even own company, and has high measurement error level at the border area. Image data includes data source of images and videos because the video will be turned into images when being analyzed, and eye-tracking, RS and drone are belonged to image data as well. RS often combines with other kinds of big data, but eye-tracking is always used in alone. Other data include acoustic data and transaction data.
3. Main Methods for Analyzing Big Data in Urban Park Research
Big data analysis refers to the process of discovering potential value from big data [20]. Different methods mine data from distinct perspectives and may produce different findings; they are often associated with certain types of big data and have specific purposes.
These methods are mainly classified into two steps, preprocessing and processing, and each of these steps is described briefly in the following contents. The first step is pre-processing, which includes the data acquired directly from database and companies or governments information by web crawling tools. The data from the company or government database can be gained by downloading from open websites or purchasing from special websites. Lin used phone data that were acquired from Fuzhou China Mobile company to explore the disparities in park accessibility [21]. Crawling is a convenient method of downloading data from websites, including Python, JSON, Java, Gooseeker search, and API. This technique is used mainly for acquiring some textual or location information from platforms, such as user days (Weibo, Twitter, and Instagram) and comment data (Dianping, Ctrip, and Tripadvisor). Ullah used JSON files to crawl Weibo data, including a unique user ID, check-in, date, time, geographic location (latitude and longitude), and gender. After gaining information by crawling software, data may need data cleaning, data transformation and so on [22].
Processing is the second step with sentiment analysis, statistical analysis, and spatial analysis. Sentiment analysis is used in user days, comment data and image data to analyze the frequency of word use, sentiment of sentences and the sentiment in pictures. There are mainly five methods: Amazon’s Mechanical Turk, Latent Dirichlet Allocation (LDA), word2vec model, ROST Content Mining 6 (ROST CM6), and FireFACE V1.0 software (Zhilunpudao Agricultural Science & Technique Inc., Changchun, China). Amazon’s Mechanical Turk posts the task on the website and word ratings are calculated by averaging scores from a pool of online crowd-sourced workers [23]. LDA is a kind of unsupervised learning that can find the hidden theme of the sentences and cluster similar words [19]. FireFACE V1.0 software is a kind of image analysis software trained by 30,000 photos to recognize the emotion of visitors [24]. Statistical analysis is used the most, among which SPSS, R, Tableau, and two-step floating catchment area (2SFCA) are used to realize the relation between visitation and its factors. All kinds of data can use statistical analysis, especially in the Student’s t-test, Analysis of Variance (ANOVA), logistic regression model, Mann–Whitney test, Spearman’s correlation, and Pearson correlation. t-test is an analysis method that can make comparison between two situations [25], and ANOVA is used to show the connection between various factors and main elements [26]. Spatial analysis is a part of Statistical analysis, and Geographic Information System (GIS) is the Spatial analysis that is used in almost all kinds of platforms, and its Global Moran’s I, Kernel density estimation (KDE), and geographically weighted regression (GWR) are used widely in nearly all kinds of data. Moran’s I can be seen in many studies as it can classify different areas and analyze the connection between each area [27].
4. Key Themes in Big Data-Based Urban Park Research in Visitor Dimension
Visitors in urban parks can be accessed by big data in various ways, and the topics of this research can be divided into three themes: visitors’ behavior, visitors’ perception, and visitors’ effect. These themes were mainly sorted by the titles and keywords of the research. For example, mobility and activities of visitors should be contained in behavior. Emotion, satisfaction, and well-being of visitors should be contained in perception. Effect could contain the healthy and environmental effect of visitors. Besides, each theme would mainly correspond to different sources of big data (Figure 1), and each data also has connection with different topics under the themes.
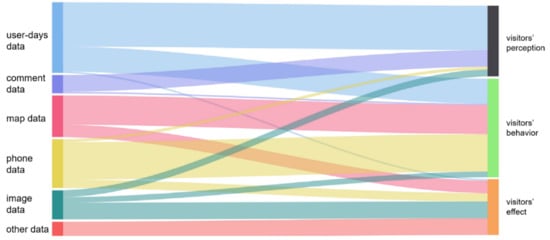
Figure 1. A sankey diagram illustrating the relations among different types of big data and research themes.
4.1. Visitors’ Behavior
The spatial and temporal distribution of visiting and the activities happened in urban parks can be detected from visitors’ behavior, so this theme has more chance to use big data. Phone data, map data, and some social media are the ways to collect the information.
Phone data are utilized the most in this theme, as it can study the accessibility of neighborhood, frequency of visitation and activities token part in the parks. Since mobile signal data has the coordinates, characteristics, and timestamp of visitors, researchers would more like to study the accessibility of disparities. Yang et. learned that the parks in Shanghai protected the equality of the disparities. They especially pointed out that the parks were the most inequality at workdays, and people living in different type of housing would affect the equality as well [11]. Additionally, some research collected mobile signal data to find the different frequency in different seasons on three kinds of park visiting. They found travel distant can influence visitors’ frequency [28]. In addition, the activities token part in parks can combine app data and GPS data, so some researchers collected the tracking data in GPS and the activities data in the app data. They concluded the choice of visitors who do sport in parks, which may give suggestions for management of the recreational area in the park [29]. Besides, it also had research that only used app to discover park activities. They collected some sport routes data and found the distance between parks and home could influence the number of visitors [30].
The map data is mainly used to analyze the influencing factors of the visitation in the park and the reason for the number’s change every week. The research used AMAP and weibo check-in data to study 13,759 parks in China and understand the factors of visitation. After considering park attributes, accessibility, and the socioeconomic environment, they found that surrounding environment had significant positive influence while park attribute had negative influence [31]. Besides, Baidu heat map combined mobile phone data to discover the difference of visitation in weekday and workday. The result showed that there were differences in peak time and frequency of visitors at weekend and workday, and visitors occupied the area in various kinds of parks from time to time [32].
In this theme, social media were used to count the number of visitation and the seasonal various of visitation. For example, 340,000 check-in data in Sina micro-blog between 2012 and 2014 were used to count the volume of visitation to find out the park popularity and the future tendency [33]. Twitter was used to figure out seasonal differences in physical activity, and the result showed that outdoor fitness decreased from winter to summer, cycling and water sport kept stable, and team sport and fun sport increase from winter to summer [34].
4.2. Visitors’ Perception
The perception of visitors means the physical and mental feeling of visitors, such as satisfaction, well-being and emotion. There are kinds of social media that can present the objective feelings of visitors, such as Twitter, Facebook, Sina Weibo, and some travel applications. In addition, many researchers started to turn their textual study into visitors’ facial and visional study. These kinds of studies can enrich the range of perception and use diverse dimensions to dig out the objective suggestion of visitors.
There are mainly three kinds of big data that are used to collect the perception of visitors.
Firstly, the textual data and photo data in user days data, such as Twitter, Sina Weibo, and Flickr, are used the most. They always solve the problem in visitors’ happiness, the reason of visitation, and evaluate park services. The geo-located user days data and check-in data in user days data are always used to collect the visitation reasons. In addition, policy makers can also use social media to know the new thought of visitors during COVID-19. Visitors’ happiness can be measured by the concept of tweets. Some study used Twitter to judge the people’s emotion outside and inside the park and found that people had more positive emotion in the park in general [35]. To discover the factor of visitation, some researchers collected photos in Flickr and used Google Cloud Vision to analyze them [36]. The research found that people would be more likely to take natural photos, summarizing the value of the cultural ecosystem service in combination with the spatial distribution [36]. The researchers from the USA studied the city parks in New York by geo-located user days data. They collected the coordinate of visitors and the specific time of visiting from 2005 to 2014 and finally found that the visitation was positively correlated with transportation, athletic facilities, impervious surface, water bodies, but was negative with green space and minority in neighborhoods [37]. Comparing the feelings before and after the pandemic through social media, researchers can know the demand for the great changes in society. The researcher looked up Instagram in Hong Kong, Singapore, Tokyo, and Seoul and discovered that people would like to visit nature parks that are large and close to city centers [38].
Secondly, comment data, such as Ctrip and Tripadvisor, are used to collect comments of visitors to judge their satisfaction for assessing services and landscape in the park. Some research assessed the cultural service by comments in Ctrip by analyzing 19 urban parks in Xuzhou City, China, and figured out the classification of cultural services and the basic analysis of the perception of cultural services [39]. The study used Tripadvisor to analyze the reviews from 2010 to 2018 in Bryant Park, and the result included the collection of topics and frequency of the topic in Bryant Park [40].
Finally, eye-tracking data is new data for studying the perception of urban parks and often deals with the assessment of landscape in the park. The study combined POI and AOI to find out the reasons for how long people stay in the park and assessed the usage of park landscape by analyzing the videos that people shot when they walked in the park [41].
4.3. Visitors’ Effect
When people visit parks, they may make some effect or receive some benefit on society, economy and environment. There are negative and positive effect which visitors may cause, and elements of the effects are diverse. Positive effect includes enhancing the health and education of visitors, and promoting the economy of surrounding parks. However, it also has the negative influence on plants and animals, and accidents may happen when people visit parks.
In this term, five kinds of database can be used to evaluate the effect of visitors, including map data, user days data, transaction data, acoustic data and image data. Map data is always used in judging the social benefit of visitation. The research assessed the public health condition by Open Street Map combining traditional questionnaire and found that low availability to the park restricted people to expend their energy, so it was not good for their health [17]. Besides, research used GIS to find out that trees in parks were linked to mental health of visitors, and poor-quality park environment, such as less clean sitting, may be barriers of physical health [42]. User days data is also used to measure visitors’ health. Research collected the activities happened in urban parks via twitter to assess physical activities in urban parks, because in some literature about public health connects health with parks, the activities happened in the park can enhance the health condition of human [34].
On the other hand, transaction data are used to realize the economic effect of visiting parks. The researchers studied whether visitation of the park would influence economic situation in Korea. The results showed that the economically distressed neighborhoods could get positive effect from the visitation of urban parks, and the surrounding business were influenced by park visitation [43]. Some researchers used acoustic data to test the tolerance of animals, bird and bat in the studies. For instance, 91 bird species in 27 parks in Spain and Portugal were studied, and the researchers found that visitors should keep their voice lower than 50 dB for endangered birds living [44]. In addition, accidents may happen when people visit parks. For example, visitors may get hurt when trees fall down. The Parrot AR.Drone 2.0, which is a light-weight unmanned aerial vehicles, are used in this theme as image data to assess the plant in the park. The tree hazard rating could be assessed by AR.Drone based on six variables: Trunk Condition, Growth, Crown Structure, Insect and Disease, Crown Development, and Life Expectancy [45].
References
- Bigne, J.E.; Andreu, L.; Gnoth, J. The Theme Park Experience: An Analysis of Pleasure, Arousal and Satisfaction. Tour. Manag. 2005, 26, 833–844.
- Ramkissoon, H.; Weiler, B.; Smith, L.D.G. Place Attachment and Pro-Environmental Behaviour in National Parks: The Development of a Conceptual Framework. J. Sustain. Tour. 2012, 20, 257–276.
- Jim, C.Y.; Shan, X. Socioeconomic Effect on Perception of Urban Green Spaces in Guangzhou, China. Cities 2013, 31, 123–131.
- Sanesi, G.; Chiarello, F. Residents and Urban Green Spaces: The Case of Bari. Urban For. Urban Green. 2006, 4, 125–134.
- Wright Wendel, H.E.; Zarger, R.K.; Mihelcic, J.R. Accessibility and Usability: Green Space Preferences, Perceptions, and Barriers in a Rapidly Urbanizing City in Latin America. Landsc. Urban Plan. 2012, 107, 272–282.
- Chen, B.; Song, Y.; Jiang, T.; Chen, Z.; Huang, B.; Xu, B. Real-Time Estimation of Population Exposure to PM2.5 Using Mobile- and Station-Based Big Data. Int. J. Environ. Res. Public Health 2018, 15, 573.
- Maxwell, J. Qualitative Research Design: An Interactive Approach; Sage: New York, NY, USA, 2012.
- Shahriari, B.; Swersky, K.; Wang, Z.; Adams, R.P.; Freitas, N. de Taking the Human Out of the Loop: A Review of Bayesian Optimization. Proc. IEEE 2016, 104, 148–175.
- Jiayi, J.; Ming, C.; Junhua, Z. Analyses of elderly visitors’ behaviors to community parks in shanghai and the impact factors. Landsc. Archit. Front. 2020, 8, 94–109.
- Guo, S.H.; Song, C.; Pei, T.; Liu, Y.X.; Ma, T.; Du, Y.Y.; Chen, J.; Fan, Z.D.; Tang, X.L.; Peng, Y.; et al. Accessibility to Urban Parks for Elderly Residents: Perspectives from Mobile Phone Data. Landsc. Urban Plan. 2019, 191, 103642.
- Xiao, Y.; Wang, D.; Fang, J. Exploring the Disparities in Park Access through Mobile Phone Data: Evidence from Shanghai, China. Landsc. Urban Plan. 2019, 181, 80–91.
- Sangzhaxi, L.; Feng, Z. How to Evaluate Public Space Vitality Based on Mobile Phone Data: An Empirical Analysis of Nanjing’s Parks. Geogr. Res. 2019, 38, 1594–1608.
- Gao, S.; Liu, Y.; Wang, Y.; Ma, X. Discovering Spatial Interaction Communities from Mobile Phone Data. Trans. GIS 2013, 17, 463–481.
- Khoury, M. Big Data Meets Public Health. Science 2014, 346, 1054–1055.
- Lenhart, A.; Purcell, K.; Smith, A.; Zickuhr, K. Social Media & Mobile Internet Use Among Teens and Young Adults. Pew Internet Am. Life Proj. 2010, 6, 1–28.
- Di Minin, E.; Tenkanen, H.; Toivonen, T. Prospects and Challenges for Social Media Data in Conservation Science. Front. Environ. Sci. 2015, 3, 63.
- Hobbs, M.; Griffiths, C.; Green, M.A.; Jordan, H.; Saunders, J.; McKenna, J. Neighbourhood Typologies and Associations with Body Mass Index and Obesity: A Cross-Sectional Study. Prev. Med. 2018, 111, 351–357.
- Song, X.P.; Richards, D.R.; He, P.J.; Tan, P.Y. Does Geo-Located Social Media Reflect the Visit Frequency of Urban Parks? A City-Wide Analysis Using the Count and Content of Photographs. Landsc. Urban Plan. 2020, 203, 103908.
- Ghahramani, M.; Galle, N.J.; Ratti, C.; Pilla, F. Tales of a City: Sentiment Analysis of Urban Green Space in Dublin. Cities 2021, 119, 103395.
- Hassani, H.; Huang, X.; Silva, E.S.; Ghodsi, M. A Review of Data Mining Applications in Crime. Stat. Anal. Data Min. ASA Data Sci. J. 2016, 9, 139–154.
- Lin, Y.Y.; Zhou, Y.H.; Lin, M.S.; Wu, S.D.; Li, B.Y. Exploring the Disparities in Park Accessibility through Mobile Phone Data: Evidence from Fuzhou of China. J. Environ. Manag. 2021, 281, 111849.
- Osaba, E.; Pierdicca, R.; Malinverni, E.S.; Khromova, A.; Alvarez, F.J.; Bahillo, A. A Smartphone-Based System for Outdoor Data Gathering Using a Wireless Beacon Network and GPS Data: From Cyber Spaces to Senseable Spaces. ISPRS Int. J. Geo-Inf. 2018, 7, 190.
- Schwartz, A.J.; Dodds, P.S.; O’Neil-Dunne, J.P.M.; Danforth, C.M.; Ricketts, T.H. Visitors to Urban Greenspace Have Higher Sentiment and Lower Negativity on Twitter. People Nat. 2019, 1, 476–485.
- Liu, P.; Liu, M.N.; Xia, T.T.; Wang, Y.T.; Wei, H.X. Can Urban Forest Settings Evoke Positive Emotion? Evidence on Facial Expressions and Detection of Driving Factors. Sustainability 2021, 13, 8687.
- Cheng, Y.Y.; Zhang, J.G.; Wei, W.; Zhao, B. Effects of Urban Parks on Residents’ Expressed Happiness before and during the COVID-19 Pandemic. Landsc. Urban Plan. 2021, 212, 104118.
- Zhai, Y.J.; Wu, H.B.; Fan, H.C.; Wang, D. Using Mobile Signaling Data to Exam Urban Park Service Radius in Shanghai: Methods and Limitations. Comput. Environ. Urban Syst. 2018, 71, 27–40.
- Liu, Z.H.; Huang, Q.D.; Yang, H.Y. Supply-Demand Spatial Patterns of Park Cultural Services in Megalopolis Area of Shenzhen, China. Ecol. Indic. 2021, 121, 107066.
- Guan, C.; Song, J.; Keith, M.; Zhang, B.; Akiyama, Y.; Da, L.J.; Shibasaki, R.; Sato, T. Seasonal Variations of Park Visitor Volume and Park Service Area in Tokyo: A Mixed-Method Approach Combining Big Data and Field Observations. Urban For. Urban Green. 2021, 58, 126973.
- Korpilo, S.; Virtanen, T.; Lehvavirta, S. Smartphone GPS Tracking-Inexpensive and Efficient Data Collection on Recreational Movement. Landsc. Urban Plan. 2017, 157, 608–617.
- Norman, P.; Pickering, C.M. Factors Influencing Park Popularity for Mountain Bikers, Walkers and Runners as Indicated by Social Media Route Data. J. Environ. Manag. 2019, 249, 109413.
- Li, F.Z.; Li, F.Y.; Li, S.J.; Long, Y. Deciphering the Recreational Use of Urban Parks: Experiments Using Multi-Source Big Data for All Chinese Cities. Sci. Total Environ. 2020, 701, 134896.
- Zhang, S.M.; Zhang, W.S.; Wang, Y.; Zhao, X.Y.; Song, P.H.; Tian, G.H.; Mayer, A.L. Comparing Human Activity Density and Green Space Supply Using the Baidu Heat Map in Zhengzhou, China. Sustainability 2020, 12, 7075.
- Gu, Z.H.; Zhang, Y.; Chen, Y.; Chang, X.M. Analysis of Attraction Features of Tourism Destinations in a Mega-City Based on Check-in Data MiningA Case Study of Shenzhen, China. ISPRS Int. J. Geo-Inf. 2016, 5, 210.
- Roberts, H.; Sadler, J.; Chapman, L. Using Twitter to Investigate Seasonal Variation in Physical Activity in Urban Green Space. Geo-Geogr. Environ. 2017, 4, e00041.
- Plunz, R.A.; Zhou, Y.J.; Vintimilla, M.I.C.; Mckeown, K.; Yu, T.; Uguccioni, L.; Sutto, M.P. Twitter Sentiment in New York City Parks as Measure of Well-Being. Landsc. Urban Plan. 2019, 189, 235–246.
- Richards, D.R.; Tuncer, B. Using Image Recognition to Automate Assessment of Cultural Ecosystem Services from Social Media Photographs. Ecosyst. Serv. 2018, 31, 318–325.
- Hamstead, Z.A.; Fisher, D.; Ilieva, R.T.; Wood, S.A.; McPhearson, T.; Kremer, P. Geolocated Social Media as a Rapid Indicator of Park Visitation and Equitable Park Access. Comput. Environ. Urban Syst. 2018, 72, 38–50.
- Lu, Y.; Zhao, J.T.; Wu, X.Y.; Lo, S.M. Escaping to Nature during a Pandemic: A Natural Experiment in Asian Cities during the COVID-19 Pandemic with Big Social Media Data. Sci. Total Environ. 2021, 777, 146092.
- Dai, P.C.; Zhang, S.L.; Chen, Z.X.; Gong, Y.L.; Hou, H.P. Perceptions of Cultural Ecosystem Services in Urban Parks Based on Social Network Data. Sustainability 2019, 11, 5386.
- Song, Y.; Fernandez, J.; Wang, T. Understanding Perceived Site Qualities and Experiences of Urban Public Spaces: A Case Study of Social Media Reviews in Bryant Park, New York City. Sustainability 2020, 12, 8036.
- Amati, M.; Parmehr, E.G.; McCarthy, C.; Sita, J. How Eye-Catching Are Natural Features When Walking through a Park? Eye-Tracking Responses to Videos of Walks. Urban For. Urban Green. 2018, 31, 67–78.
- Van den Bosch, M.A.; Mudu, P.; Uscila, V.; Barrdahl, M.; Kulinkina, A.; Staatsen, B.; Swart, W.; Kruize, H.; Zurlyte, I.; Egorov, A.I. Development of an Urban Green Space Indicator and the Public Health Rationale. Scand. J. Public Health 2016, 44, 159–167.
- Park, J.; Kim, J. Economic Impacts of a Linear Urban Park on Local Businesses: The Case of Gyeongui Line Forest Park in Seoul. Landsc. Urban Plan. 2019, 181, 139–147.
- Paton, D.; Romero, F.; Cuenca, J.; Escudero, J.C. Tolerance to Noise in 91 Bird Species from 27 Urban Gardens of Iberian Peninsula. Landsc. Urban Plan. 2012, 104, 1–8.
- Kulhavy, D.L.; Unger, D.R.; Hung, I.K.; Zhang, Y.L. Comparison of AR.Drone Quadricopter Video and the Visual CTLA Method for Urban Tree Hazard Rating. J. For. 2016, 114, 517–523.
More
Information
Subjects:
Urban Studies
Contributors
MDPI registered users' name will be linked to their SciProfiles pages. To register with us, please refer to https://encyclopedia.pub/register
:
View Times:
1.2K
Revisions:
2 times
(View History)
Update Date:
24 Jun 2022
Table of Contents


Notice
You are not a member of the advisory board for this topic. If you want to update advisory board member profile, please contact office@encyclopedia.pub.
OK
Confirm
Only members of the Encyclopedia advisory board for this topic are allowed to note entries. Would you like to become an advisory board member of the Encyclopedia?
Yes
No
${ textCharacter }/${ maxCharacter }
Submit
Cancel
Back
Comments
${ item }
|
${ item.createdUser.fullName }
${ item.createdAt }
${ item.vote }
${ item.reply }
Delete
${ reply.createdUser.fullName }
${ reply.createdAt }
${ reply.vote }
Delete
There is no reply to this comment~
${ item.replyTextCharacter }/${ item.replyMaxCharacter }
Submit
Cancel
More
No more~
There is no comment~
${ textCharacter }/${ maxCharacter }
Submit
Cancel
${ selectedItem.replyTextCharacter }/${ selectedItem.replyMaxCharacter }
Submit
Cancel
Confirm
Are you sure to Delete?
Yes
No