Submitted Successfully!
To reward your contribution, here is a gift for you: A free trial for our video production service.
Thank you for your contribution! You can also upload a video entry or images related to this topic.
Version Summary Created by Modification Content Size Created at Operation
1 -- 4970 2022-05-19 09:09:50 |
2 format correct + 38 word(s) 5008 2022-05-20 04:07:40 |

Video Upload Options

Do you have a full video?

Confirm

Are you sure to Delete?
Cite
If you have any further questions, please contact Encyclopedia Editorial Office.
Ajith, A.; Milnes, P.; , .; Lockyer, N. Mass Spectrometry Imaging of Plant Vegetative Parts. Encyclopedia. Available online: https://encyclopedia.pub/entry/23108 (accessed on 27 July 2024).
Ajith A, Milnes P,  , Lockyer N. Mass Spectrometry Imaging of Plant Vegetative Parts. Encyclopedia. Available at: https://encyclopedia.pub/entry/23108. Accessed July 27, 2024.
Ajith, Akhila, Phillip Milnes,  , Nicholas Lockyer. "Mass Spectrometry Imaging of Plant Vegetative Parts" Encyclopedia, https://encyclopedia.pub/entry/23108 (accessed July 27, 2024).
Ajith, A., Milnes, P., , ., & Lockyer, N. (2022, May 19). Mass Spectrometry Imaging of Plant Vegetative Parts. In Encyclopedia. https://encyclopedia.pub/entry/23108
Ajith, Akhila, et al. "Mass Spectrometry Imaging of Plant Vegetative Parts." Encyclopedia. Web. 19 May, 2022.
Mass Spectrometry Imaging of Plant Vegetative Parts
Edit

The detection of chemical species and understanding their respective localisations in tissues have important implications in plant science. The conventional methods for imaging spatial localisation of chemical species are often restricted by the number of species that can be identified and is mostly done in a targeted manner. Mass spectrometry imaging combines the ability of traditional mass spectrometry to detect numerous chemical species in a sample with their spatial localisation information by analysing the specimen in a 2D manner. An insight into the spatial localisations of different chemicals in the plant system can be instrumental in understanding the movement and localisation of plant biochemicals and xenobiotics as well as their responses to different stress and metabolic pathways.

mass spectrometry plant chemical imaging

1. Introduction

Understanding the physiological processes and associated molecular changes in plant systems is of paramount importance in numerous fields of studies associated with plants. Deciphering the molecular compositions of plants in a reliable, reproducible and precise manner can help uncover metabolic changes associated with growth, structure, stress, whole-plant resource allocation, plant–environment interactions, xenobiotic metabolism, etc. [1][2]. Metabolism in plants usually refers to endogenous metabolites involved in inherent physiological processes in plants. However, it is not limited to these, as xenobiotic compounds absorbed into the plant often undergo molecular degradation and modification in the plant systems. Plants produce an enormous wealth of primary and secondary metabolites as a result of the biochemical processes occurring within their systems and several methodologies are available to understand and analyse these. The metabolic composition of a system can be investigated in two ways, either in an untargeted fashion or in a targeted manner where the identity of the target molecule is known. Hence, the method adopted for chemical analysis may vary with the needs of the experiment.
Generally, for any kind of metabolic investigations, the most sought-after methods include the different kinds of mass spectrometric approaches such as gas chromatography-mass spectrometry (GC-MS), liquid chromatography-mass spectrometry (LC-MS) and capillary electrophoresis-mass spectrometry (CE-MS) alongside nuclear magnetic resonance (NMR) spectroscopy [3]. Although these methods are well-established and can shed light on the molecular compositions and aberrations in a system of interest, the spatial information associated with localisation and movement of the biochemicals is unavailable as most of these techniques use homogenised samples. An insight into the spatial localisations of different chemicals in the plant system can be instrumental in understanding the movement and localisation of plant biochemicals and xenobiotics as well as their responses to different stress and metabolic pathways [4]. Fuelled by such motives, there has been a growing interest in the spatial profiling of metabolites over the past years in plant biology and this has been mostly achieved by immunohistochemistry, fluorescence microscopy or in situ hybridisation [5]. However, the experiments conducted using such techniques are limited to the visualisation of very few specific chemicals. In addition to the above-mentioned techniques, autoradiography is prominently used in agrochemical research to understand the uptake and translocation of xenobiotics in plant systems. Even though this technique is sensitive and produces quantifiable results [6] with reported spatial resolutions as low as 100 µm [7], there are several limitations including the time to synthesise radiolabelled compounds, along with the cost and safety concerns. In addition to these constraints, autoradiography does not discriminate between the chemicals of interest and their metabolites in the plant systems, as images are generated concerning all molecules, showing the radiolabelling and they do not detect those lacking the radioisotope.
Mass spectrometry imaging (MSI) is gaining popularity as a mainstream method for spatial metabolic profiling as it addresses the limitations of these commonly used techniques to a large extent. Technical and methodological advances in the capabilities of MSI techniques in the past two decades make it possible to detect a wide array of biochemicals from small molecules to large proteins with high spatial resolution. In many cases, minimal sample preparation conserves the spatial information and increases the throughput of the experiment. The most popular MSI techniques currently in use are matrix-assisted laser desorption ionisation MSI (MALDI MSI), desorption electrospray ionisation MSI (DESI MSI), secondary ion mass spectrometry imaging (SIMS imaging) and laser ablation electrospray ionisation MSI (LAESI MSI). The reliability of MSI data in chemical analysis is evident from its application in studies associated with disease diagnosis [8][9][10], forensics [11][12], food analysis [12][13][14][15], analysis of environmental pollutants [16][17] and plant metabolite analysis. According to the needs of the experiment, the ideal MSI techniques can be chosen considering the spatial resolution and range of detection of analyte concentration and targeted mass-to-charge (m/z) values [18][19]

2. Mass Spectrometry Imaging of Plant Vegetative Parts

2.1. Endogenous Compounds

The ability of MSI technologies to image a multitude of chemical species at the same time makes it a valuable approach to understanding the chemical localisation in plant systems. The availability of high spatial resolution information along with the quantitative and qualitative data for a broad range of chemical species is unparalleled for MSI in comparison to the other contemporary technologies. The following sections focus on the applications of common MSI techniques to image endogenous metabolites in plant leaves, roots and stems.

2.1.1. MALDI Imaging Studies

The first application of MSI to analyse vegetative plant parts was to image agrochemicals in soybean leaf [20] at the start of the 21st century. Since then, the number of studies utilising MSI in plant science has been steadily increasing year after year [4]. In one of the initial studies, MALDI was used to image the distribution of water-soluble oligosaccharides in the stems of Triticum aestivum (wheat). Water-soluble oligosaccharides were being investigated as a potential indicator for grain yield [21] and the positive ionisation mode MALDI detected the potassium adducts of a range of oligosaccharides up to Hex11 with α- CHCA matrix.
Being a very important model species to understand plant physiology [22], there have been numerous studies with MSI to understand the chemical localisation of compounds in Arabidopsis thaliana. An early MALDI MSI study was performed to assess the feeding patterns of lepidopteran larvae in A. thaliana leaves [23]. The spatial distribution of glycosinolate, a compound involved in the plant defence [22], was assessed in negative ion mode MALDI with a 9-AA matrix. The observation of an abundance in glycosinolates in the midvein and periphery of leaves compared to other parts of the leaf, validated with HPLC analysis, led the authors to conclude that the preferential localisation of these compounds has profound roles in plant defence mechanisms. This study demonstrated the usefulness of MSI in understanding the chemical distributions of compounds to access different situations and phenomena associated with the plant system. Following this study, the authors did another investigation on the same plant species to develop a new MALDI imaging protocol in negative ion mode to image only the surface glycosinolates in the leaves [24]; the major difference in the protocol being that the 9-AA matrix was deposited now by sublimation rather than with an airbrush. In addition to imaging, surface quantification was performed with the aid of standards and it was found that the abaxial surface of the leaves contained about 50 pmol/mm2 surface area of the leaf with the adaxial surface having about 15–30% less (Figure 1). In contrast to the earlier results mentioned before, here, the surface distribution was relatively uniform with more abundance in the midrib and periphery of the leaf. LAESI and liquid extraction surface analysis (LESA) helped the authors to validate the distribution patterns observed. Another important class of molecules involved in plant defence mechanisms are the cyclic peptides, cyclotides which have insecticidal properties [25]. In an attempt to study novel cyclotide precursors in hybrid petunia leaves, MALDI was used in conjugation with genetic studies to identify and understand the localisations of potential cyclotide peptides [26]. MALDI imaging in positive ion mode with CHCA matrix identified 4 potential cyclotides with one being identified as Phyb A and the rest unidentified. The suspected species localised mostly in the vasculature of the leaf much akin to the potential roles in plant defence.
Figure 1. Quantification of glucosinolates on the surface of A. thaliana leaves. For the quantification study with MALDI-MSI: (a) A solution of internal standard (2-propenylglucosinolate) was mixed with a fluorescent dye and transferred with a pin array spotter to the leaf surface; (b) The quality of spotting was checked by a fluorescence scan; (c) The spotted leaves were covered with 9-aminoacridine matrix by sublimation and measured by MALDI-TOF mass spectrometry in the negative mode; (d) Collected data were analysed with Biomap software. Figure reproduced with permission from Shroff et al. [24].
In another example with A. thaliana, the surface waxes on leaves were imaged with MALDI in both positive and negative ion mode with the lithium adduct of DHB as matrix [27]. Even though the laser irradiation time was longer than it would have been for polar target molecules, this study proved the ability of MALDI MSI to image neutral molecules such as wax esters and hydrocarbons in biological samples. The power of MSI in plant physiological experiments was also demonstrated in a study by Griffiths et al., using MALDI with CHCA matrix to visualise the effect of chemical intervention in the trehalose-6-phospate pathway in A. thaliana leaves [28]. With positive and negative ion mode MALDI studies, along with SIMS and plant physiological studies, artificial precursors to sugar were seen to increase grain size and total sugar production of the plant species. These results provide an alternate path to crop yield improvement through ‘biosynthetic amplification’ compared to the genomic methods.
Saccharides and surface waxes are essential to the survival of the plant system and are abundant in the plant biome, but the most abundant biopolymer present in the biological systems and in the world is cellulose [29]. The wide applicability of cellulose in paper manufacturing, food industry and as an alternative biofuel makes its spatial characterisation an important analytical problem [30]. For MALDI imaging of cellulose, DHB was found to be an ideal matrix by Jung et al., with microcrystalline cellulose standards compared to other popular matrices such as CHCA and sinapinic acid in positive ion mode [31]. The choice of matrix was also justified when the stem sections of Populus deltoides were imaged for cellulose. In another independent study with P. deltoides [32], MALDI with a linear ion trap for tandem MS measurements was used to image cellulose and hemicellulose in the stem sections in a more specific way, eliminating isobaric ions. In this study, too, with the help of microcrystalline cellulose and hemicellulose standards, DHB matrix was found to be the best for positive ion imaging compared to other matrices considered.
Lipids in plants have storage functions, roles in plant defence and are signalling molecules [33], making the chemical mapping of lipid species in plants with MSI an important question for lipidomic investigations. In an early study to image lipids with MALDI, the lipid content of barley seed and tobacco root (Nicotiana tabacum) was assessed with HCCA and DHB as matrices in positive ion mode [34]. Lysophosphatidylcholines were identified and imaged, correlating with the data from standards and tandem MS measurements. An interesting investigation that utilised MALDI to image lipids was to understand the distribution of triacylglycerol in a transgenic model of N. tabacum leaves [35]. MALDI with DHB as matrix along with other mass spectrometry techniques such as GC-MS and tandem mass spectrometry revealed that the transgenic species of N. tabacum has a 15% more content of triacyl glycerol compared to the wild type. When comparing with the large biomass oil crops, such genomic changes can drastically affect the total oil yield relating to crops.
Root nodules in plants form as a result of a symbiotic relationship between the rhizobium bacteria and the plant to convert atmospheric nitrogen to ammonia for the plant [36]. An example of such a relationship exists between the plant Medicago truncatula and the rhizohium bacteria, Sinorhizobium meliloti. MALDI-MSI was used in an attempt to analyse the metabolic disparities in the root nodules formed by the symbiotic relationship [37]. With the complementary use of DHB and DMAN matrices in positive ionisation mode, the authors identified amino acids, organic acids, carbohydrates and flavonoids in the samples. Statistical data analysis performed with ClinProTools [38] showed that the root nodules contained higher glutamine and sucrose compared to the roots. In the 3D PCA plot, root and root nodule samples revealed very distinct distribution patterns implying distinct metabolic levels. In a subsequent study by the same group, the effect of salt stress on root nodules on the same species was studied [39]. In these experiments, in addition to MALDI wherein the system operated in a vacuum state, an atmospheric pressure MALDI (AP-MALDI) system was also used. The imaging experiments performed in positive ion mode were done with two matrices, DHB and CHCA, and were complemented by the tandem MS data of ion signals of interest. As a result of the Discriminative Analysis done with Receiver-Operating Characteristics (ROC), it was identified that control samples were enriched in asparagine, adenosine and nicotianamine, and the salt-treated samples in arginine and soyasaponin I. Even though AP-MALDI could achieve a higher resolution with smaller laser spot size, vacuum MALDI was able to detect significantly more m/z values.
Being sessile organisms, plants have developed several chemical mechanisms to cope with stress or situations of unfavourable growth conditions [40]. One such chemicals released in plants in response to biotic and abiotic stresses are the phytoalexins which are also known to induce antifungal activity [41]. When grapevine leaves were subjected to stress by exposure to UV-C radiation, MALDI in negative ion mode was able to find the peculiar localisations of phytoalexin compounds Resveratrol, Pterostilbene and Viniferins [42]. Although many matrices were tested, DHB gave the best results for imaging these phytoalexins. All three compounds of interest showed heterogenous distribution with co-localisations in the veins. In another study, Kaempferol-3-O-galactoside [trifolin + Na]+, a galactose-conjugated flavanol exhibiting antifungal and anti-cancer effects [42], was imaged in high abundance in the veins of the clover leaf with an atmospheric pressure MALDI MSI system [43]. With CHCA as matrix, the AP-MALDI could image these biological samples in atmospheric pressure conditions.
Ginkgo biloba is considered a ‘living fossil’ being the only extant member of the division of Ginkgophyta [44]. The roots, stem, leaves and seeds of G. biloba are a source of various bioactive metabolites, especially the leaves, which contains numerous secondary metabolites of pharmacological interest [45]. With MALDI and LDI MSI, Li et.al was able to image several metabolites on the surface of G. biloba leaves including rare flavonoid cyclodimers along with other substrates such as chlorophyll, phospholipids and saccharides [46]. The studies were utilised to obtain metabolic data in both positive and negative ion modes with CHCA and 9-AA as matrices, respectively. The relative quantification study done using selected flavonoids with LC-MS showed a slightly higher flavonoid content, in general, in the upper epidermis compared to the lower as seen in Figure 2.
Figure 2. Cross-sections of ginkgo leaves imaged in positive mode MALDI showing images of selected flavonoid ions, including aglycones (m/z 271.0601–317.0655), biflavonoids (m/z 539.0973– 583.1235), glycosides (m/z 617.1477–795.1745) and biginkgosides (m/z 1519.3537–1551.3435) in ginkgo leaf. Ion images were recorded with a step size of 50 μm. The mass accuracy was less than 2 ppm and a bin width of m/z = ±5 ppm was used for image generation. Images represent the protonated, sodium and potassium adducts of metabolites. Glc: glucoside/glucosyl moiety; K: kaempferol; Rha: rhamnoside/rhamnosyl moiety; Q: quercetin. Figure reproduced with permission from Li et al. [46].
Among the many factors affecting the spatial resolution of a MALDI MSI experiment, the spot size of the laser beam focus is very significant. In an attempt to achieve higher spatial resolution, Korte et al. adapted an instrument modification concept of Caprioli and co-workers [47][48], and modified the laser optics of a MALDI linear ion trap (LIT) Orbitrap mass spectrometer to image maize leaves in sub-cellular resolution with the use of 1,5-Diaminonaphthalene (DAN) matrix in negative ion mode [49]. The modified instrument allowed the detection and imaging of a variety of compounds including amino acids, ascorbic acid, phenolics, benzoxazinone derivatives, sugars and phosphate sugars, flavonoids and flavonoid glycosides and glycerolipids. Even though the achievable laser spot size was around 5 μm, for sufficient ion signals, 9 μm was considered a more practical laser spot size. In a subsequent attempt by the same group, a practical laser spot size of 5 μm was achieved by combining spatial filtering, beam expansion and reduction of the final focal length [50]. With maize root samples, the new MALDI system could image several molecules including phosphocholines and disaccharides in positive ion mode with DHB matrix. A feature of this system was that a user selectable laser spot size of ~4, ~7 and ~45 μm was subsequently achievable in about 5 min through an interchanging of the beam expander component. In another attempt to improve the resolution of MALDI MSI, Spengler and co-workers developed the atmospheric pressure scanning microprobe matrix-assisted laser desorption/ionisation mass spectrometer (AP-SMALDI) [51]. This novel system can image plant metabolites at cellular levels as demonstrated by Li et al. [52], where AP-SMALDI was used to analyse several plant secondary metabolites including gallotanins and monoterpene glucosides in Paeonia lactiflora roots. Another factor that affects the quality of images obtained with MALDI is the self-ionisation of matrix that interferes mostly with the ion signals in lower m/z values (~500 Da) [53]. For example, plant hormones are involved in signalling crosstalk and the basic physiological responses of cell [54], but being in the low mass range, many of them are not effectively detected with MALDI due to the chemical noise. With the introduction of Fe nanoparticles (Fe NPs) as the matrix, Shiono et al. [55] tried to circumvent this issue to image lower molecular mass plant hormones in positive ion mode in the leaves of the rice plant. When the results were compared with that of DHB matrix, nanoparticle assisted laser desorption ionisation (nano-PALDI) imaging was able to detect at least 4 more plant hormones and their precursors than MALDI.

2.1.2. SIMS Imaging

The minimal sample preparation and the high spatial resolution are two of the factors for the increasing interest in SIMS for metabolic imaging, either used alone or in conjunction with other MS methods. Li et al. investigated the saccharides in switchgrass (Miscanthus Χ giganteus) roots with LDI MSI and SIMS imaging with gold primary ion source in positive and negative ion modes [56]. Several surface additives were used to check the signal improvements such as Au coating on samples and matrix enhancement with CHCA and DHB. The authors observed that in LDI MSI, a thin Au coating and DHB improved the signal intensity, and CHCA did not drastically affect the intensities. No one condition could image all the metabolites of interest and hence it required information from all the surface conditions for a complete overview. Unlike in LDI, the Au coating did not improve the signal intensities for SIMS and interestingly, it was seen that the non-coated section displayed higher quality images in negative than the positive ion mode.
In many trees, the central part of the wood is dark with a high density of organic solvent extractable compounds surrounded by lighter coloured sapwood. In Japanese cedar (Cryptomeria japonica), SIMS could identify exclusive ion signals of ferruginol, a diterpene phenol in high intensity in the heartwood tissue and not the sapwood tissue taken with a Ga+ ion beam in positive ion mode [57]. Although exclusive to heartwood, ferruginol was seen to uniformly distribute in the heartwood part of the wood tissue. In a following study by the same group, specific chemicals could be detected in the sapwood and heartwood-sapwood boundary in a 1500-year-old sample of Hinoki cypress (Chamaecyparis obtusa), helping to distinguish them in a visibly indistinguishable sample [58]. Using a Au+ primary beam in both secondary ion polarities, chemical substances hinokinin, hinokiresinol, hinokione and hinokiol were observed to be accumulated in the heartwood-sapwood boundary. Among these chemicals, only hinokinin was seen to accumulate in the ray parenchyma cells. This study is another example for the ability of SIMS in imaging even minute chemicals in biological samples such as wood tissue.
In another innovative study, Zhao et al. used a combination of Bi3+ SIMS with C60+ sputtering to image single-cell walls for the presence of syringyl (S) and guaiacyl (G) lignins in Populus trichocarpa wood tissue [59]. With positive ion mode imaging, the S-lignins were predominantly located in the fibre cell walls and the G-lignins in the vessel cell walls. The G/S-lignin ion intensity ratio in vessel cell walls was found to be double that in fibre cell walls, thus agreeing with the earlier study with UV microscopy which gave similar results [60]. In another study, G- and S-lignin levels were evaluated in the wood tissue of maple trees [61]. With Au+ ion beam in positive mode, the vessel walls were seen to be rich in G-lignin with varied S/G ratios through the growth ring in which the earlywood was seen to be rich in S-lignin and latewood had comparatively lesser. Both studies demonstrate the utility of SIMS in analysing the lignin composition in wood.
By providing the highest resolution among other mass spectrometry imaging techniques, SIMS is well-suited to analyse cellular localisation of metabolites and intermediates to understand the basic biochemistry. When SIMS was used to image γ-lactones and its intermediates in Sextonia rubra [62], some surprising observations were made contrary to the established metabolic pathways. SIMS in positive ion mode with Bi3+ ion beam for analysis and Ar1000+ for sputter could identify 5 γ-lactones including rubrynolide and rubrenolide along with the intermediates and their cellular localisation in the wood tissue samples. In light of the surprising new data obtained, the authors proposed a revised metabolic route for rubrynolide involving a reaction between 2-hydroxysuccinic acid and 3-oxotetradecanoic acid in place of an earlier biosynthesis with a single polyketide synthesis [63].
High resolution MSI provides huge data sets which, when the appropriate data analysis tools are used, can yield significant information. When SIMS was performed on the leaves of P. trichocarpa leaves, multivariate data analysis could detect chemical localisations and diverse patterns underlying the leaf surface [64]. The Bi3+ cluster ion beams in positive and negative ion modes detected several alcohols, hydrocarbons and wax esters in the epicuticular layer on the surface of the leaf similar to the MALDI data taken as reference, but with higher spatial resolution. For PCA, with 19 ions as variables, only a small number of principal components were sufficient to establish the maximum variability in the data. To complement the PCA data, when five-factors multivariate curve resolution (MCR) was done, distinct patterns of islets were apparent from the score plots. However, the authors recommend that the multivariate analysis, when done using cluster analysis, gives the best results as they showed more localisation and distinct chemical specificity.

2.2. Crop-Protection Products

Xenobiotics refer to any foreign chemical introduced to a biological system be it animal or plant [65]. The main xenobiotics of interest imaged in plants are agrochemicals or crop-protection products including insecticides, herbicides and pesticides. The field of crop protection product imaging with MSI is quite unexplored (Table 1) when compared to the wealth of studies done to image endogenous plant chemicals. However, the need to understand and image the distribution and localisation of various agrochemicals are becoming critical in the present times when a global food crisis is an imminent possibility [66].
Table 1. MSI studies to image crop-protection products in plant vegetative structures.
MSI Technique Plant Species Agrochemical Type of Uptake Reference
MALDI Soy Mesotrione (Herbicide)
Azoxystrobin (Fungicide)
Leaf and root [20]
MALDI Sunflower Nicosulfron (Herbicide) Leaf and root [67]
MALDI Wheat Epoxiconazole
Azoxystrobin
Pyraclostrobin (All fungicides)
Leaf [68]
MALDI Tomato Metalaxyl (Fungicide) Root [69]
DESI Cotoneaster horizontalis

Kalanhoe blossfeldiana
Rapeseed oil and pyrethrins

Imidacloprid and Methiocarb

Dimethoate
(All insecticides)
Leaf


Leaf


Root
[70]
LA-APCI Tomato Isotianil (Fungicide) Leaf [71]
Nano-PALDI Flowering cabbage Chlorantraniliprole
(Insecticide)
Leaf [72]
Conventionally, autoradiography has been used to image the uptake and translocation of crop protection products in plant systems for agrochemical research [73]. In autoradiography, the radiolabelled compounds of interest are either applied in the foliage or mixed in the nutrient solution in hydroponic systems to study the foliar and shoot uptake, respectively [73][74][75]. Although widely used, the need for tedious synthesis of radiolabelled compounds and the ambiguity in distinguishing the principal compound and metabolites along with the safety concerns, necessitates the availability of an alternative approach to autoradiography. Mass spectrometry imaging provides such an option, being an untargeted screening method with a relatively easier and fast sample preparation methodology.
The earliest study with plants to image xenobiotics was done in soy plants to image the herbicide, Mesotrione, and the fungicide, Azoxystrobin with MALDI MSI [20]. For direct and indirect imaging (with blotting), the leaves were spotted with 1 μL droplets of Mesotrione (1.7 mg/mL) and Azoxystrobin (1.8 mg/mL) in 50:50 acetone/0.1% Tween20 and the samples were imaged at different time periods after application. Azoxystrobin was imaged in negative ion mode with SA matrix and Mesotrione in positive ion mode with CHCA matrix. Along with leaf surface detection for both the compounds, the authors also imaged the uptake of Azoxystrobin through the roots of the plants to the stem by spiking the growth medium until a concentration of 40 ppm was achieved with Azoxystrobin. Spiking individual plants growing in hydroponics with Azoxystrobin also enabled the shoot mobility analysis experiments which were performed 48 h after application. This showed that Azoxystrobin was indeed absorbed through the roots of the plant and was translocated through the stem. In a similar study Nicosulfron, a pyramidylsulfonyl urea herbicide, was imaged in sunflower plants with MALDI MSI in positive ion mode with CHCA matrix [67]. This study looked into both the foliar as well as the shoot uptake of the herbicide. For the shoot uptake experiments, the growth solution of the plant was spiked until a concentration of 40 ppm was reached, and for the foliar uptake, 1 μL aliquots of 1.25 mg/mL Nicosulfron in 50:50 acetonitrile/Tween was applied and sections varying in lengths from the plants were taken later for analysis. Interestingly, the major metabolites used for imaging in these experiments were formed by the breaking of the urea bonds in the substituted pyramidylsulfonyl urea herbicide. In a study by Annangudi et al. [68] on wheat leaf surfaces, MALDI MSI was used to detect 500 ng of commercial fungicides Epoxiconazole, Azoxystrobin and Pyraclostrobin in 1 µL drops on the leaf surfaces. The imaging studies done with DHB matrix in positive ion mode could even detect Pyraclostrobin in amounts as low as 60 ng in 1 µL droplets. The field application study performed also showed promising results as the fungicides could be visualised when applied at a field rate of 100 gai/ha in 200 L water using a track sprayer system.
Although most studies involving agrochemical compound imaging have been done with MALDI, researchers have also applied other MSI methodologies for imaging. An example is that of an investigation to analyse contact and systemic pesticides with DESI MSI in positive ion mode [70]. The authors considered two commercial contact insecticide sprays for the experiments on Cotoneaster horizontalis, one containing natural insecticides pyrethrin and rapeseed oil, and the second containing synthetic insecticides, Imidacloprid and Methiocarb. Even though both natural and synthetic contact pesticides were subjected to similar spraying methods and drying time of 30 min, the latter showed a more homogeneous distribution compared to the former. For the systemic insecticide experiment, dimethoate tablets were spiked into the soil to gain a concentration of 33 mg/kg of the soil of Kalanchoe blossfeldiana and were detected in the transport system of the plant in 25 days. The stem cross sections showing the distribution of associated ions can be seen in Figure 3d–f along with the associated MS spectra in Figure 3a. After 60 days of application of dimethoate, the presence of it was detected as a homogenous distribution in the leaves.
Figure 3. Images obtained from the dimethoate experiment on Kalanhoe blossfeldiana to see root uptake: (a) DESI mass spectrum of protonated dimethoate and sodium adduct detected in spiked soil; (b) Optical image of Kalanchoe stem cross-section; (c) Enlarged area of stem section to improve visualisation of xylem and phloem area; (df) Distribution of dimethoate in the plant stem, detected as protonated species, sodium and potassium adduct; (gi) DESI-MS images of different naturally occurring substances. Pixel size of the DESI-MSI experiment was set to 60 μm. Figure reproduced with permission from Gerbig et al. [70].
MSI can also be performed in conjunction with other analytical techniques to yield a more holistic result providing a broad wealth of information. The common methods usually used with MSI for multimodal imaging include vibrational spectroscopic methods including Fourier transform infrared (FTIR) and confocal Raman microscopy (CRM) [76], fluorescence microscopy [77], Liquid extraction surface analysis (LESA) [78], etc., to name a few. An example of this in the field of plant biology is a multimodal study to analyse the phenylamide fungicide Metalaxyl in tomato plants where LC-HRMSn (liquid chromatography-high resolution accurate mass spectrometry), autoradiography and MALDI MSI with CHCA matrix in positive ion mode were used together to aid in identification and quantification [69]. In this study, with hydroponic systems containing 0.2 ppm Metalaxyl concentration, extensive metabolism of the parent compound was observed after 10 days in shoots and leaves but the parent compound was only detected in the roots.
In another study, a novel probe design combining electrospray ionisation (ESI) and atmospheric pressure chemical ionisation (APCI) compatible with the LAESI instrument was introduced to study the translocation of fungicide Isotianil and its metabolite in tomato leaves [71]. Leaves were spotted with 10 µL of commercial fungicide formulation having a concentration of 250 ppm at the base of the leaf. The novel probe was seen to provide improved pixel to pixel repeatability for LA-APCI than the traditional LAESI in both ionisation modes. The applicability of this novel design was demonstrated by its ability to investigate the translocation of Isotianil and its metabolite, anthranilonitrile, showing the movement of anthranilonitrile from treated to untreated leaves. Innovation and novel strategies can also be adapted to improve the sample preparation methods. An example of a study, along these lines is by Wu et al. where a gold nanoparticle immersed paper was used for imprinting for laser desorption ionisation MSI (LDI MSI) to image a carrier-mediated form of the insecticide, chlorantraniliprole, in flowering cabbage leaves [72]. Generally, porous Teflon and TLC materials are used for imprinting [79][80], but low laser absorption and surface charge accumulation associated with these materials are often not ideal for laser-based MSI techniques. The flowering cabbage leaves were brushed with 10−4 mol/L of chlorantraniliprole and air-dried to prepare samples for imprinting. The nanoparticle imprinted paper seemed to show an improved ionisation efficiency while imaging the alanine ethyl ester-chlorantraniliprole conjugate (CAP-Ala), the carrier-mediated pesticide. With the aid of the nanoparticle imprinted paper, the authors observed that the carrier-mediated pesticide moved faster than the native pesticide towards the phloem and the primary vein.

References

  1. Hu, W.; Han, Y.; Sheng, Y.; Wang, Y.; Pan, Q.; Nie, H. Mass spectrometry imaging for direct visualizetion of components in plants tissues. J. Sep. Sci. 2021, 44, 3462–3476.
  2. Sulpice, R.; McKeown, P.C. Moving Toward a Comprehensive Map of Central Plant Metabolism. Annu. Rev. Plant Biol. 2015, 66, 187–210.
  3. Salem, M.A.; de Souza, L.P.; Serag, A.; Fernie, A.R.; Farag, M.A.; Ezzat, S.M.; Alseekh, S. Metabolomics in the Context of Plant Natural Products Research: From Sample Preparation to Metabolite Analysis. Metabolites 2020, 10, 37.
  4. Boughton, B.A.; Thinagaran, D.; Sarabia, D.; Bacic, A.; Roessner, U. Mass spectrometry imaging for plant biology: A review. Phytochem. Rev. 2015, 15, 445–488.
  5. Bhandari, D.R.; Wang, Q.; Friedt, W.; Spengler, B.; Gottwald, S.; Römpp, A. High resolution mass spectrometry imaging of plant tissues: Towards a plant metabolite atlas. Analyst 2015, 140, 7696–7709.
  6. Rubio, G.; Sorgonà, A.; Lynch, J.P. Spatial mapping of phosphorus influx in bean root systems using digital autoradiography. J. Exp. Bot. 2004, 55, 2269–2280.
  7. Jacobsen, S.C.; Speth, N.R.; Xiong, M.; Herth, M.M.; Kristensen, J.L.; Palner, M.; Janfelt, C. Desorption Electrospray Ionization Mass Spectrometry Imaging of Cimbi-36, a 5-HT2A Receptor Agonist, with Direct Comparison to Autoradiography and Positron Emission Tomography. Mol. Imaging Biol. 2021, 23, 676–685.
  8. Boaru, S.G.; Merle, U.; Uerlings, R.; Zimmermann, A.; Flechtenmacher, C.; Willheim, C.; Eder, E.; Ferenci, P.; Stremmel, W.; Weiskirchen, R. Laser ablation inductively coupled plasma mass spectrometry imaging of metals in experimental and clinical Wilson’s disease. J. Cell. Mol. Med. 2015, 19, 806–814.
  9. Ifa, D.R.; Eberlin, L.S. Ambient Ionization Mass Spectrometry for Cancer Diagnosis and Surgical Margin Evaluation. Clin. Chem. 2016, 62, 111–123.
  10. Touboul, D.; Roy, S.; Germain, D.P.; Chaminade, P.; Brunelle, A.; Laprévote, O. MALDI-TOF and cluster-TOF-SIMS imaging of Fabry disease biomarkers. Int. J. Mass Spectrom. 2007, 260, 158–165.
  11. Yeh, K.; Burr, W.S.; Stock, N.L.; Stotesbury, T. Preliminary analysis of latent fingerprints recovered from underneath bloodstains using matrix-assisted laser de-sorption/ionization fourier-transform ion cyclotron resonance mass spectrometry imaging (MALDI FT-ICR MSI). Forensic Chem. 2020, 20, 100274.
  12. Yoshimura, Y.; Zaima, N.; Yukihiro, Y. Application of Mass Spectrometry Imaging for Visualizing Food Components. Foods 2020, 9, 575.
  13. Morisasa, M.; Sato, T.; Kimura, K.; Mori, T.; Goto-Inoue, N. Application of Matrix-Assisted Laser Desorption/Ionization Mass Spectrometry Imaging for Food Analysis. Foods 2019, 8, 633.
  14. Nielen, M.W.; van Beek, T.A. Macroscopic and microscopic spatially-resolved analysis of food contaminants and constituents using laser-ablation electrospray ionization mass spectrometry imaging. Anal. Bioanal. Chem. 2014, 406, 6805–6815.
  15. Hickert, S.; Cramer, B.; Letzel, M.C.; Humpf, H.-U. Matrix-assisted laser desorption/ionization time-of-flight mass spectrometry imaging of ochratoxin A and fumonisins in mold-infected food. Rapid Commun. Mass Spectrom. 2016, 30, 2508–2516.
  16. Wang, T.-T.; Ying, G.-G.; Shi, W.-J.; Zhao, J.-L.; Liu, Y.-S.; Chen, J.; Ma, D.-D.; Xiong, Q. Uptake and Translocation of Perfluorooctanoic Acid (PFOA) and Perfluorooctanesulfonic Acid (PFOS) by Wetland Plants: Tissue- and Cell-Level Distribution Visualization with Desorption Electrospray Ionization Mass Spectrometry (DESI-MS) and Transmission Electron Microscopy Equipped with Energy-Dispersive Spectroscopy (TEM-EDS). Environ. Sci. Technol. 2020, 54, 6009–6020.
  17. Villette, C.; Maurer, L.; Wanko, A.; Heintz, D. Xenobiotics metabolization in Salix alba leaves uncovered by mass spectrometry imaging. Metabolomics 2019, 15, 122.
  18. Ye, H.; Gemperline, E.; Li, L. A vision for better health: Mass spectrometry imaging for clinical diagnostics. Clin. Chim. Acta 2012, 420, 11–22.
  19. Porta Siegel, T.; Hamm, G.; Bunch, J.; Cappell, J.; Fletcher, J.S.; Schwamborn, K. Mass Spectrometry Imaging and Integration with Other Imaging Modalities for Greater Molecular Understanding of Biological Tissues. Mol. Imaging Biol. 2018, 20, 888–901.
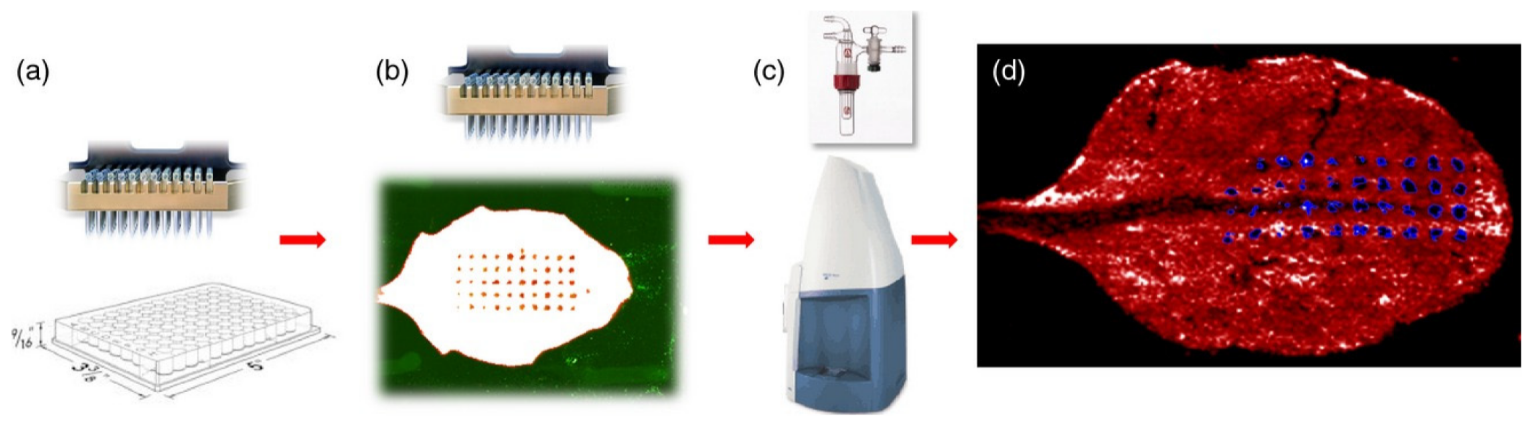
  20. Mullen, A.K.; Clench, M.R.; Crosland, S.; Sharples, K.R. Determination of agrochemical compounds in soya plants by imaging matrix-assisted laser desorption/ionisation mass spectrometry. Rapid Commun. Mass Spectrom. 2005, 19, 2507–2516.
  21. Ford, M.A.; Blackwell, R.D.; Parker, M.L.; Austin, R.B. Associations between Stem Solidity, Soluble Carbohydrate Accumulation and Other Characters in Wheat. Ann. Bot. 1979, 44, 731–738.
  22. Halkier, B.A.; Gershenzon, J. Biology and biochemistry of glucosinolates. Annu. Rev. Plant Biol. 2006, 57, 303–333.
  23. Shroff, R.; Vergara, F.; Muck, A.; Svatoš, A.; Gershenzon, J. Nonuniform distribution of glucosinolates in Arabidopsis thaliana leaves has important consequences for plant defense. Proc. Natl. Acad. Sci. USA 2008, 105, 6196–6201.
  24. Shroff, R.; Schramm, K.; Jeschke, V.; Nemes, P.; Vertes, A.; Gershenzon, J.; Svatoš, A. Quantification of plant surface metabolites by matrix-assisted laser desorption–ionization mass spectrometry imaging: Glucosinolates on A rabidopsis thaliana leaves. Plant J. 2015, 81, 961–972.
  25. Jennings, C.; West, J.; Waine, C.; Craik, D.; Anderson, M. Biosynthesis and insecticidal properties of plant cyclotides: The cyclic knotted proteins from Oldenlandia affinis. Proc. Natl. Acad. Sci. USA 2001, 98, 10614–10619.
  26. Poth, A.; Mylne, J.; Grassl, J.; Lyons, R.E.; Millar, A.H.; Colgrave, M.; Craik, D.J. Cyclotides Associate with Leaf Vasculature and Are the Products of a Novel Precursor in Petunia (Solanaceae). J. Biol. Chem. 2012, 287, 27033–27046.
  27. Vrkoslav, V.; Muck, A.; Cvačka, J.; Svatoš, A. MALDI imaging of neutral cuticular lipids in insects and plants. J. Am. Soc. Mass Spectrom. 2010, 21, 220–231.
  28. Griffiths, C.A.; Sagar, R.; Geng, Y.; Primavesi, L.; Patel, M.K.; Passarelli, M.K.; Gilmore, I.S.; Steven, R.T.; Bunch, J.; Paul, M.J.; et al. Chemical intervention in plant sugar signalling increases yield and resilience. Nature 2016, 540, 574–578.
  29. Horton, D. Preface. The two most abundant organic substances on Earth, cellulose and starch. Adv. Carbohydr. Chem. Biochem. 2010, 75, 1–213.
  30. Ragauskas, A.J.; Williams, C.K.; Davison, B.H.; Britovsek, G.; Cairney, J.; Eckert, C.A.; Frederick, W.J., Jr.; Hallett, J.P.; Leak, D.J.; Liotta, C.L.; et al. The Path Forward for Biofuels and Biomaterials. Science 2006, 311, 484–489.
  31. Jung, S.; Chen, Y.; Sullards, M.C.; Ragauskas, A.J. Direct analysis of cellulose in poplar stem by matrix-assisted laser desorption/ionization imaging mass spectrometry. Rapid Commun. Mass Spectrom. 2010, 24, 3230–3236.
  32. Lunsford, K.A.; Peter, G.F.; Yost, R.A. Direct Matrix-Assisted Laser Desorption/Ionization Mass Spectrometric Imaging of Cellulose and Hemicellulose in Populus Tissue. Anal. Chem. 2011, 83, 6722–6730.
  33. Kim, H.U. Lipid metabolism in plants. Plants 2020, 9, 871.
  34. Peukert, M.; Matros, A.; Lattanzio, G.; Kaspar, S.; Abadía, J.; Mock, H. Spatially resolved analysis of small molecules by matrix-assisted laser desorption/ionizationmass spectrometric imaging (MALDI-MSI). New Phytol. 2011, 193, 806–815.
  35. Vanhercke, T.; El Tahchy, A.; Liu, Q.; Zhou, X.R.; Shrestha, P.; Divi, U.K.; Ral, J.-P.; Mansour, M.P.; Nichols, P.D.; James, C.N.; et al. Metabolic engineering of biomass for high energy density: Oilseed-like triacylglycerol yields from plant leaves. Plant Biotechnol. J. 2014, 12, 231–239.
  36. Venkateshwaran, M.; Ané, J.-M. Legumes and nitrogen fixation: Physiological, molecular, evolutionary perspective and ap-plications. In The Molecular Basis of Nutrient Use Efficiency in Crops; Wiley: Hoboken, NJ, USA, 2011; pp. 457–489.
  37. Ye, H.; Gemperline, E.; Venkateshwaran, M.; Chen, R.; Delaux, P.M.; Howes-Podoll, M.; Ané, J.M.; Li, L. MALDI mass spectrometry-assisted molecular imaging of metabolites during nitrogen fixation in the M edicago truncatula–S inorhizobium meliloti symbiosis. Plant J. 2013, 75, 130–145.
  38. Ketterlinus, R.; Hsieh, S.-Y.; Teng, S.-H.; Lee, H.; Pusch, W. Fishing for biomarkers: Analyzing mass spectrometry data with the new ClinProTools™ software. BioTechniques 2005, 38, S37–S40.
  39. Keller, C.; Maeda, J.; Jayaraman, D.; Chakraborty, S.; Sussman, M.R.; Harris, J.M.; Ané, J.-M.; Li, L. Comparison of Vacuum MALDI and AP-MALDI Platforms for the Mass Spectrometry Imaging of Metabolites Involved in Salt Stress in Medicago truncatula. Front. Plant Sci. 2018, 9, 1238.
  40. Gull, A.; Lone, A.A.; Wani, N.U.I. Biotic and Abiotic Stresses in Plants. In Abiotic and Biotic Stress in Plants; De Oliveira, A.B., Ed.; IntechOpen: London, UK, 2019.
  41. Jeandet, P.; Douillet-Breuil, A.-C.; Bessis, R.; Debord, S.; Sbaghi, M.; Adrian, M. Phytoalexins from the Vitaceae: Biosynthesis, Phytoalexin Gene Expression in Transgenic Plants, Antifungal Activity, and Metabolism. J. Agric. Food Chem. 2002, 50, 2731–2741.
  42. Becker, L.; Carré, V.; Poutaraud, A.; Merdinoglu, D.; Chaimbault, P. MALDI Mass Spectrometry Imaging for the Simultaneous Location of Resveratrol, Pterostilbene and Viniferins on Grapevine Leaves. Molecules 2014, 19, 10587–10600.
  43. Kompauer, M.; Heiles, S.; Spengler, B. Autofocusing MALDI mass spectrometry imaging of tissue sections and 3D chemical topography of nonflat surfaces. Nat. Methods 2017, 14, 1156–1158.
  44. Singh, B.; Kaur, P.; Gopichand; Singh, R.; Ajuha, P. Biology and chemistry of Ginkgo biloba. Fitoterapia 2008, 79, 401–418.
  45. van Beek, T.A. Chemical analysis of Ginkgo biloba leaves and extracts. J. Chromatogr. 2002, 967, 21–55.
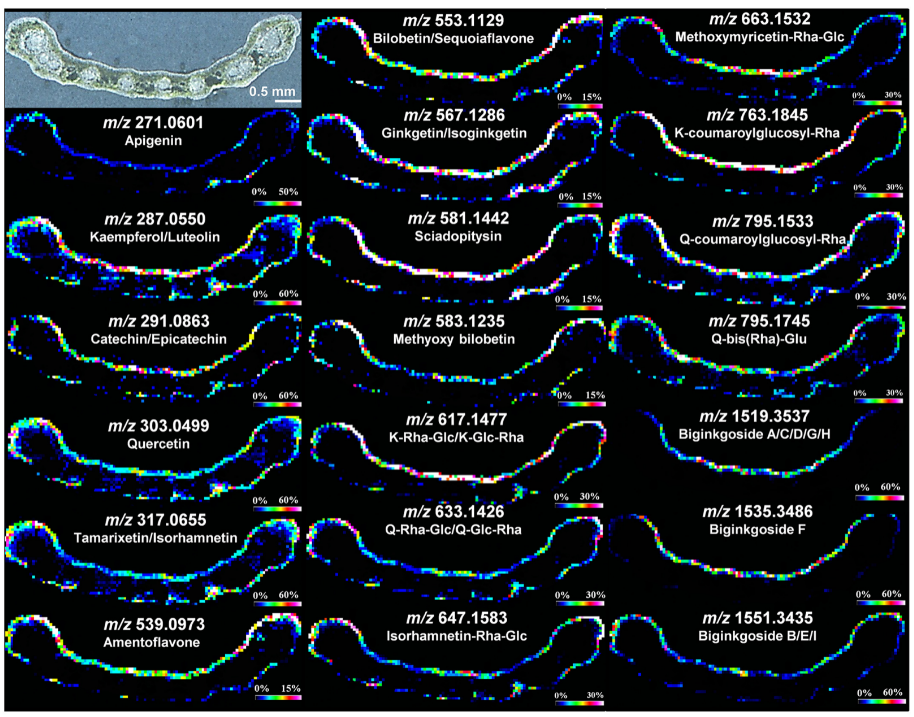
  46. Li, B.; Neumann, E.K.; Ge, J.; Gao, W.; Yang, H.; Li, P.; Sweedler, J. Interrogation of spatial metabolome of Ginkgo biloba with high-resolution matrix-assisted laser desorption/ionization and laser desorption/ionization mass spectrometry imaging. Plant Cell Environ. 2018, 41, 2693–2703.
  47. Zavalin, A.; Yang, J.; Caprioli, R. Laser Beam Filtration for High Spatial Resolution MALDI Imaging Mass Spectrometry. J. Am. Soc. Mass Spectrom. 2013, 24, 1153–1156.
  48. Zavalin, A.; Yang, J.; Haase, A.; Holle, A.; Caprioli, R. Implementation of a Gaussian Beam Laser and Aspheric Optics for High Spatial Resolution MALDI Imaging MS. J. Am. Soc. Mass Spectrom. 2014, 25, 1079–1082.
  49. Korte, A.R.; Yandeau-Nelson, M.; Nikolau, B.J.; Lee, Y.J. Subcellular-level resolution MALDI-MS imaging of maize leaf metabolites by MALDI-linear ion trap-Orbitrap mass spectrometer. Anal. Bioanal. Chem. 2015, 407, 2301–2309.
  50. Feenstra, A.D.; Dueñas, M.E.; Lee, Y.J. Five Micron High Resolution MALDI Mass Spectrometry Imaging with Simple, Interchangeable, Multi-Resolution Optical System. J. Am. Soc. Mass Spectrom. 2017, 28, 434–442.
  51. Koestler, M.; Kirsch, D.; Hester, A.; Leisner, A.; Guenther, S.; Spengler, B. A high-resolution scanning microprobe matrix-assisted laser desorption/ionization ion source for imaging analysis on an ion trap/Fourier transform ion cyclotron resonance mass spectrometer. Rapid Commun. Mass Spectrom. 2008, 22, 3275–3285.
  52. Li, B.; Bhandari, D.R.; Römpp, A.; Spengler, B. High-resolution MALDI mass spectrometry imaging of gallotannins and monoterpene glucosides in the root of Paeonia lactiflora. Sci. Rep. 2016, 6, 36074.
  53. McCombie, G.; Knochenmuss, R. Small-Molecule MALDI Using the Matrix Suppression Effect to Reduce or Eliminate Matrix Background Interferences. Anal. Chem. 2004, 76, 4990–4997.
  54. Murphy, A. Hormone crosstalk in plants. J. Exp. Bot. 2015, 66, 4853–4854.
  55. Shiono, K.; Taira, S. Imaging of multiple plant hormones in roots of rice (Oryza sativa) using nanoparticle-assisted laser de-sorption/Ionization mass spectrometry. J. Agric. Food Chem. 2020, 68, 6770–6775.
  56. Li, Z.; Bohn, P.W.; Sweedler, J.V. Comparison of sample pre-treatments for laser desorption ionization and secondary ion mass spectrometry imaging of Miscanthus×giganteus. Bioresour. Technol. 2010, 101, 5578–5585.
  57. Imai, T.; Tanabe, K.; Kato, T.; Fukushima, K. Localization of ferruginol, a diterpene phenol, in Cryptomeria japonica heartwood by time-of-flight secondary ion mass spectrometry. Planta 2005, 221, 549–556.
  58. Saito, K.; Mitsutani, T.; Imai, T.; Matsushita, Y.; Fukushima, K. Discriminating the Indistinguishable Sapwood from Heartwood in Discolored Ancient Wood by Direct Molecular Mapping of Specific Extractives Using Time-of-Flight Secondary Ion Mass Spectrometry. Anal. Chem. 2008, 80, 1552–1557.
  59. Zhou, C.; Li, Q.; Chiang, V.L.; Lucia, L.A.; Griffis, D.P. Chemical and Spatial Differentiation of Syringyl and Guaiacyl Lignins in Poplar Wood via Time-of-Flight Secondary Ion Mass Spectrometry. Anal. Chem. 2011, 83, 7020–7026.
  60. Musha, Y.; Goring, D.A.I. Distribution of syringyl and guaiacyl moieties in hardwoods as indicated by ultraviolet microscopy. Wood Sci. Technol. 1975, 9, 45–58.
  61. Saito, K.; Watanabe, Y.; Shirakawa, M.; Matsushita, Y.; Imai, T.; Koike, T.; Sano, Y.; Funada, R.; Fukazawa, K.; Fukushima, K. Direct mapping of morphological distribution of syringyl and guaiacyl lignin in the xylem of maple by time-of-flight secondary ion mass spectrometry. Plant J. 2011, 69, 542–552.
  62. Fu, T.; Houël, E.; Amusant, N.; Touboul, D.; Genta-Jouve, G.; Della-Negra, S.; Fisher, G.L.; Brunelle, A.; Duplais, C. Biosynthetic investigation of γ-lactones in Sextonia rubra wood using in situ TOF-SIMS MS/MS imaging to localize and characterize biosynthetic intermediates. Sci. Rep. 2019, 9, 1–11.
  63. Gottlieb, O. Chemosystematics of the lauraceae. Phytochemistry 1972, 11, 1537–1570.
  64. Kulkarni, P.; Dost, M.; Bulut, Ö.D.; Welle, A.; Böcker, S.; Boland, W.; Svatoš, A. Secondary ion mass spectrometry imaging and multivariate data analysis reveal co-aggregation patterns of Populus trichocarpa leaf surface compounds on a micrometer scale. Plant J. 2018, 93, 193–206.
  65. Sandermann, H., Jr. Plant metabolism of xenobiotics. Trends Biochem. Sci. 1992, 17, 82–84.
  66. Fraser, E.; Legwegoh, A.; Kc, K.; CoDyre, M.; Dias, G.; Hazen, S.; Johnson, R.; Martin, R.; Ohberg, L.; Sethuratnam, S.; et al. Biotechnology or organic? Extensive or intensive? Global or local? A critical review of potential pathways to resolve the global food crisis. Trends Food Sci. Technol. 2016, 48, 78–87.
  67. Anderson, D.M.; Carolan, V.A.; Crosland, S.; Sharples, K.R.; Clench, M.R. Examination of the distribution of nicosulfuron in sunflower plants by matrix-assisted laser desorp-tion/ionisation mass spectrometry imaging. Rapid Commun. Mass Spectrom. 2009, 23, 1321–1327.
  68. Annangudi, S.P.; Myung, K.; Adame, C.A.; Gilbert, J.R. MALDI-MS Imaging Analysis of Fungicide Residue Distributions on Wheat Leaf Surfaces. Environ. Sci. Technol. 2015, 49, 5579–5583.
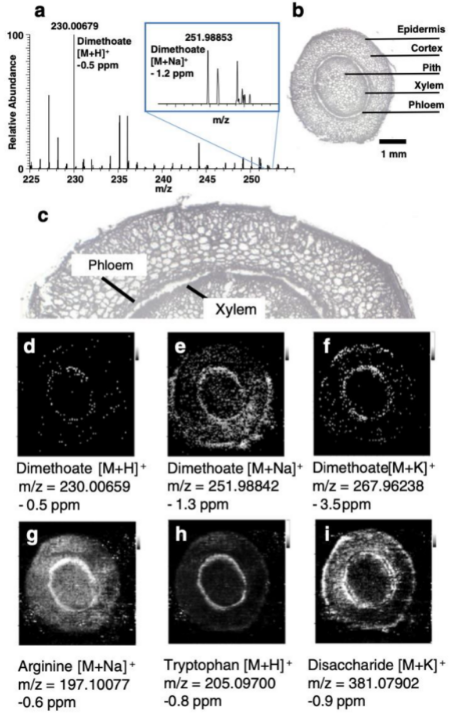
  69. Kubicki, M.; Lamshöft, M.; Lagojda, A.; Spiteller, M. Metabolism and spatial distribution of metalaxyl in tomato plants grown under hydroponic conditions. Chemosphere 2018, 218, 36–41.
  70. Gerbig, S.; Brunn, H.E.; Spengler, B.; Schulz, S. Spatially resolved investigation of systemic and contact pesticides in plant material by desorption electrospray ionization mass spectrometry imaging (DESI-MSI). Anal. Bioanal. Chem. 2015, 407, 7379–7389.
  71. Kooijman, P.C.; Lamprecht, S.; Lamshoeft, M.; Beine, B.; Verhoeven, B.J.; Ellis, S.R.; Heeren, R.M. A novel dual ionization modality source for infrared laser ablation post-ionization mass spectrometry imaging to study fungicide metabolism and transport. Int. J. Mass Spectrom. 2021, 465, 116602.
  72. Wu, X.; Qin, R.; Wu, H.; Yao, G.; Zhang, Y.; Li, P.; Xu, Y.; Zhang, Z.; Yin, Z.; Xu, H. Nanoparticle-immersed paper imprinting mass spectrometry imaging reveals uptake and translocation mechanism of pesticides in plants. Nano Res. 2020, 13, 611–620.
  73. Chamberlain, K.; Patel, S.; Bromilow, R.H. Uptake by roots and translocation to shoots of two morpholine fungicides in barley. Pestic. Sci. 1998, 54, 1–7.
  74. de la Cruz, R.A.; Amaral, G.D.S.; Mendes, K.F.; Rojano-Delgado, A.M.; De Prado, R.; da Silva, M.F.D.G.F. Absorption, translocation, and metabolism studies of herbicides in weeds and crops. In Radioisotopes in Weed Research; CRC Press: Boca Raton, FL, USA, 2020; pp. 127–154.
  75. Nandula, V.K.; Vencill, W.K. Herbicide Absorption and Translocation in Plants using Radioisotopes. Weed Sci. 2015, 63, 140–151.
  76. Tuck, M.; Blanc, L.; Touti, R.; Patterson, N.H.; Van Nuffel, S.; Villette, S.; Taveau, J.-C.; Römpp, A.; Brunelle, A.; Lecomte, S.; et al. Multimodal Imaging Based on Vibrational Spectroscopies and Mass Spectrometry Imaging Applied to Biological Tissue: A Multiscale and Multiomics Review. Anal. Chem. 2020, 93, 445–477.
  77. Tian, X.; Xie, B.; Zou, Z.; Jiao, Y.; Lin, L.E.; Chen, C.L.; Hsu, C.C.; Peng, J.; Yang, Z. Multimodal imaging of amyloid plaques: Fusion of the single-probe mass spectrometry image and fluorescence mi-croscopy image. Anal. Chem. 2019, 91, 12882–12889.
  78. Veličkovič, D.A.; Chu, R.K.; Carrell, A.A.; Thomas, M.; Paša-Tolič, L.; Weston, D.J.; Anderton, C.R. Multimodal MSI in conjunction with broad coverage spatially resolved MS2 increases confidence in both molecular identification and localization. Anal. Chem. 2018, 90, 702–707.
  79. Thunig, J.; Hansen, S.H.; Janfelt, C. Analysis of Secondary Plant Metabolites by Indirect Desorption Electrospray Ionization Imaging Mass Spectrometry. Anal. Chem. 2011, 83, 3256–3259.
  80. Hemalatha, R.G.; Pradeep, T. Understanding the Molecular Signatures in Leaves and Flowers by Desorption Electrospray Ionization Mass Spectrometry (DESI MS) Imaging. J. Agric. Food Chem. 2013, 61, 7477–7487.
More
Information
Contributors MDPI registered users' name will be linked to their SciProfiles pages. To register with us, please refer to https://encyclopedia.pub/register : , , ,
View Times: 334
Revisions: 2 times (View History)
Update Date: 24 May 2022
1000/1000
Video Production Service