Your browser does not fully support modern features. Please upgrade for a smoother experience.
Submitted Successfully!
 +1 credit
Thank you for your contribution! You can also upload a video entry or images related to this topic.
For video creation, please contact our Academic Video Service.
| Version | Summary | Created by | Modification | Content Size | Created at | Operation |
|---|---|---|---|---|---|---|
| 1 | Sumukh Surya | -- | 2712 | 2022-04-02 17:00:39 | | | |
| 2 | Rita Xu | Meta information modification | 2712 | 2022-04-06 05:10:44 | | |
Video Upload Options
We provide professional Academic Video Service to translate complex research into visually appealing presentations. Would you like to try it?
Cite
If you have any further questions, please contact Encyclopedia Editorial Office.
Surya, S.; , .; Williamson, S. Battery Management System Application. Encyclopedia. Available online: https://encyclopedia.pub/entry/21321 (accessed on 24 July 2026).
Surya S, , Williamson S. Battery Management System Application. Encyclopedia. Available at: https://encyclopedia.pub/entry/21321. Accessed July 24, 2026.
Surya, Sumukh, , Sheldon Williamson. "Battery Management System Application" Encyclopedia, https://encyclopedia.pub/entry/21321 (accessed July 24, 2026).
Surya, S., , ., & Williamson, S. (2022, April 02). Battery Management System Application. In Encyclopedia. https://encyclopedia.pub/entry/21321
Surya, Sumukh, et al. "Battery Management System Application." Encyclopedia. Web. 02 April, 2022.
Copy Citation
Electric Vehicles (EV) and Hybrid EV (HEV) use Lithium (Li) ion battery packs to drive them. These battery packs possess high specific density and low discharge rates. However, some of the limitations of such Li ion batteries are sensitivity to high temperature and health degradation over long usage. The Battery Management System (BMS) protects the battery against overvoltage, overcurrent etc., and monitors the State of Charge (SOC) and the State of Health (SOH). SOH is a complex phenomenon dealing with the effects related to aging of the battery such as the increase in the internal resistance and decrease in the capacity due to unwanted side reactions. The battery life can be extended by estimating the SOH accurately.
Battery Management System
data driven techniques
hybrid electric vehicles
1. Introduction
Traditional Vehicles use fossil fuels to drive them. These vehicles emit Green House Gases (GHG) and pollute the atmosphere. Hence, electrification of the current transportation is necessary to prevent air pollution. In this regard, various energy storage devices are used in Electric Vehicles (EV) namely 1. Battery, 2. Ultra Capacitor, 3. Fuel Cell and 4. Ultra- Capacitor [1].
The classification of energy storage devices is based on their functionality and the type of energy stored. Figure 1 shows the classification of various energy storage devices [1][2].
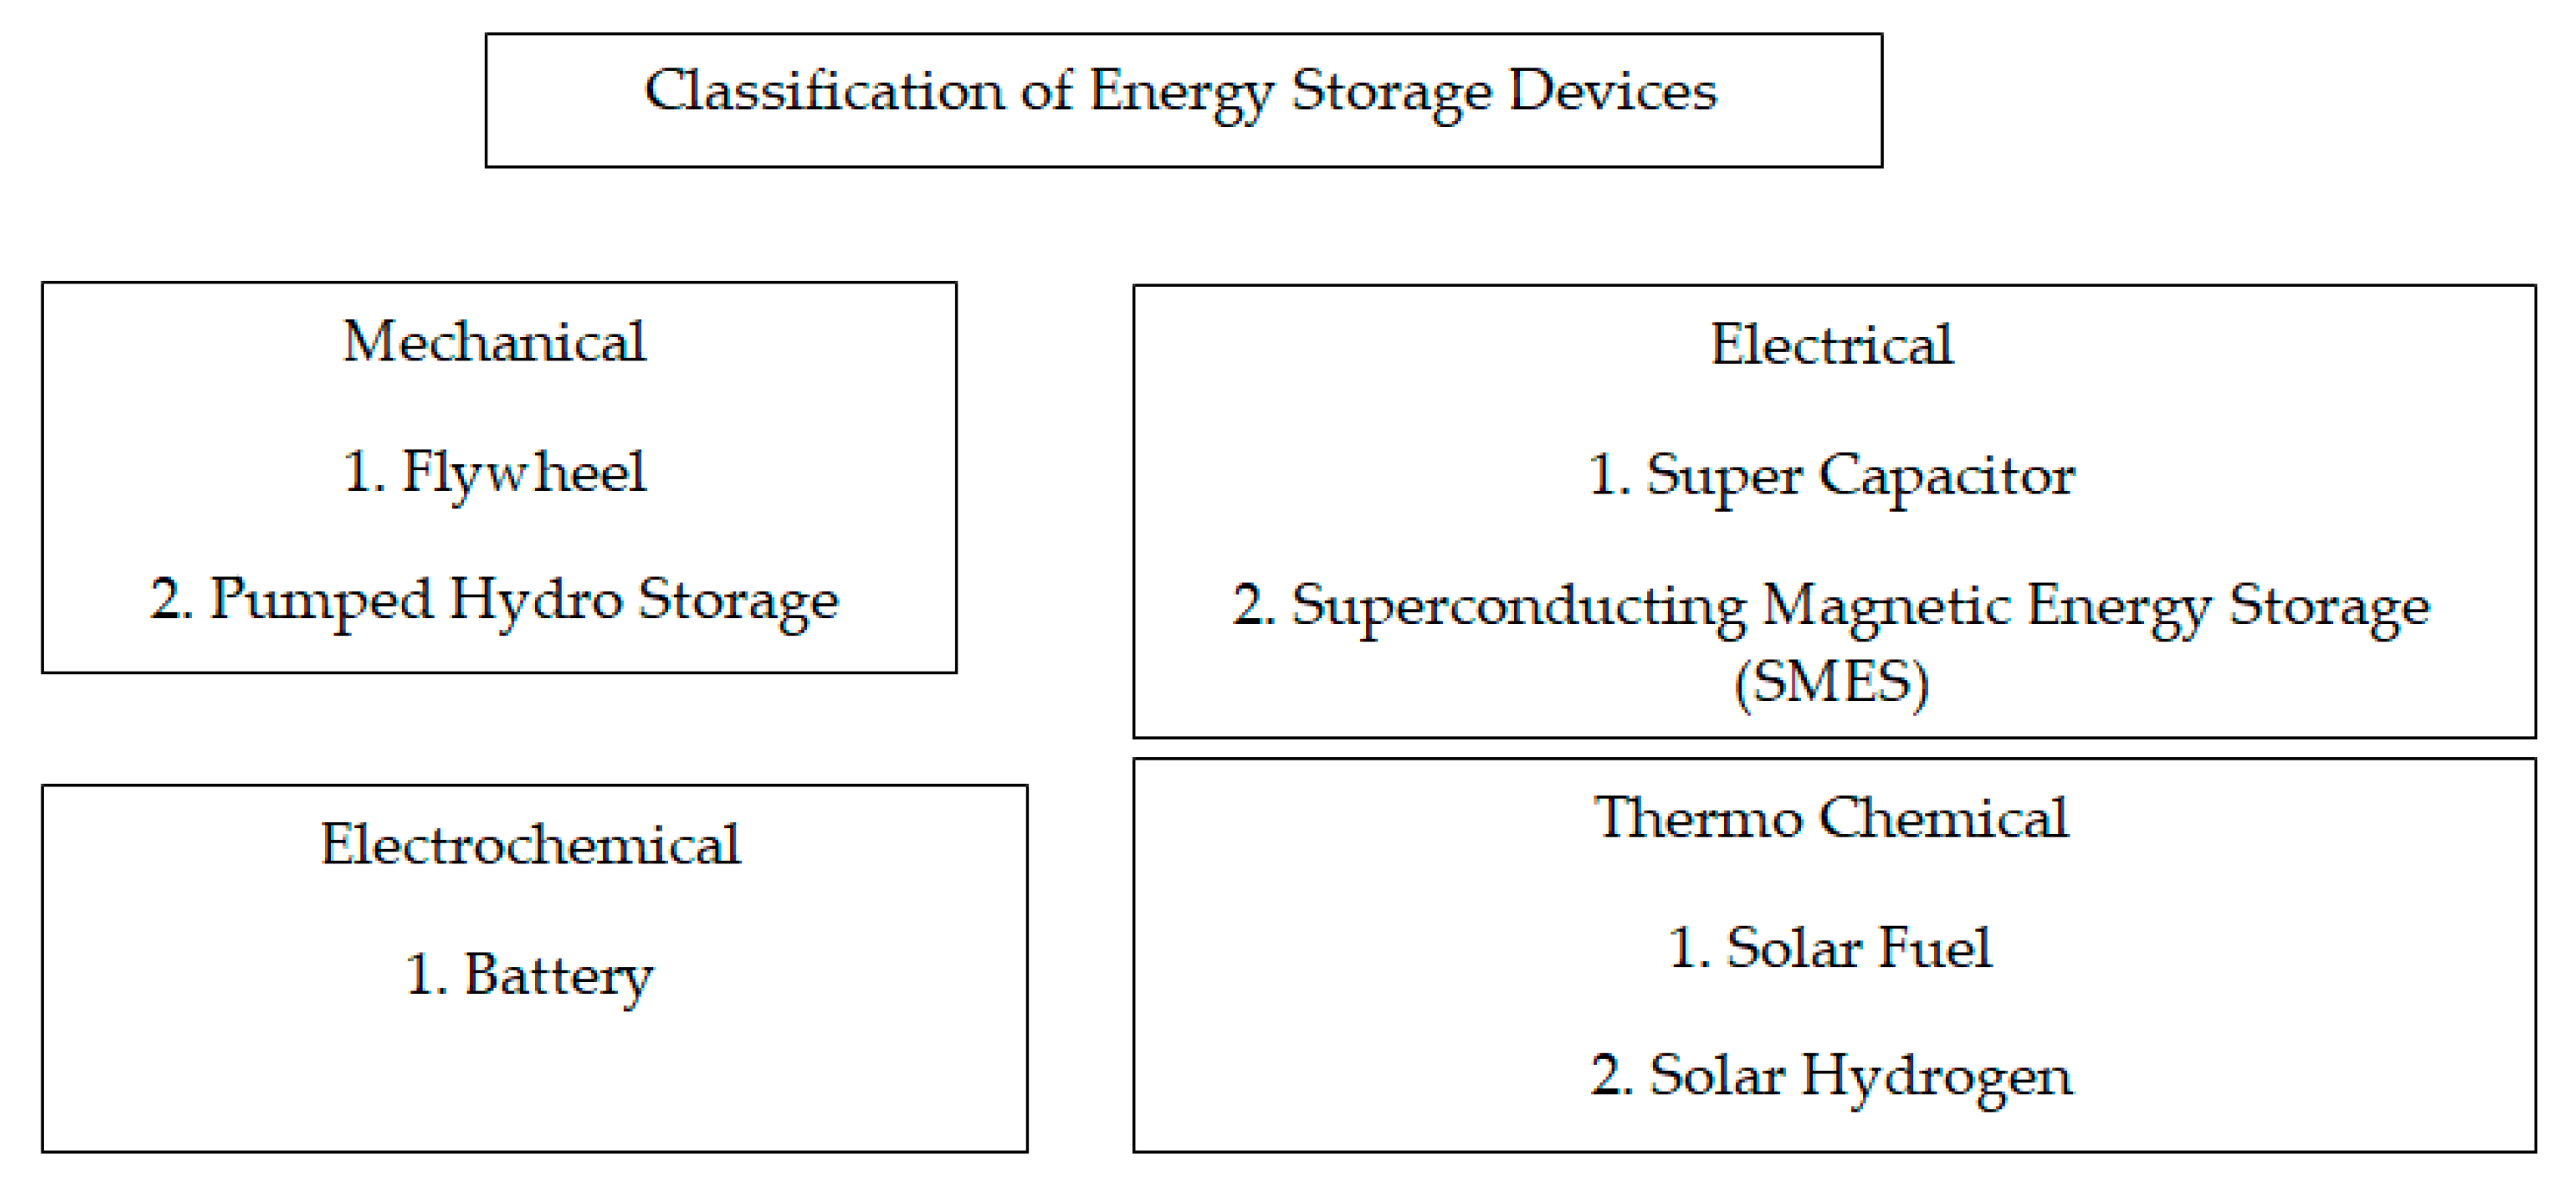
Figure 1. Classification of Energy Storage Devices [1].
Among the various energy storage devices, Li ion batteries are preferred due to the following reasons namely (1) High Power Density, (2) High Energy Density (3) Light Weight and (4) High Terminal Voltage. Table 1 shows a comparative analysis of various energy storage devices.
Table 1. Comparative analysis of various energy storage devices.
| Energy Storage Device | Power Range (MW) | Energy Density (Wh/I) | Power Density (Wh/I) | Efficiency |
|---|---|---|---|---|
| Pumped Hydro Storage | 10–5000 | 0.5–1.5 | 0.5–1.5 | 75–85 |
| SMES | 0.1–10 | 0.2–2.5 | 1000–4000 | 95–98 |
| Li-ion | 0–100 | 200–500 | 500–2000 | 90–97 |
Figure 2 depicts the block diagram of a Plug-In Hybrid EV (PHEV) wherein the battery present in PHEV can draw and store energy from the electric grid or renewable sources [3].
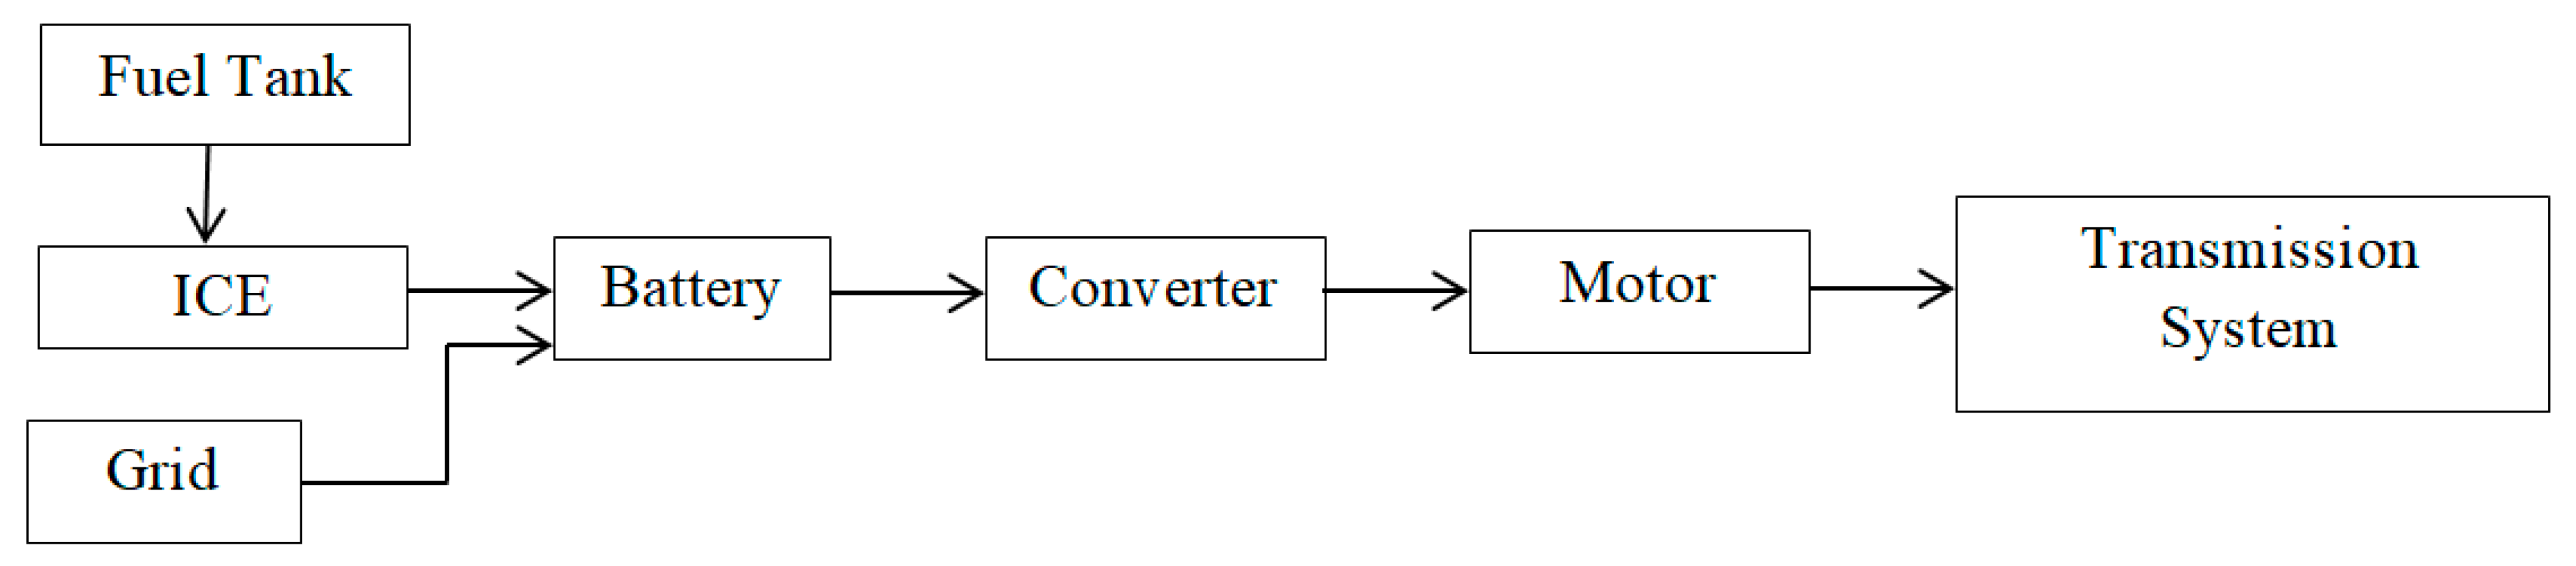
Figure 2. Block Diagram of a PHEV.
An Internal Combustion Engine (ICE) is powered by the fossil fuel stored in the fuel tank. ICE powers the motor and torque is generated which is fed to the transmission system. Meanwhile, the power to the motor can also be fed from the grid or other renewable source of energy. The BMS controls the charging current voltage and provides protection to the battery. Figure 3 shows the functionality of BMS in EV application. The BMS takes input from the battery pack and provides control signals to turn ON/OFF the contactor, thermal management and protects the battery pack [4].
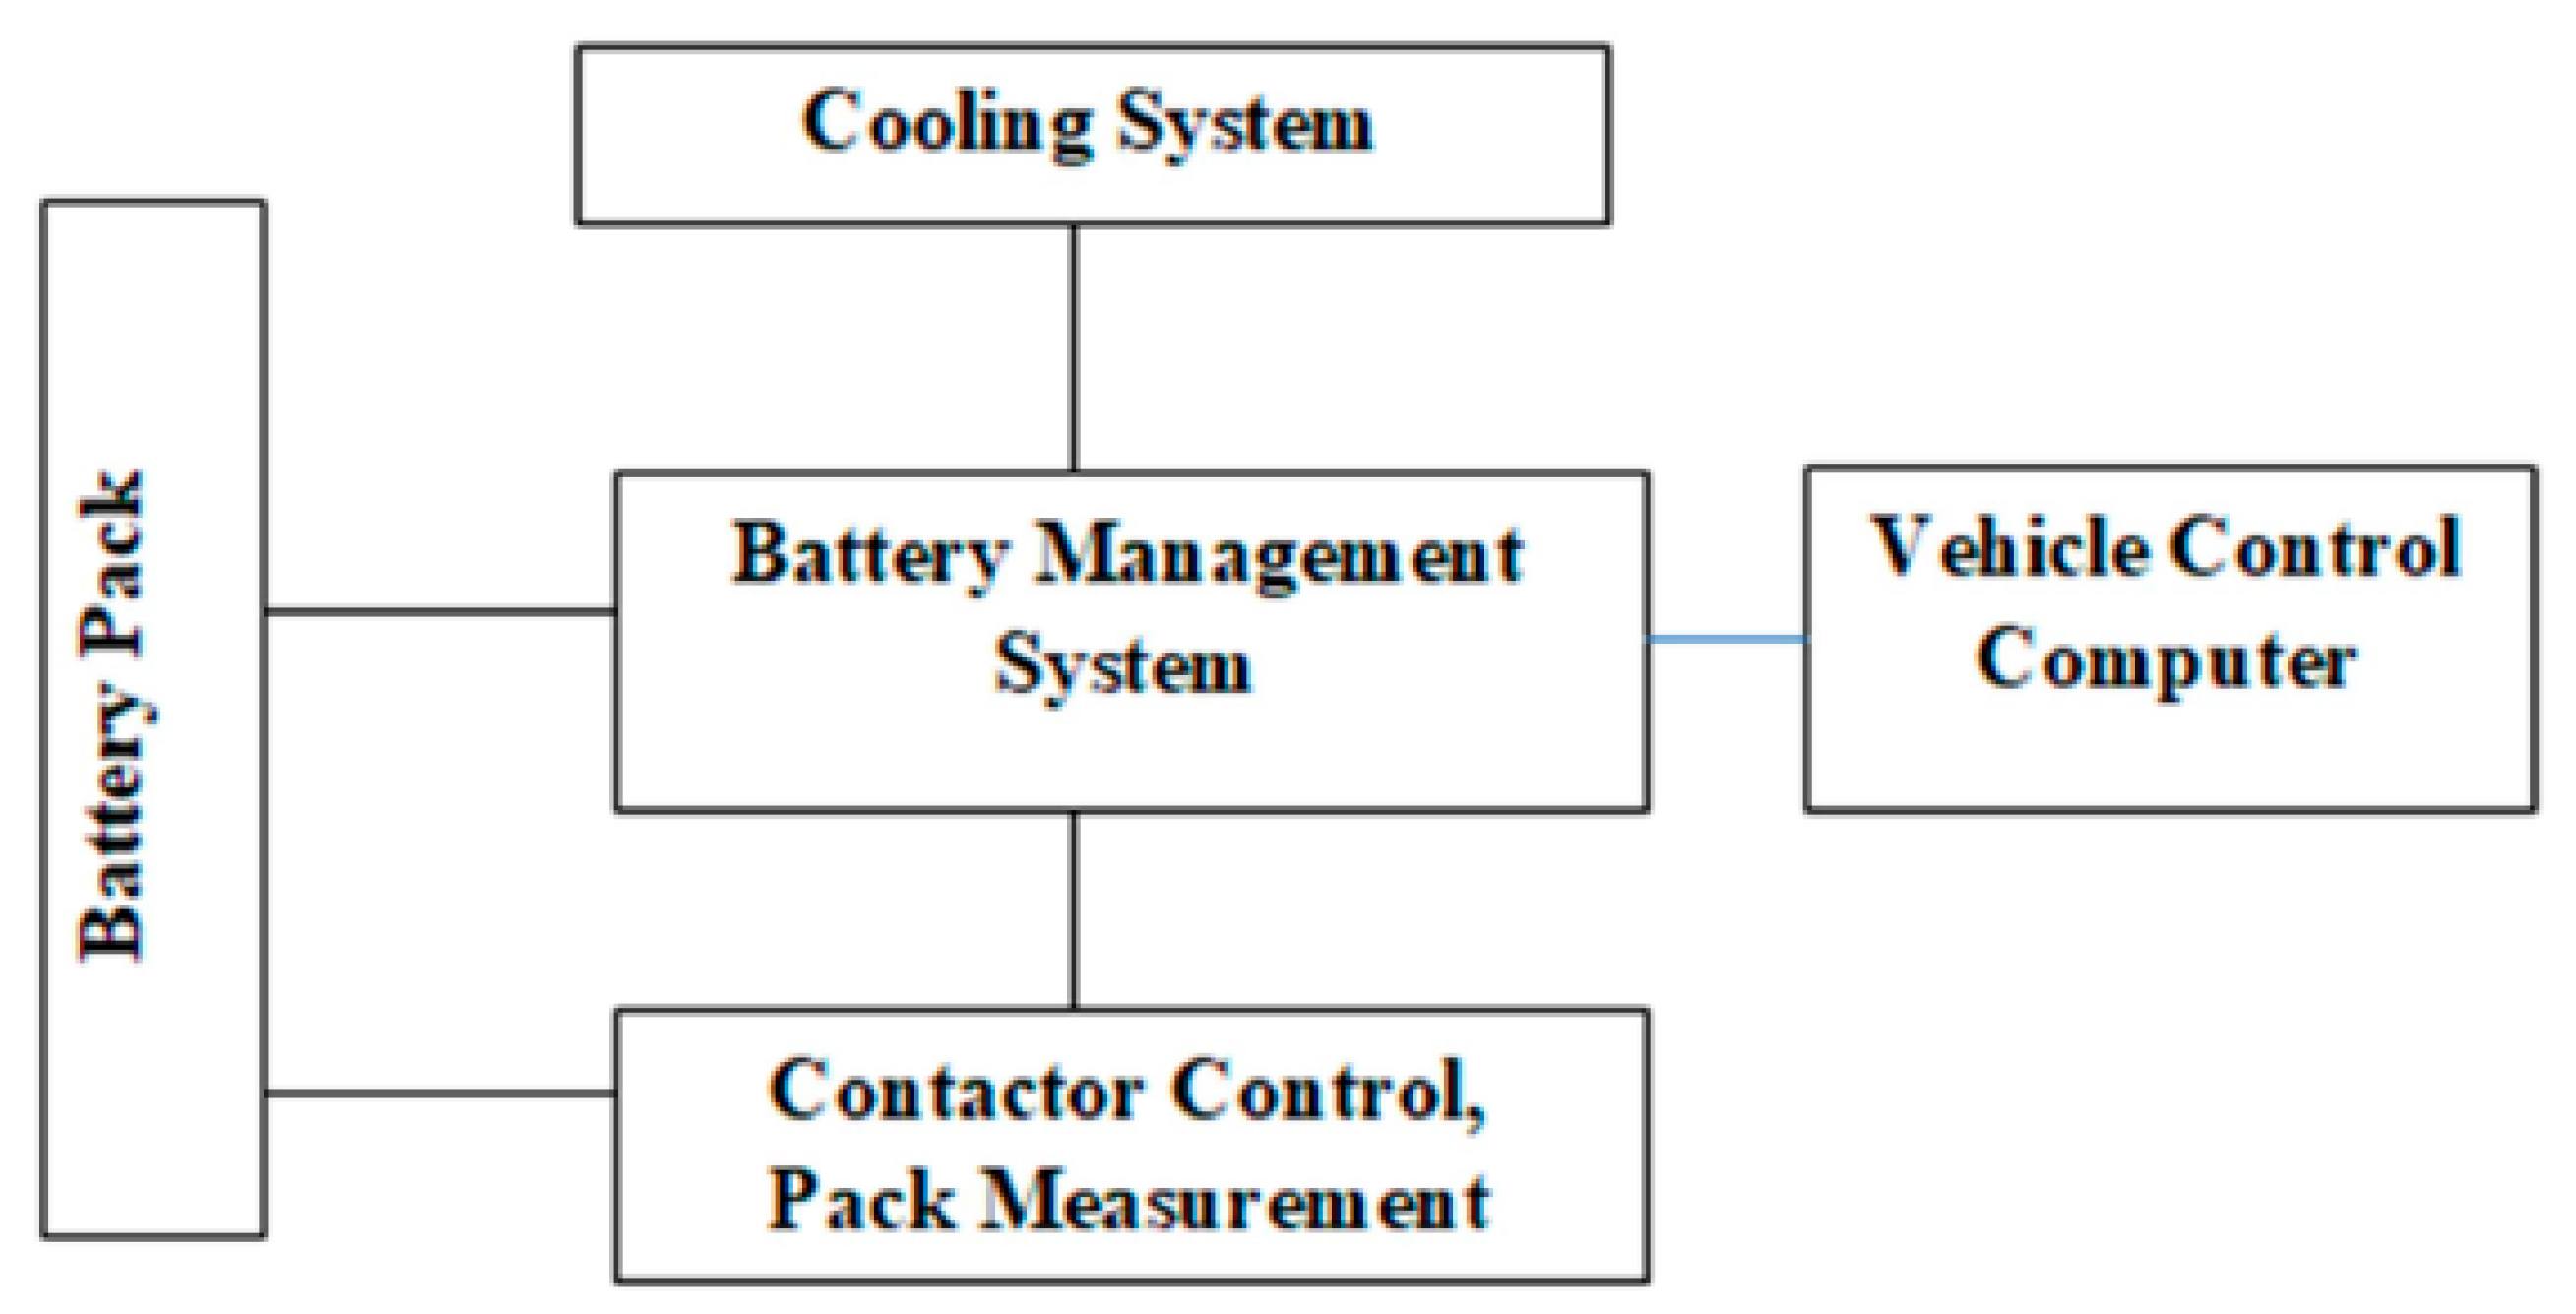
Figure 3. BMS Functionality.
Estimation of SOC, SOH and Core Temperature are the most fundamental algorithms in BMS application. Some of the advantages of estimating SOH for batteries are (a) Timely replacement (b) Increase in life and (c) Reliable operation. SOH is considered as one of indictors for aging phenomena and involves estimating the series internal resistance (Power Fade) and the nominal capacity (Capacity Fade) of the battery or a cell. Power and Capacity fading are complicated features as they do not occur simultaneously [5]. These occur due to the unwanted side reactions and result in structural deterioration. Li moves to and fro from the positive and negative electrodes. Ideally, no Li ion is lost during this movement. However, in practice Li ion is carried away while moving between the electrodes in the side reaction. This phenomenon is called Loss of Li inventory (LLI) and this occurs charging. Hence, the amount of Li stored in a cell/battery decreases. This is referred to as Loss of Active Material (LAM).
The solvent S at the anode consumes two Li ions and forms partially soluble Dilithium Sulphide and causes the SEI formation [6].
Measuring the capacity of the battery cell is extremely important as for calculating the total energy that can be held in the battery cell as SOC computation requires capacity measurement. The internal resistance plays a vital role during power calculation and SOC estimation based on voltage-based methods [5][7].
To estimate the SOH, cell modeling is extremely important. A cell is considered as the fundamental unit in a battery and can be modeled as a pair of Resistor—Capacitor (RC) pair by providing a pulse discharge using Pulse Characterization Test [7][8]. Figure 4 shows the voltage profile used for estimating the battery parameters. Lesser computation effort is required to estimate 1 RC parameter value for a cell model. To perform the pulse characterization test, a discharge current is applied initially. Hence, the voltage drops due to the discharge current. The procedure to estimate the battery parameters were shown in [7].
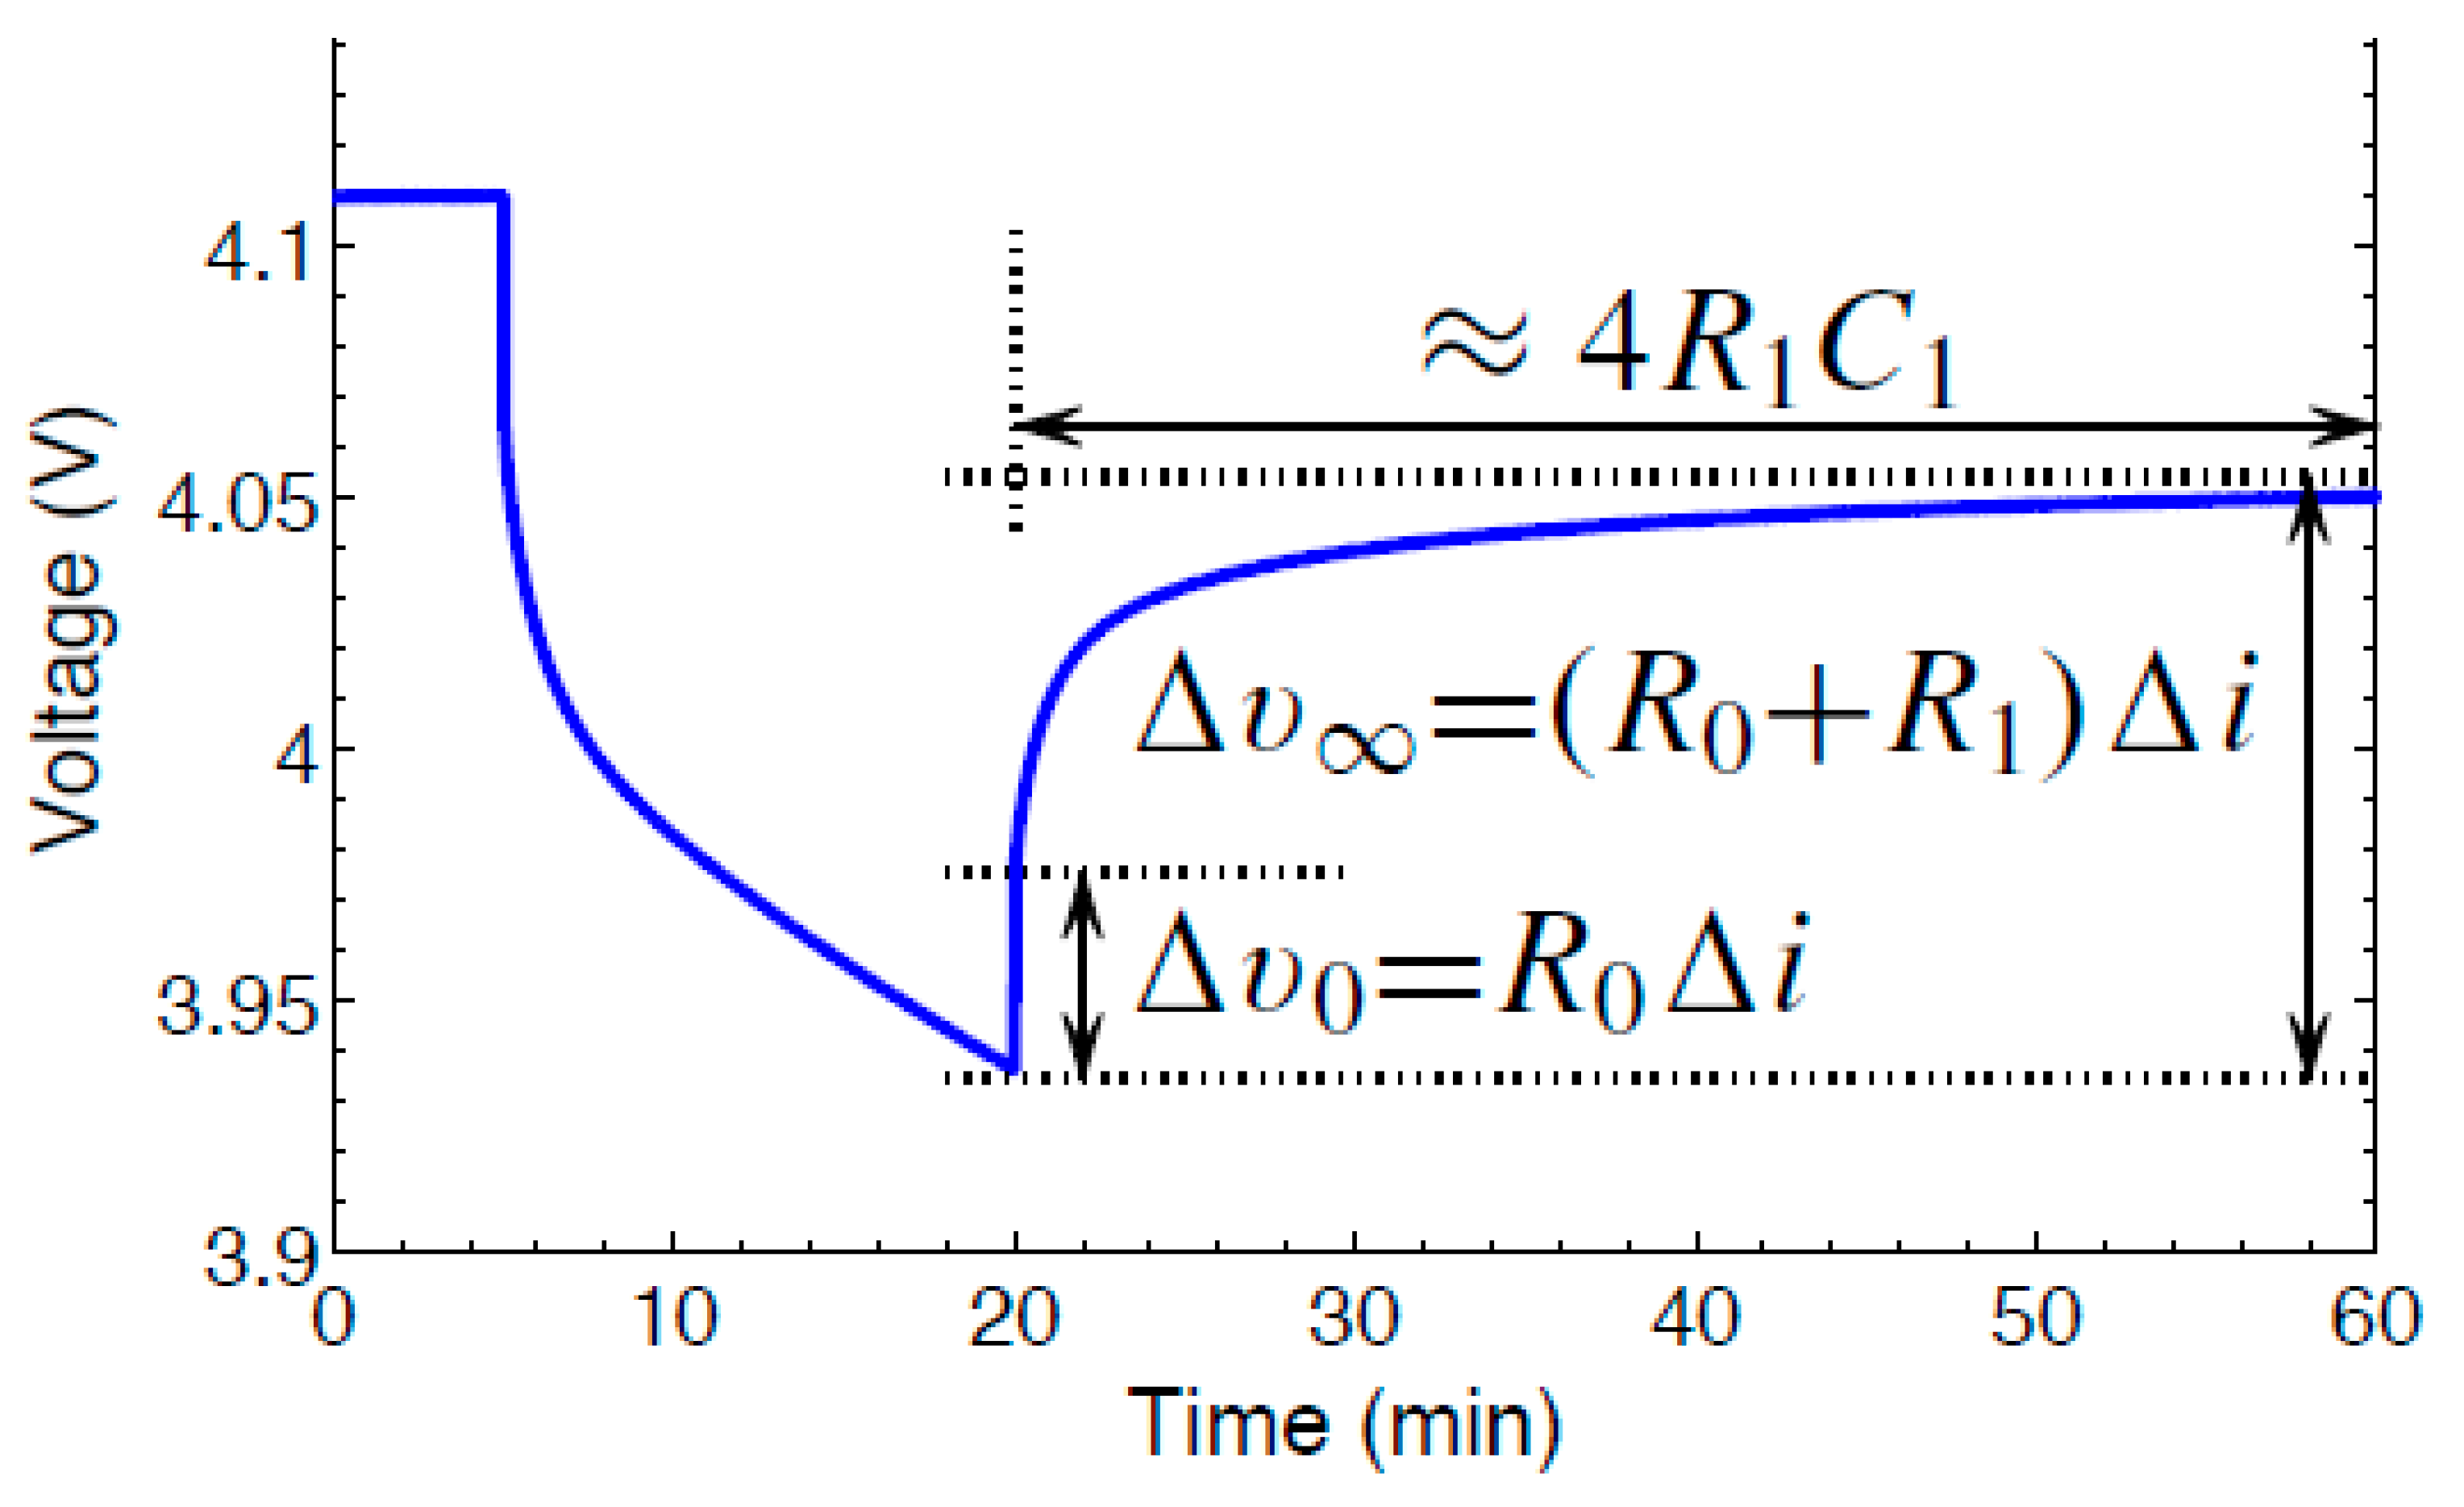
Figure 4. Polarization of Voltage.
The internal series resistance in addition to the parallel RC pair constitutes 1-RC pair model of a cell. The best battery model consists of 5-RC pairs and is termed as Enhanced Self Correcting Model [9][10] which provides accurate results. The battery parameters showed dependence on SOC but not on the magnitude of discharge current and ambient temperature. The empirical formula based on 2-RC pairs for Randles circuit was presented in [11]. The Open Circuit Voltage (OCV) based SOC model was presented for Li Iron Phosphate chemistry (LiFePO4). A comparative analysis on different methodologies involved in SOH estimation is presented. In Direct method, the internal resistance is directly measured as a function of temperature. However, in Degradation model the active material present in the battery is measured. This method provides highly accurate result and requires intense computation. Hence, high cost is involved.
Due to the increase in the temperature, SOH degradation takes place. The core or the internal temperature (Tc) of a cell can reach to dangerously large values under fast current discharge. For 2C discharge current, Tc increased 6–7 times than that of the surface temperature, Ts [12]. Since, Li ion cells are very sensitive to high temperature; they catch fire leading to thermal run-away. Hence, thermal management is essential part of BMS. Tc was estimated using Kalman Filter for different chemistries and the difference between Ts and Tc were shown in [13][14][15]. The internal resistance showed low value for high temperatures. When the SOC varied from 0–100%, the internal resistance value was low. However, the value was negligible for SOC between 20–80% [16].
Some of the typical DC - DC converters used for charging applications in EV industry are Cuk and SEPIC as they possess series inductor with the input voltage supply [17][18] providing continuous input current. In [19], SOH of battery coupled to a Bi-directional DC-DC converter is estimated based on temperature, C rate and Depth of Discharge (DOD). One of major drawback from this system is that error is found to increase in SOC estimation due to battery aging. Hence, the proposed SOH technique is specific to the system and needs information on battery pack capacity and capacity at various C rates.
In [20], SOH balancing for two cells is performed by connecting series DC–DC converters. The reference signals of current are generated by the controller for discharging and charging currents. Due to efficient balancing, the cells reduce to the lowest SOH enabling safely and timely replacement. This scheme can be used for estimating the second life of the battery.
A comparative analysis on different methodologies involved in SOH estimation is presented in [21]. In Direct method, the internal resistance is directly measured as a function of temperature. However, in Degradation model the active material present in the battery is measured. This method provides highly accurate result and requires intense computation. Hence, high cost is involved. Table 2 shows a comparison between direct methods and degradation models used for estimating SOH.
Table 2. Direct methods Vs. Degradation Models.
| SL.NO | Method | Overview | Technique | Merit | Demerit |
|---|---|---|---|---|---|
| 1 | Direct | Uses voltage, current and temperature | Offline | Easy and Efficient | Difficult to measure |
| 2 | Degradation | Requires knowledge of electrochemistry | Offline | High Accuracy | Complex |
| 3 | Impedance Spectroscopy | Estimates SOH | Offline | Accurate | Specified instruments required and time consuming |
Estimation of 2nd life is a popular technique to predict how quickly the battery can degrade considering the current conditions of the battery as shown in Figure 5. Few advantages of estimating the 2nd life are (a) Lesser price for EV (b) Material and Energy savings [22]. This was due to the fewer side reactions at the graphite anode electrode. Due to this, a thicker and stronger SEI is formed during the aging process. Tests were conducted on three batteries for full cycle each month after which they were subjected to calendar aging. The cells did not exhibit major aging even up to 50% of capacity degradation, indicating a long battery life in the second life application. Lower capacity fade was seen in cells with SOC = 90% than in case of cells having SOC = 50%. This can be extremely useful for Uninterruptible Power Supply (UPS) application.
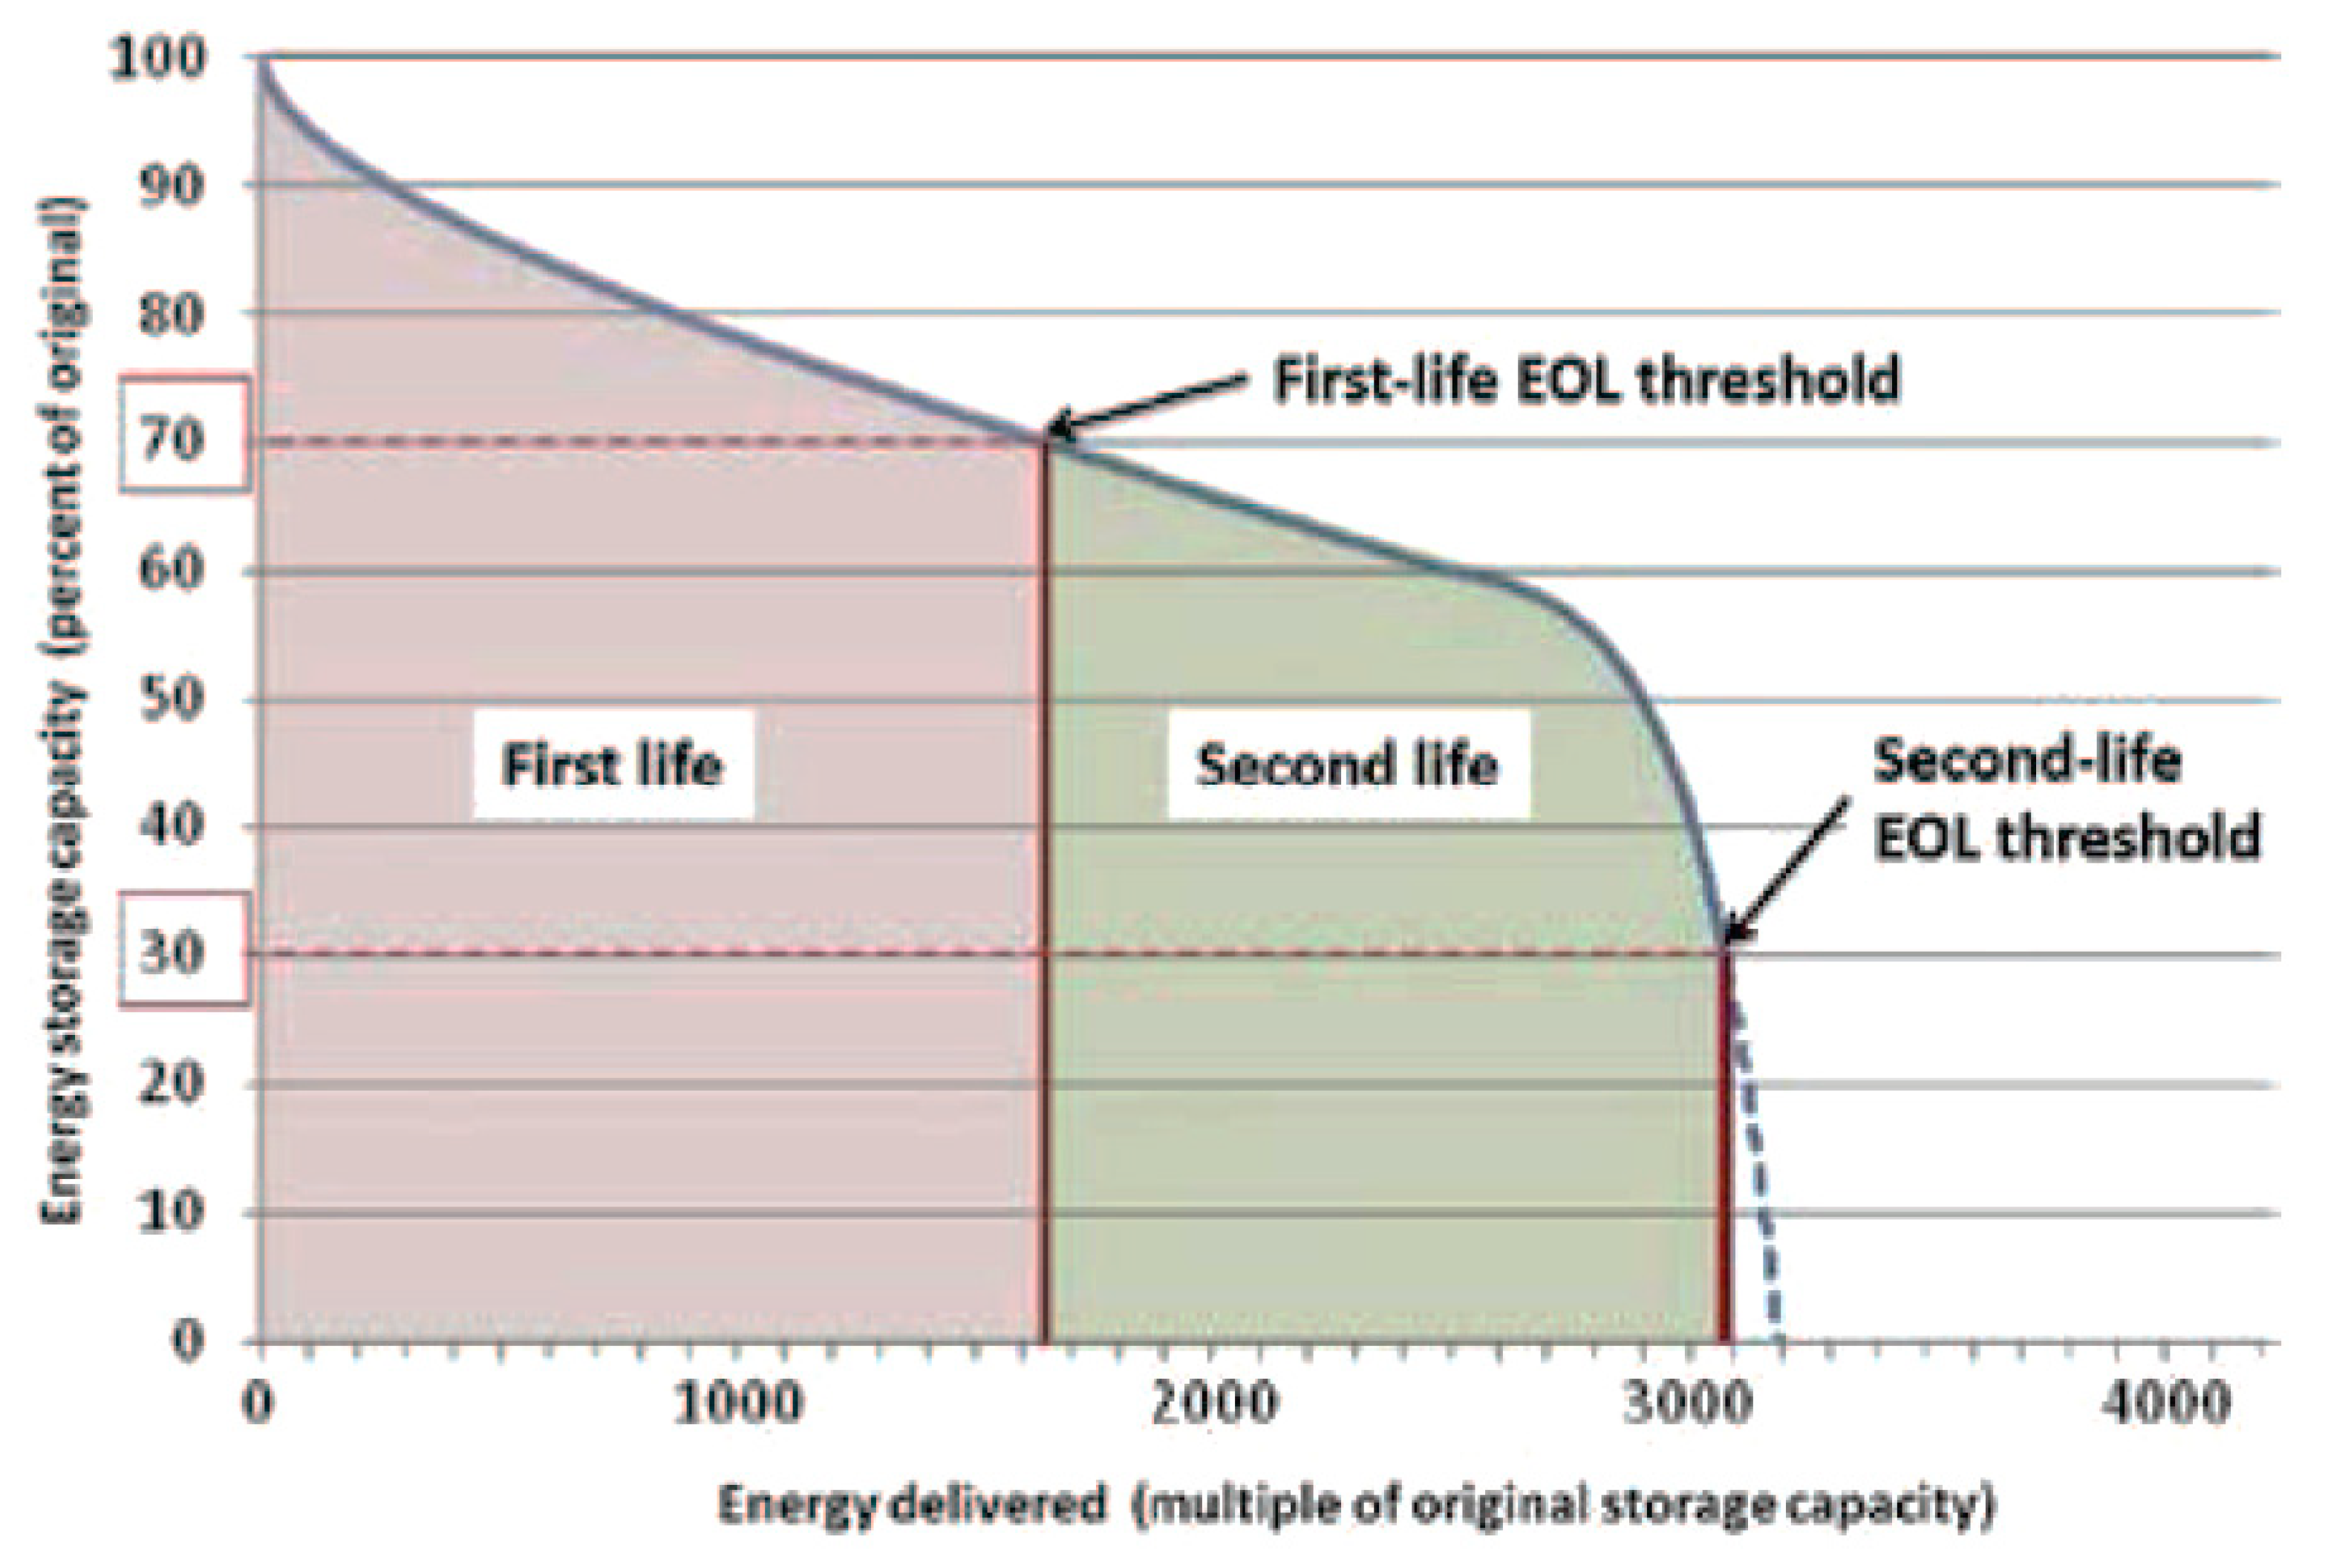
Figure 5. Estimation of Second Life of Batteries [22].
The remaining capacity/power in a cell can be estimated using 1st and 2nd Life Aging. Li ion cell is considered to be in its EOL stage when operating at 80–85% of nominal capacity. Using the technique of impedance spectroscopy, second life of a 20Ah Li NMC battery is estimated after EOL at various rated capacities. Randles circuit was used for analyzing the experimental impedance data. It was found that R1 and R2 (RSEL and RCT) varied with SOC. These variations were majorly observed during higher SOC range. It was noted this technique cannot be useful while estimating SOC for Li ion cells.
To achieve high efficiency and increased power output smart BMS is proposed. Cloud based BMS using Cyber Hierarchy and International Network (CHAIN) enables provision to realize advance algorithms such as SOH estimation, thermal management and fault diagnosis. The battery monitoring system helps in visualizing the battery data and supports development of new control strategies [23].
The different materials used in the current collectors are shown in [24].
Data-driven methods such as Machine learning (ML) and Artificial Intelligence (AI) contribute primarily in SOH estimation. Some of the most common estimation models that can be considered under ML are Recurrent Neural Network (RNN), Support Vector Machines (SVM), Feed-Forward Neural Network (FNN), Regression Model, Clustering Models and many more [25][26][27][28][29][30][31][32][33][34][35][36][37][38][39][40][41][42].
2. Aging Effects at Negative Electrode
Graphite and Silicon are used material for the negative electrode. At the negative electrode, aging happens in three different scales at three different locations namely,
- (a)
-
On the surface of the electrode
- (b)
-
Within the electrode particles and
- (c)
-
Within the electrode structure
The graphite negative electrode operates at potentials outside the electrochemical stability window of the electrolyte components used in Li ion cells. Hence, when the electrolyte which are typically organic in nature, comes in contact with graphite and specifically when the graphite is in a charged state, electrolyte decomposes and undergoes a chemical reaction. This creates a thin film layer on the surface of the electrolyte. This layer is referred to as Solid Electrolyte Interface (SEI). This formation layer is primarily created when the cell is charged initially. This layer covers up all the surfaces of the particles. The cell is fully discharged when it is dissembled and later charged so as to move Li from positive to negative electrode.
Some of the properties of SEI are:
-
It is an unwanted layer which consumes Li in the process of being generated. This in turn reduces the cell capacity.
-
This layer is not reactive but forms insulation between the graphite material and the electrolyte. However, without the layer formation charging cannot be performed.
-
Complex layer and not uniform—Different materials are formed during the reaction and these are deposited on the surface of the electrode. However, the layer itself can decompose and create more stable products than the previously formed.
-
SEI layer has large porous allowing the mixing of materials. However, it creates opposition to the motion of Li ions. Hence, resistance of the cell increases.
-
The breakdown of the SEI layer can occur due to high temperature. The SEI layer is removed and free layer of graphite is made available to the solvent, creating new SEI layers when temperature is induced. Hence, the net change results in lowering of cell capacity.
-
While manufacturing the cell, maximum effort is made to ensure that no moisture content is in the air. However, it is impossible to eliminate moisture in a cost-effective way and there would be traces of water (H20) in the electrolyte. This combines with Ionized Fluorine salt (LiPF6) in the electrolyte. Hydrogen and Fluorine combines to form Hydrofluoric acid. This acid again decomposes the SEI layer creating a decrease in battery capacity. Hence, breakdown of SEI layer is undesirable.
At low temperatures, the diffusion of particles inside the electrode and the electrolyte decreases. During forced charging, there is a possibility of Li metal formation instead of Li ion. This is termed as Li plating. This causes the capacity to lose irreversibly and is very rapid. A tree-like structure is formed when this occurs repeatedly called ‘Dendrites’. These protrude through the separator. This forms a bridge through the separator from the negative electrode to the positive electrode. This in turn creates local heating and finally results in thermal runaway. Hence, it is not recommended to perform charging of the battery under cold conditions. Table 3 shows the surface effects on the negative electrode of the battery.
Table 3. Surface Effect on the Negative Electrode.
| Reason | Effect | Leading to | Enhanced by |
|---|---|---|---|
| Continuous low-rate electrolyte decomposition build SEI | Loss of Li | Capacity Fade | High Temperature and SOC |
| Li plating and electrolyte decomposition | Rise in Impedance | Power Fade | High Temperature and SOC |
| Changes in Volume and SEI growth | Loss of Li | Capacity Fade | Low temperature and high C rates |
Positive electrode degradation leads to chemical products of the positive electrode dissolved in the electrolyte in general metals. These products migrate from the positive electrode of the cell through the separator and reach the negative electrode. They can become a part of SEI layer formed on the negative electrode and not electrically conductive. This is called as Anode Poisoning. Therefore, this effect increases the overall resistance of the cell. This creates a clogging effect and prevents the flow of Li, increasing the resistance.
The volume of particles in the electrode changes due to charging and discharging. The change in the volume is said to be anisotropic (different directions). This change in volume is about 10%. When the particle is cracked, it becomes exposed to fresh graphite surface with the solvent which has not yet been covered by SEI film. The cracking of the particle occurs due to the change in the volume. This co-intercalation causes surplus SEI layer to grow inside the particle and causes additional particles to crack due to additional forces. This leads to exfoliation (layers flaking off) of graphite due to which it loses its ability to store Li, reducing the capacity of the cell. In addition, gases are released when graphite interacts with the solvent. These gases expand and cause additional cracking of the material. The negative electrode itself consists of various non-active elements that include conductive additives to achieve conductivity and binders for binding the electrode particles together. Figure 6 shows particles of active materials placed below a current collector.
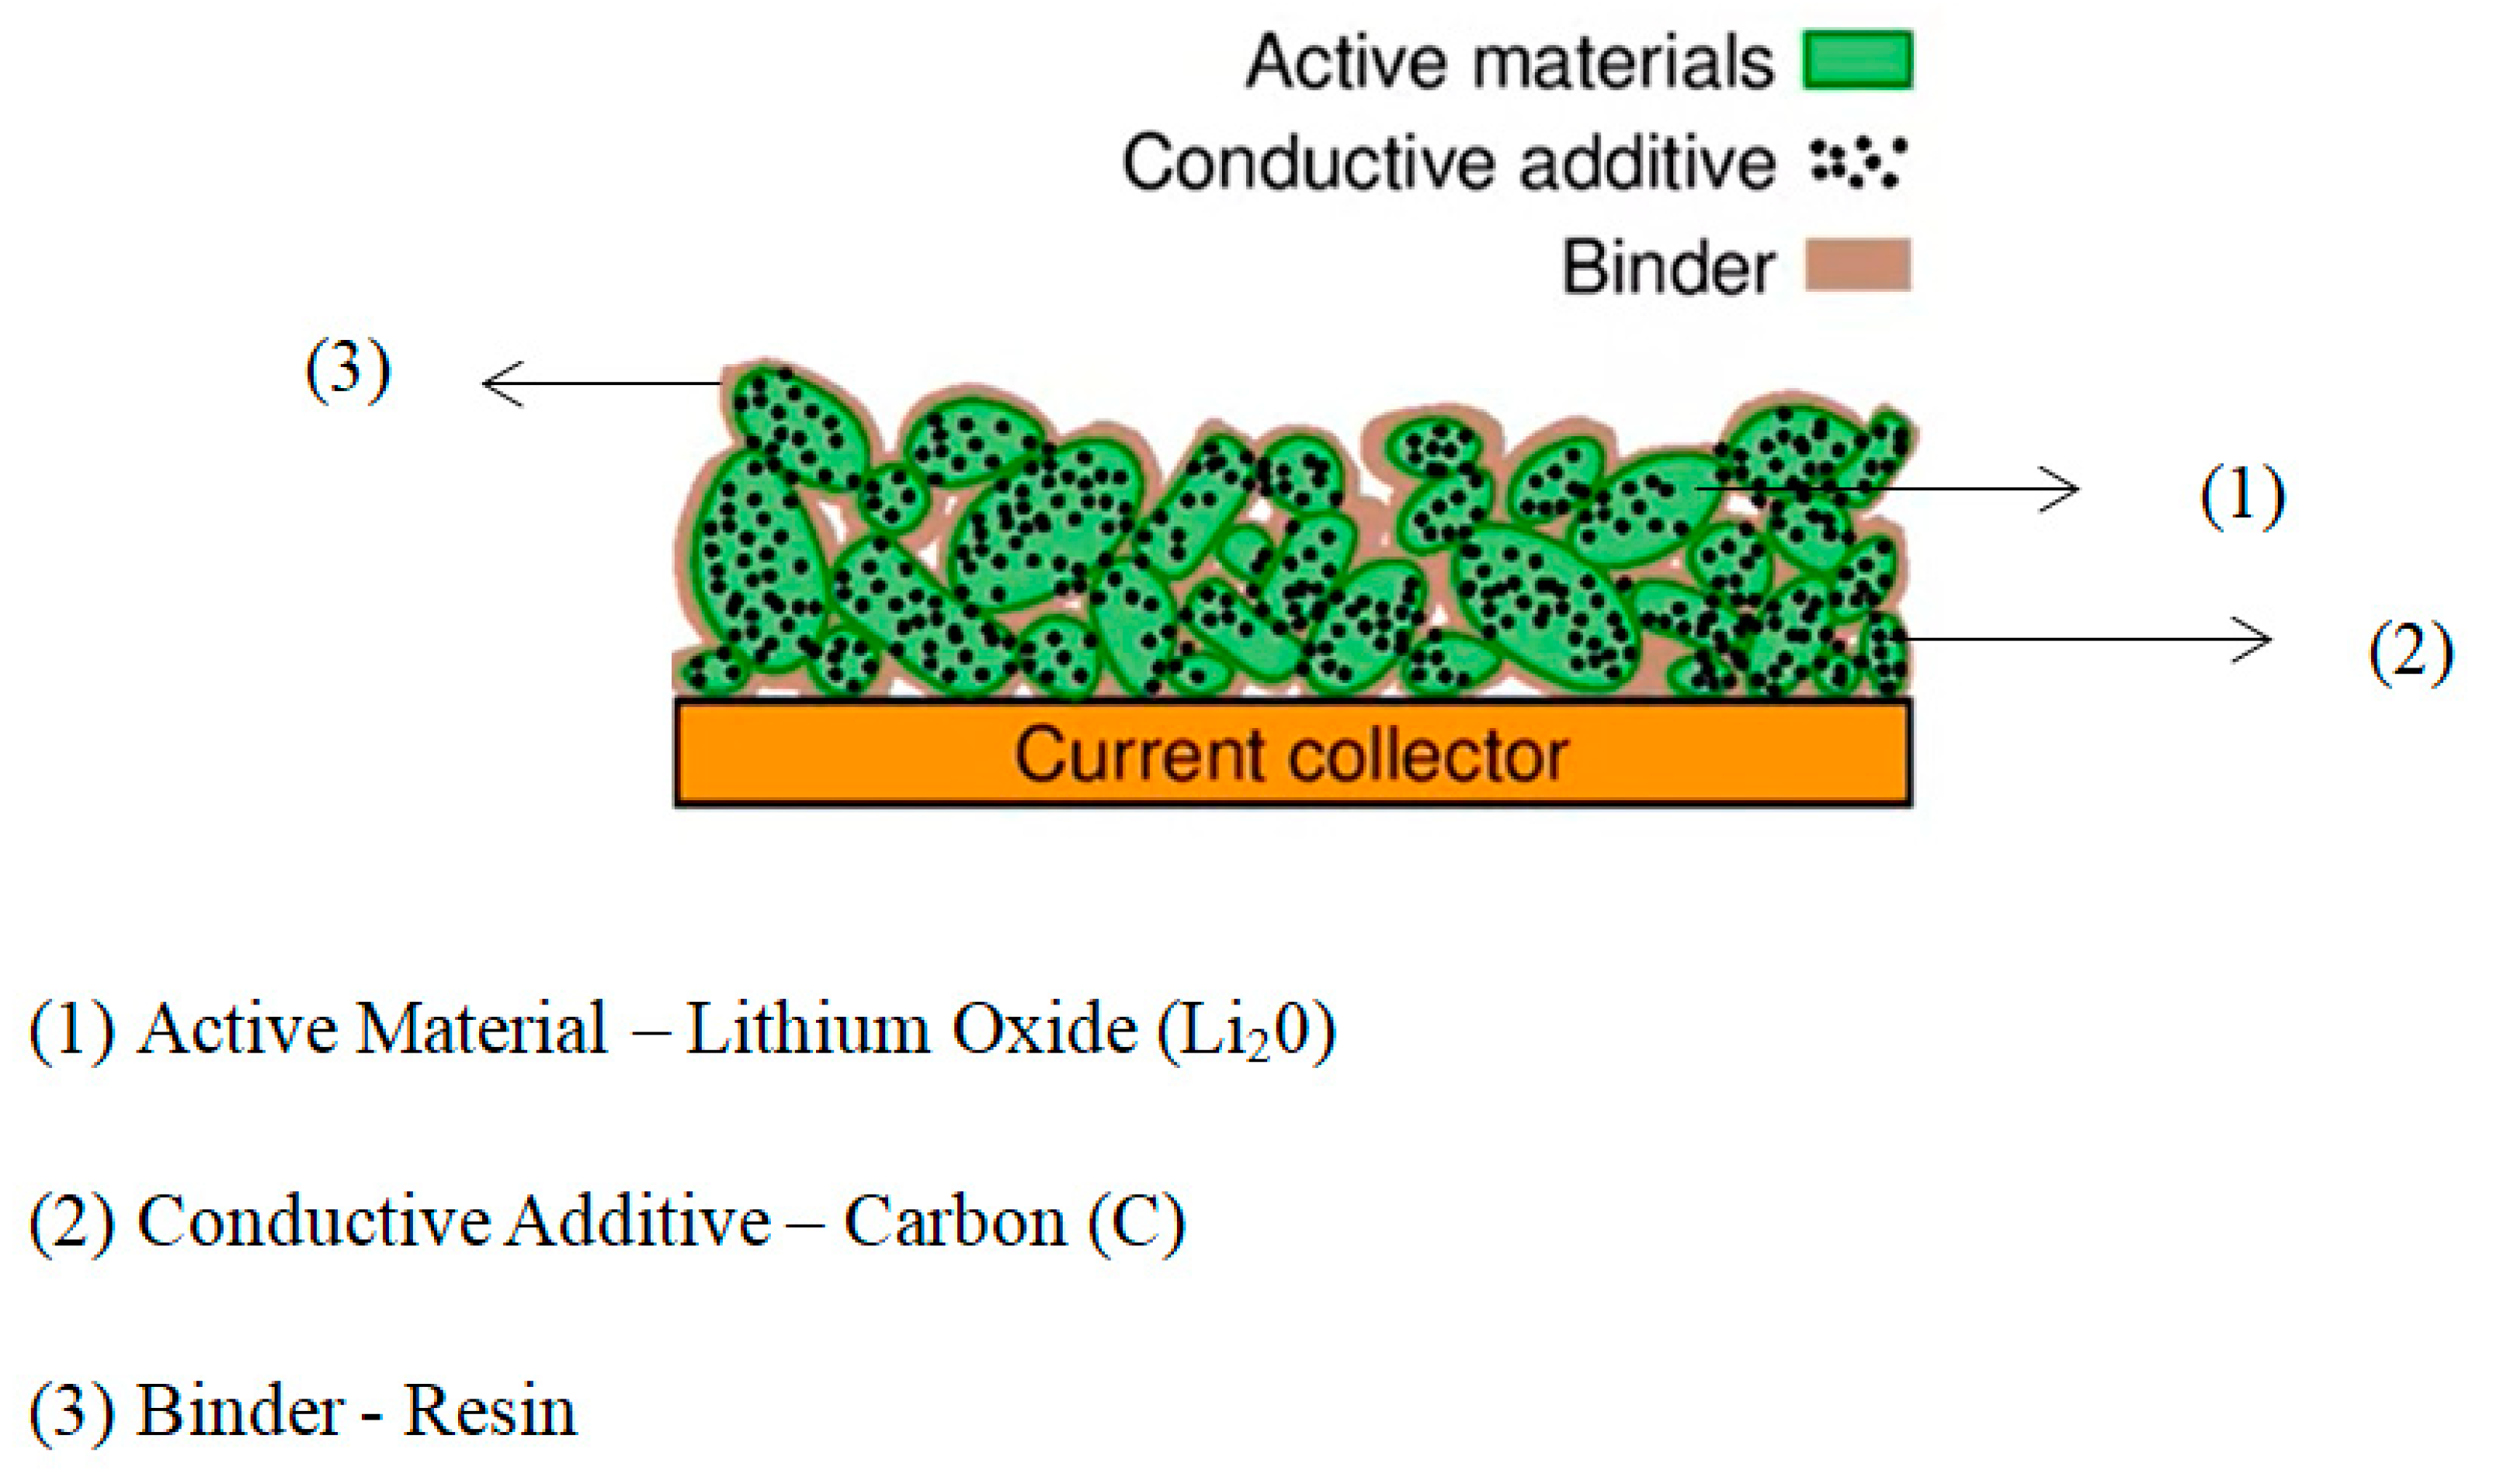
Figure 6. Composite materials in an electrode.
The stress on the electrode during charging and discharging the cell causes the particles to expand and contract. This causes fatigue to the non-active materials used at different locations. This reduces the current pathways through the electrode. This can happen between the particles or between the current collector and the particles or between binder and current collector. In a nutshell, the overall impedance increases as the particles are disconnected from each other.
When the cell is over discharged (below 1.5 V), Cu current collector corrodes release Cu2+ ions to the electrolyte. Cu material reacts with the electrolyte electrochemically. This reduces the contact between the current collector and the particles, leading to higher resistance. The Cu ions can deposit on the electrode and integrate with SEI, creating high resistance. However, the corrosion occurs at specific places creating non-uniform current and potential distribution internal to the cell. This can lead to accelerating Li plating at some parts of the cell. Table 4 shows the aging of the cell due to composite electrode materials used.
Table 4. Aging due to composite electrode materials.
| Reason | Effect | Leading to | Enhanced by |
|---|---|---|---|
| Current Collector Corrosion | Rise in Impedance | Power Fade | Over discharge and low cell SOC |
| Binder decomposition | Loss of Li | Capacity Fade | High SOC and temperature |
| Contact between particles due to change in volume | Loss of Li | Capacity Fade | Overcharge |
References
- Surya, S.; Williamson, S. Energy Storage Devices and Front-End Converter Topologies for Electric Vehicle Application Accepted for Publication E-Mobility—A New Era in Automotive Technology; Springer: Berlin/Heidelberg, Germany, 2021.
- Behabtu, H.A.; Messagie, M.; Coosemans, T.; Berecibar, M.; Anlay Fante, K.; Kebede, A.A.; Mierlo, J.V. A review of energy storage technologies’ application potentials in renewable energy sources grid integration. Sustainability 2020, 12, 10511.
- Williamson, S.S. Energy Management Strategies for Electric and Plug-In Hybrid Electric Vehicles; Springer: New York, NY, USA, 2013.
- Plett, G.L. Battery Management Systems, Volume I: Battery Modeling; Artech House: Norwood, MA, USA, 2015.
- Vetter, J.; Novák, P.; Wagner, M.R.; Veit, C.; Möller, K.C.; Besenhard, J.O.; Winter, M.; Wohlfahrt-Mehrens, M.; Vogler, C.; Hammouche, A. Ageing mechanisms in lithium-ion batteries. J. Power Sources 2005, 147, 269–281.
- Xu, J.; Deshpande, R.D.; Pan, J.; Cheng, Y.-T.; Battaglia, V.S. Electrode Side Reactions, Capacity Loss and Mechanical Degradation in Lithium-Ion Batteries. J. Electrochem. Soc. 2015, 162, A2026–A2035.
- Plett, G.L. Battery Management Systems, Volume II: Battery Modeling; Artech House: Norwood, MA, USA, 2015.
- Muralidharan, A.; Sreelekshmi, R.S.; Nair, M.G. Cell Modelling for Battery Management System in Electric Vehicles. In Proceedings of the 2020 Third International Conference on Smart Systems and Inventive Technology (ICSSIT), Tirunelveli, India, 20–22 August 2020; Institute of Electrical and Electronics Engineers (IEEE): Piscataway, NJ, USA, 2020; pp. 558–564.
- Surya, S.; Channegowda, J.; Datar, S.D.; Jha, A.S.; Victor, A. Accurate Battery Modeling Based on Pulse Charging using MATLAB/Simulink. In Proceedings of the 2020 IEEE International Conference on Power Electronics, Drives and Energy Systems (PEDES), Jaipur, India, 16–19 December 2020; pp. 1–3.
- Surya, S. Mathematical Modeling of DC-DC Converters and Li Ion Battery Using MATLAB/Simulink. IGI Glob. 2021, 104–143.
- Lam, L.; Bauer, P.; Kelder, E. A practical circuit-based model for Li-ion battery cells in electric vehicle applications. In Proceedings of the 2011 IEEE 33rd International Telecommunications Energy Conference (INTELEC), Amsterdam, The Netherlands, 9–13 October 2011.
- Surya, S.; Arjun, M.N. Effect of fast discharge of a battery on its core temperature. In Proceedings of the 2020 International Conference on Futuristic Technologies in Control Systems & Renewable Energy (ICFCR), Malappuram, India, 23–24 September 2020; IEEE: Piscataway, NJ, USA, 2020.
- Surya, S.; Bhesaniya, A.; Gogate, A.; Ankur, R.; Patil, V. Development of thermal model for estimation of core temperature of batteries. Int. J. Emerg. Electr. Power Syst. 2020, 21.
- Surya, S.; Marcis, V.; Williamson, S. Core Temperature Estimation for a Lithium Ion 18650 Cell. Energies 2020, 14, 87.
- Surya, S.; Samanta, A.; Williamson, A. Smart Core and Surface Temperature Estimation Techniques for Health-conscious Lithium-ion Battery Management Systems: A Model-to-Model Comparison. Preprint 2021, 2021070087.
- Lin, X.; Perez, H.E.; Siegel, J.B.; Stefanopoulou, A.G.; Li, Y.; Anderson, R.D.; Ding, Y.; Castanier, M.P. Online parameterization of lumped thermal dynamics in cylindrical lithium ion batteries for core temperature estimation and health monitoring. IEEE Trans. Control. Syst. Technol. 2012, 21, 1745–1755.
- Surya, S.; Channegowda, J.; Naraharisetti, K. Generalized Circuit Averaging Technique for Two Switch DC-DC Converters. In Proceedings of the 2020 8th International Conference on Power Electronics Systems and Applications (PESA), Hong Kong, China, 7–10 December 2020; IEEE: Piscataway, NJ, USA, 2020.
- Surya, S.; Williamson, S. Generalized Circuit Averaging Technique for Two-Switch PWM DC-DC Converters in CCM. Electronics 2021, 10, 392.
- Goud, J.S.; Kalpana, R.; Singh, B. An Online Method of Estimating State of Health of a Li-Ion Battery. IEEE Trans. Energy Convers. 2020, 36, 111–119.
- Chowdhury, S.; Bin Shaheed, M.N.; Sozer, Y. An Integrated State of Health (SOH) Balancing Method for Lithium-Ion Battery Cells. Comput. Sci. 2019, 5759–5763.
- Swierczynski, M.; Stroe, D.-I.; Kar, S.K. Calendar ageing of LiFePO4/C batteries in the second life applications. In Proceedings of the 2017 19th European Conference on Power Electronics and Applications (EPE’17 ECCE Europe), Warsaw, Poland, 11–14 September 2017; IEEE: Piscataway, NJ, USA, 2017.
- Locorotondo, E.; Cultrera, V.; Pugi, L.; Berzi, L.; Pasquali, M.; Andrenacci, N.; Lutzemberger, G.; Pierini, M. Impedance spectroscopy characterization of lithium batteries with different ages in second life application. In Proceedings of the 2020 IEEE International Conference on Environment and Electrical Engineering and 2020 IEEE Industrial and Commercial Power Systems Europe (EEEIC/I&CPS Europe), Madrid, Spain, 9–12 June 2020; pp. 1–6.
- Yang, S.; Zhang, Z.; Cao, R.; Wang, M.; Cheng, H.; Zhang, L.; Jiang, Y.; Li, Y.; Chen, B.; Ling, H.; et al. Implementation for a cloud battery management system based on the CHAIN framework. Energy AI 2021, 5, 100088.
- Zhu, P.; Gastol, D.; Marshall, J.; Sommerville, R.; Goodship, V.; Kendrick, E. A review of current collectors for lithium-ion batteries. J. Power Sources 2021, 485, 229321.
- Vidal, C.; Malysz, P.; Kollmeyer, P.; Emadi, A. Machine Learning Applied to Electrified Vehicle Battery State of Charge and State of Health Estimation: State-of-the-Art. IEEE Access 2020, 8, 52796–52814.
- Wu, Y.; Xue, Q.; Shen, J.; Lei, Z.; Chen, Z.; Liu, Y. State of Health Estimation for Lithium-Ion Batteries Based on Healthy Features and Long Short-Term Memory. IEEE Access 2020, 8, 28533–28547.
- Yun, Z.; Qin, W.; Shi, W.; Ping, P. State-of-Health Prediction for Lithium-Ion Batteries Based on a Novel Hybrid Approach. Energies 2020, 13, 4858.
- Song, S.; Fei, C.; Xia, H. Lithium-ion battery SOH estimation based on XGBoost algorithm with accuracy correction. Energies 2020, 13, 812.
- Agogino, A.; Goebel, K. Mill Data Set. BEST Lab, UC Berkeley. NASA Ames Prognostics Data Repository. 2007. Available online: http://ti.are.nasa.gov/prolect/prognostie-data-repository (accessed on 5 October 2007).
- Liu, Z.; Zhao, J.; Wang, H.; Yang, C. A New Lithium-Ion Battery SOH Estimation Method Based on an Indirect Enhanced Health Indicator and Support Vector Regression in PHMs. Energies 2020, 13, 830.
- Saha, B.; Goebel, K.; Poll, S.; Christophersen, J. Prognostics methods for battery health monitoring using a Bayesian framework. IEEE Trans. Instrum. Meas. 2008, 58, 291–296.
- Sheikh, S.S.; Anjum, M.; Khan, M.A.; Hassan, S.A.; Khalid, H.A.; Gastli, A.; Ben-Brahim, L. A Battery Health Monitoring Method Using Machine Learning: A Data-Driven Approach. Energies 2020, 13, 3658.
- NASA-Battery Data-Set, National Aeronautics and Space Administration. Available online: Https://ti.arc.nasa.gov/tech/dash/groups/pcoe/prognostic-data-repository/battery (accessed on 12 May 2020).
- Bonfitto, A. A Method for the Combined Estimation of Battery State of Charge and State of Health Based on Artificial Neural Networks. Energies 2020, 13, 2548.
- Tian, J.; Xiong, R.; Shen, W. State-of-Health Estimation Based on Differential Temperature for Lithium Ion Batteries. IEEE Trans. Power Electron. 2020, 35, 10363–10373.
- Tan, X.; Tan, Y.; Zhan, D.; Yu, Z.; Fan, Y.; Qiu, J.; Li, J. Real-Time State-of-Health Estimation of Lithium-Ion Batteries Based on the Equivalent Internal Resistance. IEEE Access 2020, 8, 56811–56822.
- Hussein, A.A. Adaptive Artificial Neural Network-Based Models for Instantaneous Power Estimation Enhancement in Electric Vehicles’ Li-Ion Batteries. IEEE Trans. Ind. Appl. 2018, 55, 840–849.
- United States Enviromental Protection Agency (EPA). Available online: https://www.epa.gov/vehicle-and-fuel-emissions-testing/dynamometer-drive-schedules (accessed on 7 March 2018).
- Electric Vehicle Battery Test Procedures Manual, Rev. 2 January 1996. Available online: https://avt.inl.gov/sites/default/files/pdf/battery/usabc_manual_rev2.pdf (accessed on 7 March 2018).
- Dai, H.; Zhao, G.; Lin, M.; Wu, J.; Zheng, G. A novel estimation method for the state of health of lithium-ion battery using prior knowledge-based neural network and Markov chain. IEEE Trans. Ind. Electron. 2018, 66, 7706–7716.
- NASA. PCoE Datasets: Battery Data Set. Available online: https://ti.arc.nasa.gov/tech/dash/groups/pcoe/prognostic-datarepository/ (accessed on 13 September 2018).
- Hu, X.; Che, Y.; Lin, X.; Deng, Z. Health Prognosis for Electric Vehicle Battery Packs: A Data-Driven Approach. IEEE/ASME Trans. Mechatron. 2020, 25, 2622–2632.
More
Information
Subjects:
Engineering, Electrical & Electronic
Contributors
MDPI registered users' name will be linked to their SciProfiles pages. To register with us, please refer to https://encyclopedia.pub/register
:
View Times:
1.7K
Revisions:
2 times
(View History)
Update Date:
06 Apr 2022
Table of Contents


Notice
You are not a member of the advisory board for this topic. If you want to update advisory board member profile, please contact office@encyclopedia.pub.
OK
Confirm
Only members of the Encyclopedia advisory board for this topic are allowed to note entries. Would you like to become an advisory board member of the Encyclopedia?
Yes
No
${ textCharacter }/${ maxCharacter }
Submit
Cancel
Back
Comments
${ item }
|
${ item.createdUser.fullName }
${ item.createdAt }
${ item.vote }
${ item.reply }
Delete
${ reply.createdUser.fullName }
${ reply.createdAt }
${ reply.vote }
Delete
There is no reply to this comment~
${ item.replyTextCharacter }/${ item.replyMaxCharacter }
Submit
Cancel
More
No more~
There is no comment~
${ textCharacter }/${ maxCharacter }
Submit
Cancel
${ selectedItem.replyTextCharacter }/${ selectedItem.replyMaxCharacter }
Submit
Cancel
Confirm
Are you sure to Delete?
Yes
No