Your browser does not fully support modern features. Please upgrade for a smoother experience.
Submitted Successfully!
 +1 credit
Thank you for your contribution! You can also upload a video entry or images related to this topic.
For video creation, please contact our Academic Video Service.
| Version | Summary | Created by | Modification | Content Size | Created at | Operation |
|---|---|---|---|---|---|---|
| 1 | Nadia Farhat | -- | 1529 | 2022-03-30 11:00:39 | | | |
| 2 | Yvaine Wei | -9 word(s) | 1520 | 2022-03-31 05:15:26 | | |
Video Upload Options
We provide professional Academic Video Service to translate complex research into visually appealing presentations. Would you like to try it?
Cite
If you have any further questions, please contact Encyclopedia Editorial Office.
Farhat, N.; , .; Pulido Beltran, L.; Vrouwenvelder, J.S. Permeation Increases Biofilm Development in Nanofiltration Membranes. Encyclopedia. Available online: https://encyclopedia.pub/entry/21165 (accessed on 26 July 2026).
Farhat N, , Pulido Beltran L, Vrouwenvelder JS. Permeation Increases Biofilm Development in Nanofiltration Membranes. Encyclopedia. Available at: https://encyclopedia.pub/entry/21165. Accessed July 26, 2026.
Farhat, Nadia, , Laura Pulido Beltran, Johannes Simon Vrouwenvelder. "Permeation Increases Biofilm Development in Nanofiltration Membranes" Encyclopedia, https://encyclopedia.pub/entry/21165 (accessed July 26, 2026).
Farhat, N., , ., Pulido Beltran, L., & Vrouwenvelder, J.S. (2022, March 30). Permeation Increases Biofilm Development in Nanofiltration Membranes. In Encyclopedia. https://encyclopedia.pub/entry/21165
Farhat, Nadia, et al. "Permeation Increases Biofilm Development in Nanofiltration Membranes." Encyclopedia. Web. 30 March, 2022.
Copy Citation
Nutrient limitation has been proposed as a biofouling control strategy for membrane systems. However, the impact of permeation on biofilm development under phosphorus-limited and enriched conditions is poorly understood. The biofilm development is analyzed in membrane fouling simulators (MFSs) with and without permeation supplied with water varying dosed phosphorus concentrations (0 and 25 μg P·L-1).
biofouling
biofilm development
1. Introduction
It has been over 60 years since the first significant membrane application when a German manufacturer developed a microfiltration membrane for industrial purposes. Years later, in the late 1950s, a fundamental breakthrough in membrane science came when Loeb and Sourirajan discovered reverse osmosis membranes for water desalination [1][2][3]. Since then, humanity has benefited from significant advancements in membrane technologies.
One of the main drawbacks of membrane systems is membrane fouling, which can occur as particulate/colloidal fouling, organic/inorganic fouling, and biofouling [4]. Biofouling is when a biofilm develops the accumulation of bacteria and extracellular polymeric substances (EPS). Biofilm formation occurs in five stages: (i) Motile planktonic bacteria cells attach to the surface; (ii) the attachment becomes irreversible when bacteria cells aggregate to form microcolonies and start excreting EPS; (iii) cell-to-cell adhesion occurs forming multi-layered clusters, and a biofilm is formed; (iv) the biofilm matures and grows into dense mushroom-shaped structures; the EPS matrix provides protection against environmental threats; (v) the biofilm reaches a critical mass and disperses planktonic bacteria cells that will colonize other surfaces [5][6]. Biofouling causes operational system performance decline, such as pressure drop increase, flux decline, and increase in the salt passage [7]. Biofouling has been reported to contribute to more than 45% of all membrane fouling, and it has been considered a significant problem in nanofiltration and reverse osmosis membrane systems as it increases the energy demands and the overall water cost [8]. Biofouling could increase operational costs up to 30% and the overall water cost [9][10]. Biofouling has been defined as the “Achilles heel” of membrane processes [11]. Even after 99.9% of bacterial cell removal, the remaining bacteria can use the biodegradable nutrients in the feed water to develop a biofilm. Major factors contributing to biofouling are nutrient concentration in the feed water and shear forces in the system [11].
The first significant factor influencing biofilm development is the nutrient concentration in the feed water. Consequently, nutrient limitation has been proposed as a biofouling control strategy for membrane systems [12][13][14]. Recent research has focused on analyzing the effect of varying phosphorus concentrations in the feed water to control biofouling or enhance membrane cleaning strategies [15][16]. One of the challenges in applying this approach is to define the phosphorus concentration threshold at which microorganisms could inhibit their growth, as the detection limit of current techniques for measuring phosphorus in water does not go below the microgram per liter level.
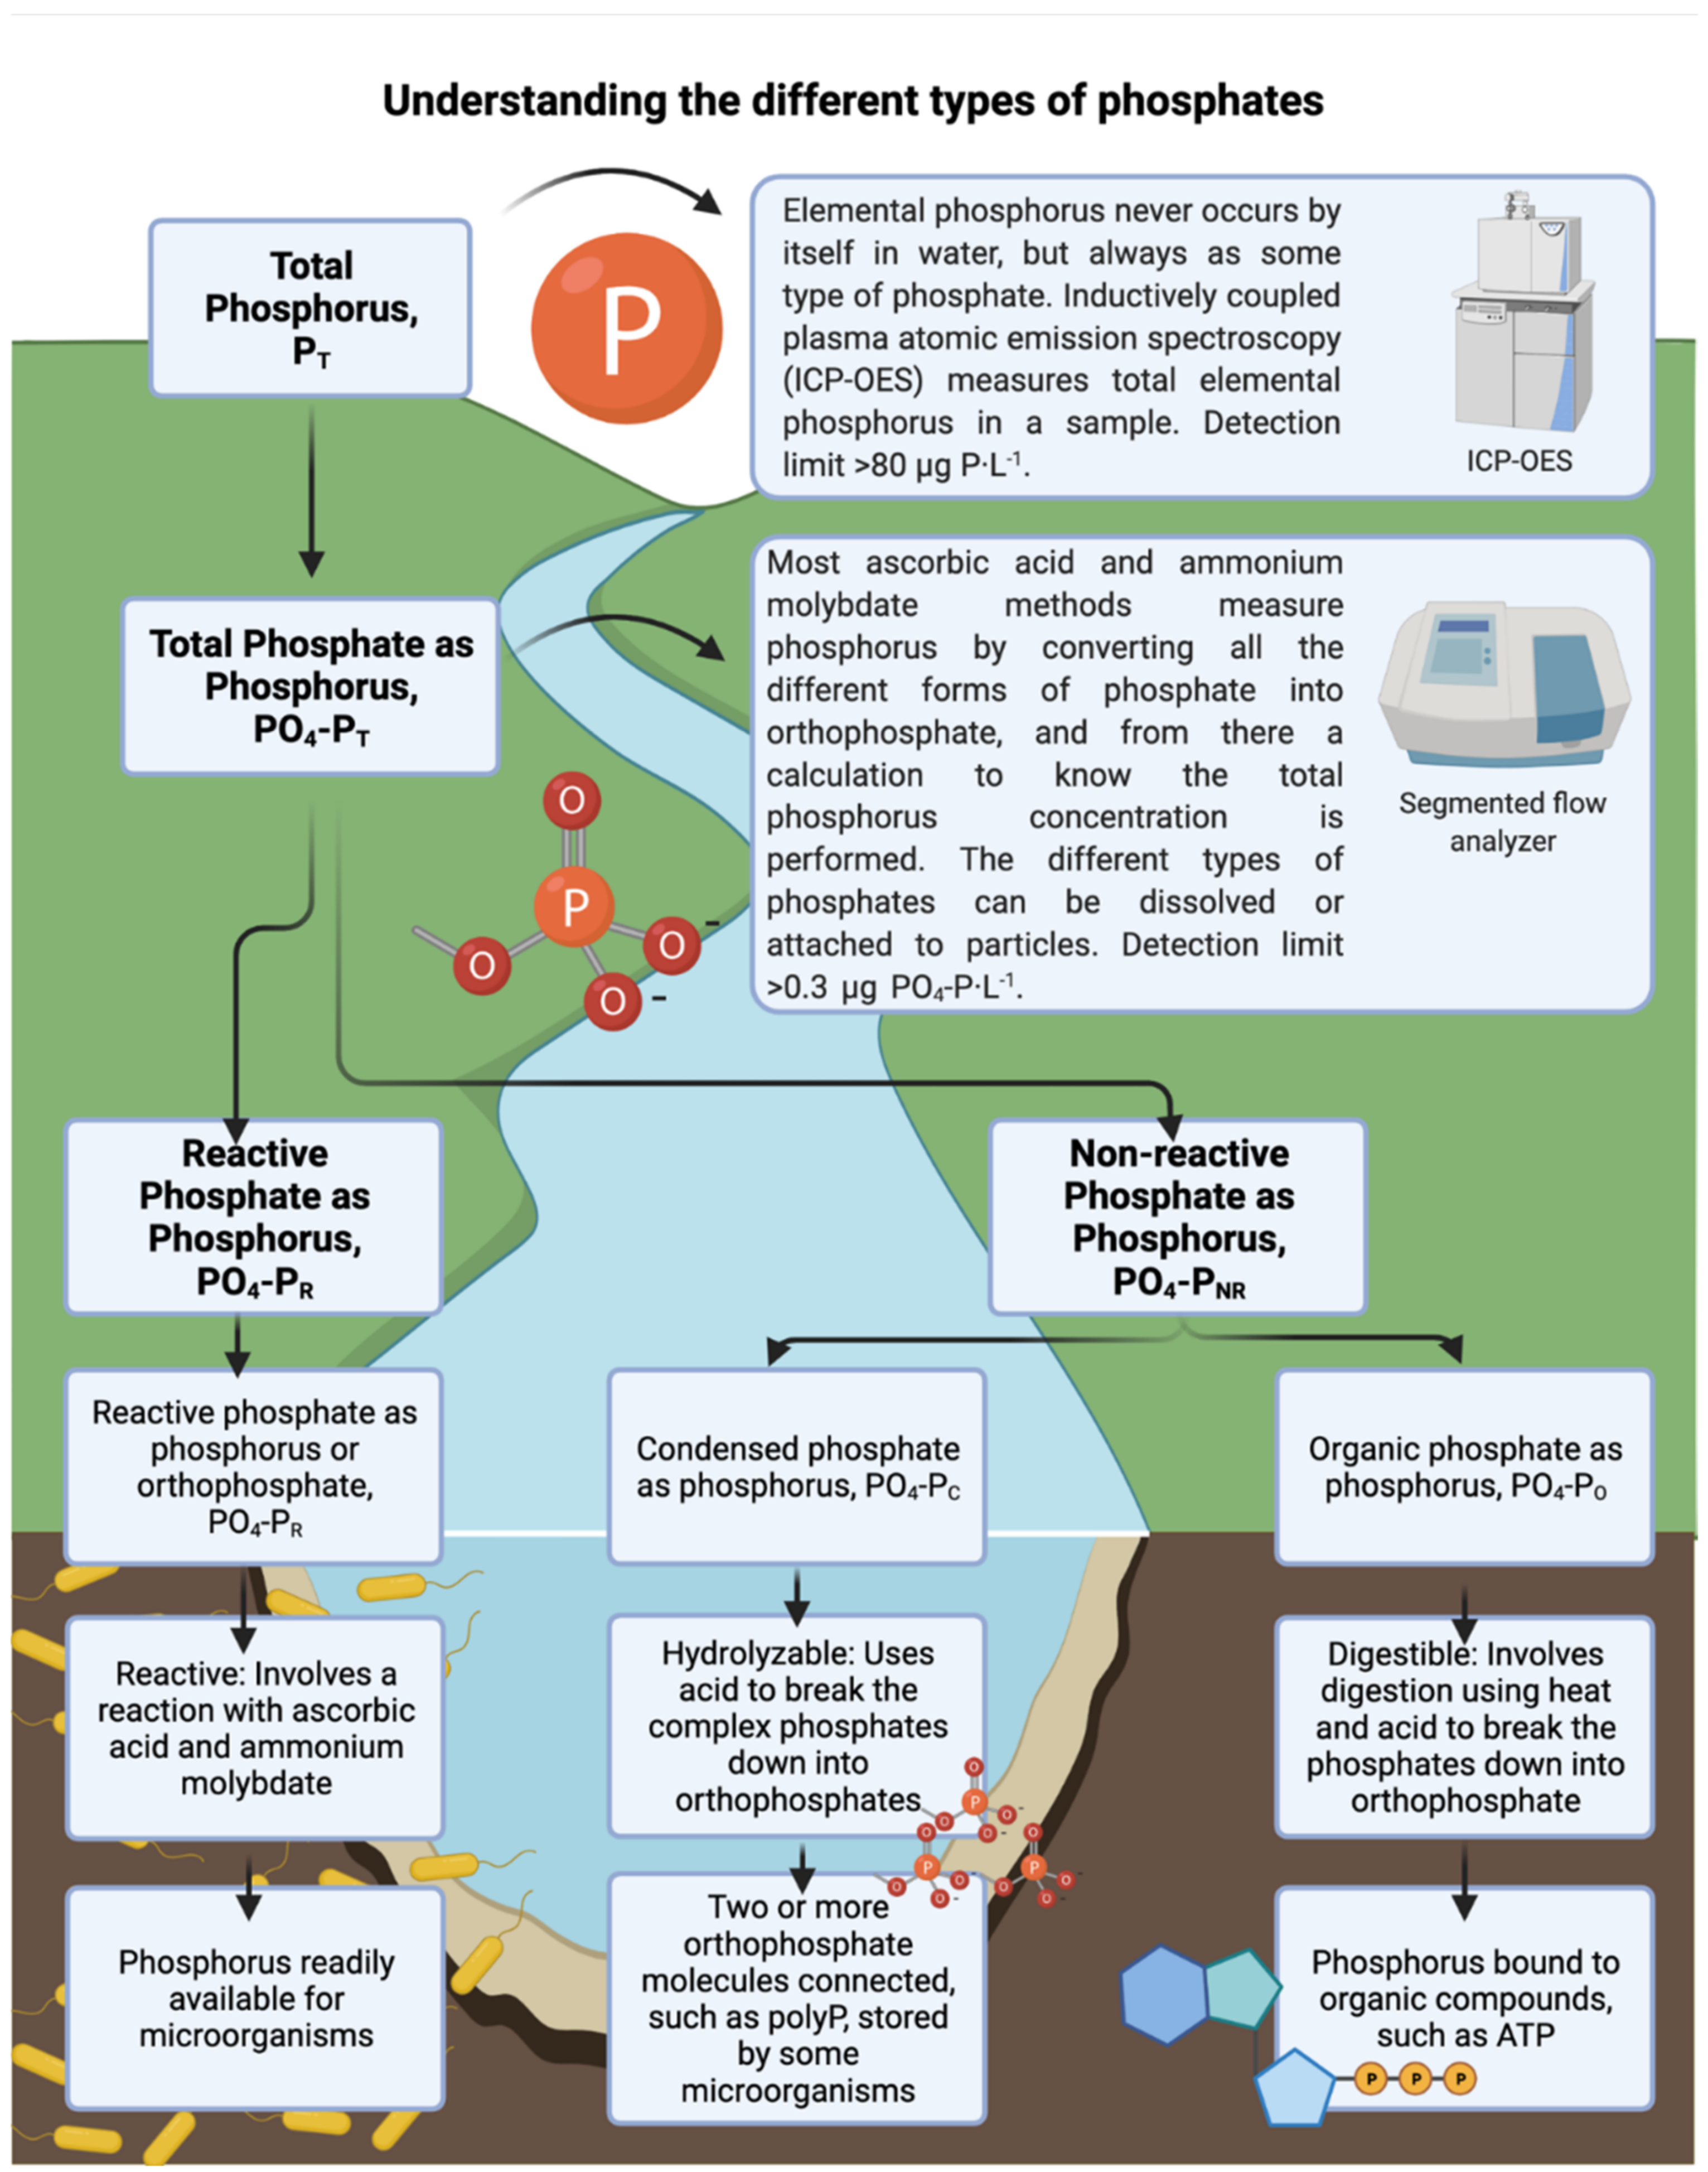
lemental phosphorus never occurs in water but always as some type of phosphate [17]. Most of the quantification methods measure the concentration of different kinds of phosphates, and from there a calculation to obtain the elemental phosphorus concentration is performed. Phosphates can be orthophosphate (reactive form), condensed, and organic (non-reactive forms). Reactive phosphate or orthophosphate is readily available for microbial utilization [12]. Non-reactive phosphate includes condensed and organic phosphates. Condensed phosphates (like meta, pyro, and polyphosphate) are multiple orthophosphate molecules joined by an oxygen atom [18]. Organic phosphates are phosphates bound to organic compounds [19][20]. Under phosphorus limitation, bacteria can convert the less reactive forms of phosphate (condensed and organic) into orthophosphate, increasing the biodegradable phosphorus concentration in the water [21] to promote bacterial survival and growth (Figure 1).
Other significant factors influencing biofilm development are the hydrodynamics and shear forces in the flow channel. Vrouwenvelder et al. (2009) [24] demonstrated that increasing the crossflow velocity from 0.04 to 0.24 m·s−1 in a membrane fouling simulator increased the biomass accumulated on a reverse osmosis membrane translating into a higher pressure drop increase. As for the impact of permeation on biofilm development, previous studies have concluded that permeation does not influence biofilm development and hence has no effect on membrane performance parameters [25]. The conclusions follow the assumption that the perpendicular component of the permeation flow velocity is neglectable (for NF around 1.1 × 10⁻⁵ m·s−1 and for RO around 4.0 × 10⁻⁶ m·s−1) compared with the higher parallel component of the crossflow velocity (at least 0.1 m·s−1) [26][27].
2. Permeation Caused a Faster Decline in System Performance
The shear forces and hydrodynamics in the flow channel influence biofilm development [11]. In crossflow membrane systems, there are two simultaneous flow velocities: (i) The feed crossflow velocity, flowing parallel to the membrane walls, and (ii) the permeate crossflow velocity, flowing perpendicular to the membrane surface [28]. Previous studies performed in nanofiltration membranes in a monitor, test rigs, a pilot-scale, and a full-scale installation demonstrated that, irrespective of whether a flux was applied or not, the feed channel pressure drop and ATP increased [25]. The literature conclusions regarding the importance of considering permeation in membrane studies are therefore contradictory. In ultrafiltration membranes, Eshed et al. (2008) [28] found the impact of the permeate drag force on the biofouling layer very important and concluded that the permeate flow enhanced biofilm development. A higher pressure drop increase and higher flux decline were observed for biofilms grown under permeation conditions than non-permeation conditions. Overall, more biomass with higher EPS developed in MFS with permeation compared without permeation at the two dosed phosphorus concentration conditions. Flux induces convective transport of nutrients and solutes to the membrane surface [29][30]; therefore, the impact of flux on biofilm development varied depending on the phosphorous concentration.
3. Permeation Impact on Biofilm Development Varied Depending on the Nutrient Condition
The effect of permeation on biofilm localization varied in extent depending on the phosphorous concentration tested. Previous studies showed that, in the presence of a feed spacer, biofilm starts to develop first at the spacer [31][32]. When no nutrient limitations existed in the 25 μg P·L−1 condition, biofilm started to develop and expand on the spacer, and permeation resulted in more biomass without a major shift in biofilm localization. On the other hand, at the 0 μg P·L−1, the permeation effect on biofilm localization was more pronounced. More biofilm coverage was observed on the membrane under permeation than no permeation conditions. Biofilms spread more to enhance nutrient capture under limiting conditions [14], and permeation force contributed to more accumulation of substrate in the membrane area resulting in a higher membrane biofilm coverage. The impact of biofilm development on performance is dependent on the area the biofilm occupies in the flow channel and biofilm characteristics such as EPS nature, concentration, and properties (EPS to bacterial cell ratio). The results reaffirm that at a lower phosphorus concentration, few bacteria cells start producing more EPS [15][16]. Values of EPS to bacteria cells for different types of biofilms reported in the literature range from 0.2–4.5 [33][34].
4. Practical Implications and Future Research
Since the realization of the biofouling problem in membrane systems, all efforts have been put to control biofouling. Permeation is one of the main operational parameters in the system that was investigated to control biofouling. The critical flux concept, where below certain flux biofouling would not occur, has been supported and opposed in previous studies [16][35][36]. Results reinforce that with only controlling flux, biofouling cannot be controlled. It is shown that even at ultra-trace reactive phosphate as phosphorus concentration in the feed water, and no permeation, bacteria developed a biofilm, with few bacterial cells but high EPS per cell. Furthermore, results highlighted that with flux conditions, biofouling could be more severe depending on nutrient availability, emphasizing the need to include flux in biofouling studies.
Further research is needed regarding feed water nutrient manipulation for biofouling control with a focus on engineering biofilms that are controllable and with enhanced cleanability through more environmentally friendly methods. At a certain threshold of low phosphorus content in the feed water, phosphorus limitation shows a promising approach to developing biofilms that are easier to control and clean with more sustainable methods. Up to today, most biofouling studies quantify the total cell count. However, little research has been done to understand the types and concentration of macromolecules inside bacterial cells, like polyphosphates, to determine the relationship between biofilm development and membrane performance parameters. Flow cytometry has proven a promising technique to characterize phosphate accumulating organisms and has been used as a polyphosphate detector [31]. These macromolecules either inside the bacterial cells or in the EPS might influence biofilm development and biofilm localization in the flow channel. Therefore, research should continue analyzing the relationship between nutrients in the feed water, biofilm localization, and the effect on membrane performance decline.
5. Conclusions
- Permeation resulted in a faster decline in system performance (faster feed channel pressure drop increase and higher transmembrane pressure increase).
- Permeation impact on biofilm development varied depending on nutrient condition with a stronger impact at low phosphorous concentration:
- For the 0 μg P·L−1 under permeation conditions, the pressure drop increase is explained by “expanded” EPS in the flow channel, thus biofilm localization. The higher flux decline was explained by a thicker biofilm, resulting from a higher phosphorus accumulation on the membrane.
- For the 25 μg P·L−1 under permeation conditions, the pressure drop increase is explained by a higher quantity of “condensed” EPS around the spacer, thus biofilm structure and composition.
References
- Wenten, G. Recent Development in Membrane Science and Its Industrial Applications. Membr. Sci. Technol. 2003, 24, 1009–1024. Available online: https://rdo.psu.ac.th/sjstweb/journal/24-Suppl-1/27membrane-science.pdf (accessed on 7 January 2022).
- Loeb, S. The Loeb-Sourirajan Membrane: How It Came About. 1981. Available online: https://pubs.acs.org/sharingguidelines (accessed on 7 August 2021).
- Fane, A.G.; Wang, R.; Jia, Y. Membrane Technology: Past, Present and Future. In Membrane and Desalination Technologies; Wang, L.K., Chen, J.P., Hung, Y.-T., Shammas, N.K., Eds.; Humana Press: Totowa, NJ, USA, 2011; pp. 1–45.
- Guo, W.; Ngo, H.-H.; Li, J. A mini-review on membrane fouling. Bioresour. Technol. 2012, 122, 27–34.
- Maunders, E.; Welch, M. Matrix exopolysaccharides; the sticky side of biofilm formation. FEMS Microbiol. Lett. 2017, 364, 120.
- Unosson, E. Antibacterial Strategies for Titanium Biomaterials. 2015. Available online: http://urn.kb.se/resolve?urn=urn:nbn:se:uu:diva-249181 (accessed on 26 September 2021).
- Vrouwenvelder, J.; Manolarakis, S.; van der Hoek, J.; van Paassen, J.; van der Meer, W.; van Agtmaal, J.; Prummel, H.; Kruithof, J.; van Loosdrecht, M. Quantitative biofouling diagnosis in full scale nanofiltration and reverse osmosis installations. Water Res. 2008, 42, 4856–4868.
- Nguyen, T.; Roddick, F.A.; Fan, L. Biofouling of Water Treatment Membranes: A Review of the Underlying Causes, Monitoring Techniques and Control Measures. Membranes 2012, 2, 804–840.
- Flemming, H.-C. The perfect slime. Colloids Surf. B Biointerfaces 2011, 86, 251–259.
- Jafari, M.; Vanoppen, M.; van Agtmaal, J.; Cornelissen, E.; Vrouwenvelder, J.; Verliefde, A.; van Loosdrecht, M.; Picioreanu, C. Cost of fouling in full-scale reverse osmosis and nanofiltration installations in the Netherlands. Desalination 2021, 500, 114865.
- Flemming, H.-C.; Schaule, G.; Griebe, T.; Schmitt, J.; Tamachkiarowa, A. Biofouling—the Achilles heel of membrane processes. Desalination 1997, 113, 215–225.
- Vrouwenvelder, J.; Beyer, F.; Dahmani, K.; Hasan, N.; Galjaard, G.; Kruithof, J.; van Loosdrecht, M. Phosphate limitation to control biofouling. Water Res. 2010, 44, 3454–3466.
- Kim, C.-M.; Kim, S.-J.; Kim, L.H.; Shin, M.S.; Yu, H.-W.; Kim, I.S. Effects of phosphate limitation in feed water on biofouling in forward osmosis (FO) process. Desalination 2014, 349, 51–59.
- Farhat, N.; Javier, L.; Van Loosdrecht, M.; Kruithof, J.; Vrouwenvelder, J. Role of feed water biodegradable substrate concentration on biofouling: Biofilm characteristics, membrane performance and cleanability. Water Res. 2019, 150, 1–11.
- Javier, L.; Farhat, N.M.; Vrouwenvelder, J.S. Enhanced hydraulic cleanability of biofilms developed under a low phosphorus concentration in reverse osmosis membrane systems. Water Res. X 2021, 10, 100085.
- Javier, L.; Farhat, N.M.; Desmond, P.; Linares, R.V.; Bucs, S.; Kruithof, J.C.; Vrouwenvelder, J.S. Biofouling control by phosphorus limitation strongly depends on the assimilable organic carbon concentration. Water Res. 2020, 183, 116051.
- Monaghan, E.J.; Ruttenberg, K.C. Dissolved organic phosphorus in the coastal ocean: Reassessment of available methods and seasonal phosphorus profiles from the Eel River Shelf. Limnol. Oceanogr. 1999, 44, 1702–1714.
- Markowitz, M.M. Defining the Condensed Phosphates. J. Chem. Educ. 1956, 33, 36.
- Estela, J.M.; Cerdà, V. Flow analysis techniques for phosphorus: An overview. Talanta 2005, 66, 307–331.
- Mine, A.H.; Coleman, M.L.; Colman, A.S. Phosphorus Release and Regeneration Following Laboratory Lysis of Bacterial Cells. Front. Microbiol. 2021, 12, 641700.
- Lehtola, M.J.; Miettinen, I.T.; Vartiainen, T.; Myllykangas, T.; Martikainen, P.J. Microbially Available Organic Carbon, Phosphorus, and Microbial Growth in Ozonated Drinking Water. Water Res. 2001, 35, 1635–1640.
- Neo. Low Phosphorus in Wastewater Treatment, Phosphorus Limit. 2020. Available online: https://www.neomaterials.com/phosphorus-reduction-in-wastewater-treatment/ (accessed on 3 August 2021).
- Yang, J.; Bai, J.; Liu, M.; Chen, Y.; Wang, S.; Yang, Q. Determination of Phosphorus in Soil by ICP-OES Using an Improved Standard Addition Method. J. Anal. Methods Chem. 2018, 2018, 1324751.
- Vrouwenvelder, J.S.; Hinrichs, C.; Van Der Meer, W.G.; van Loosdrecht, M.; Kruithof, J.C. Pressure drop increase by biofilm accumulation in spiral wound RO and NF membrane systems: Role of substrate concentration, flow velocity, substrate load and flow direction. Biofouling 2009, 25, 543–555.
- Vrouwenvelder, J.; van Paassen, J.; van Agtmaal, J.; van Loosdrecht, M.; Kruithof, J. A critical flux to avoid biofouling of spiral wound nanofiltration and reverse osmosis membranes: Fact or fiction? J. Membr. Sci. 2009, 326, 36–44.
- Chiao, Y.-H.; Patra, T.; Ang, M.B.M.Y.; Chen, S.-T.; Almodovar, J.; Qian, X.; Wickramasinghe, S.R.; Hung, W.-S.; Huang, S.-H.; Chang, Y.; et al. Zwitterion Co-Polymer PEI-SBMA Nanofiltration Membrane Modified by Fast Second Interfacial Polymerization. Polymers 2020, 12, 269.
- Okamoto, Y.; Lienhard, J.H. How RO membrane permeability and other performance factors affect process cost and energy use: A review. Desalination 2019, 470, 114064.
- Eshed, L.; Yaron, S.; Dosoretz, C.G. Effect of Permeate Drag Force on the Development of a Biofouling Layer in a Pressure-Driven Membrane Separation System. Appl. Environ. Microbiol. 2008, 74, 7338–7347.
- Chong, T.H.; Wong, F.; Fane, A. The effect of imposed flux on biofouling in reverse osmosis: Role of concentration polarisation and biofilm enhanced osmotic pressure phenomena. J. Membr. Sci. 2008, 325, 840–850.
- Suwarno, S.; Chen, X.; Chong, T.H.; McDougald, D.; Cohen, Y.; Rice, S.; Fane, A. Biofouling in reverse osmosis processes: The roles of flux, crossflow velocity and concentration polarization in biofilm development. J. Membr. Sci. 2014, 467, 116–125.
- Farhat, N.; Staal, M.; Siddiqui, A.; Borisov, S.; Bucs, S.; Vrouwenvelder, H. Early non-destructive biofouling detection and spatial distribution: Application of oxygen sensing optodes. Water Res. 2015, 83, 10–20.
- Vrouwenvelder, J.S.; Von Der Schulenburg, D.G.; Kruithof, J.C.; Johns, M.L.; Van Loosdrecht, M.C.M. Biofouling of spiral-wound nanofiltration and reverse osmosis membranes: A feed spacer problem. Water Res. 2009, 43, 583–594.
- Ghosh, P.; Mondal, J.; Ben-Jacob, E.; Levine, H. Mechanically-driven phase separation in a growing bacterial colony. Proc. Natl. Acad. Sci. USA 2015, 112, E2166–E2173.
- NI, B.-J.; Yu, H.-Q. Microbial Products of Activated Sludge in Biological Wastewater Treatment Systems: A Critical Review. Crit. Rev. Environ. Sci. Technol. 2011, 42, 187–223.
- Derlon, N.; Peter-Varbanets, M.; Scheidegger, A.; Pronk, W.; Morgenroth, E. Predation influences the structure of biofilm developed on ultrafiltration membranes. Water Res. 2012, 46, 3323–3333.
- Desmond, P.; Morgenroth, E.; Derlon, N. Physical structure determines compression of membrane biofilms during Gravity Driven Membrane (GDM) ultrafiltration. Water Res. 2018, 143, 539–549.
More
Information
Subjects:
Environmental Sciences
Contributors
MDPI registered users' name will be linked to their SciProfiles pages. To register with us, please refer to https://encyclopedia.pub/register
:
View Times:
655
Revisions:
2 times
(View History)
Update Date:
31 Mar 2022
Table of Contents


Notice
You are not a member of the advisory board for this topic. If you want to update advisory board member profile, please contact office@encyclopedia.pub.
OK
Confirm
Only members of the Encyclopedia advisory board for this topic are allowed to note entries. Would you like to become an advisory board member of the Encyclopedia?
Yes
No
${ textCharacter }/${ maxCharacter }
Submit
Cancel
Back
Comments
${ item }
|
${ item.createdUser.fullName }
${ item.createdAt }
${ item.vote }
${ item.reply }
Delete
${ reply.createdUser.fullName }
${ reply.createdAt }
${ reply.vote }
Delete
There is no reply to this comment~
${ item.replyTextCharacter }/${ item.replyMaxCharacter }
Submit
Cancel
More
No more~
There is no comment~
${ textCharacter }/${ maxCharacter }
Submit
Cancel
${ selectedItem.replyTextCharacter }/${ selectedItem.replyMaxCharacter }
Submit
Cancel
Confirm
Are you sure to Delete?
Yes
No