Submitted Successfully!
To reward your contribution, here is a gift for you: A free trial for our video production service.
Thank you for your contribution! You can also upload a video entry or images related to this topic.
Version Summary Created by Modification Content Size Created at Operation
1 + 4823 word(s) 4823 2022-03-17 04:42:32 |
2 update layout and references -1626 word(s) 3197 2022-03-29 11:02:31 | |
3 update layout Meta information modification 3197 2022-03-31 04:48:35 |

Video Upload Options

Do you have a full video?

Confirm

Are you sure to Delete?
Cite
If you have any further questions, please contact Encyclopedia Editorial Office.
Casciati, A. Glioblastoma Cells. Encyclopedia. Available online: https://encyclopedia.pub/entry/21132 (accessed on 24 April 2024).
Casciati A. Glioblastoma Cells. Encyclopedia. Available at: https://encyclopedia.pub/entry/21132. Accessed April 24, 2024.
Casciati, Arianna. "Glioblastoma Cells" Encyclopedia, https://encyclopedia.pub/entry/21132 (accessed April 24, 2024).
Casciati, A. (2022, March 28). Glioblastoma Cells. In Encyclopedia. https://encyclopedia.pub/entry/21132
Casciati, Arianna. "Glioblastoma Cells." Encyclopedia. Web. 28 March, 2022.
Glioblastoma Cells
Edit

Glioblastoma multiforme (GBM) is the most common brain cancer in adults. GBM starts from a small fraction of poorly differentiated and aggressive cancer stem cells (CSCs) responsible for aberrant proliferation and invasion. Due to extreme tumor heterogeneity, actual therapies provide poor positive outcomes, and cancers usually recur. Therefore, alternative approaches, possibly targeting CSCs, are necessary against GBM.

cancer stem cells (CSCs) glioma neurospheres

1. Introduction

Glioblastoma Multiforme (GBM) is the most lethal brain tumor in adults, with a survival time of 12–15 months after initial diagnosis [1]. The highly resistant nature of GBM is largely due to extreme intra-tumoral heterogeneity [2][3][4][5][6][7][8]. As demonstrated in several cancers, GBM is thought to arise from cancer stem cells (CSCs), representing a small percentage of all cancer cells responsible for tumor development and progression [9][10][11]. These cells, characterized by a complex mixture of genetic alterations [12][13], express high levels of stem markers involved in self-renewal and are intrinsically resistant to standard therapies (such as radiotherapy and chemotherapy), causing tumor spread. CSCs are consequently responsible for tumor relapses [14][15][16][17][18].
Notably, the canonical CSC paradigm has been recently revised, and it is now widely accepted that the CSC phenotype is characterized as a dynamic cellular state rather than a fixed population. CSC phenotypic heterogeneity arises from reversible cell state transitions in response to varying intracellular/extracellular signals [19]. Lineage tracing experiments in many solid tumors clearly demonstrated the continuous turnover of CSCs that under epithelial mesenchymal transition can convert from non-CSCs [20][21][22]. The dynamic and bidirectional transition states among epithelial, mesenchymal and one or more hybrid epithelial/mesenchymal phenotypes [23], called “epithelial mesenchymal plasticity,” show a dynamic reversible nature in cancer cells and have a strong impact on cancer progression [19].
In light of this complex scenario, new therapies to treat highly aggressive and heterogeneous GMB are required and remain a main challenge in current oncologic research. Recently, ultra-short pulsed electric fields (PEF) of high amplitude (from few to hundreds of kV/m) and short duration (from a few milliseconds to few microseconds) have emerged as a very powerful physical agent provoking cell reversible or irreversible cell electropermeabilization, both tested in anti-cancer therapies [24][25][26][27]. Indeed, electrically mediated treatments using PEF are rapidly increasing through selective tumor cells targeting using a non-thermal process, resulting in the reversible or irreversible destabilization of cell plasma membranes. In the reversible case, cell membrane permeabilization allows the entrance of toxic drugs (i.e., electrochemotherapy). In irreversible applications, electric pulses disrupt cell homeostasis and consequently cause cell death (irreversible electroporation IRE, or the more recent high-frequency irreversible electroporation H-FIRE approach) [25][28][29][30]. The non-thermal nature of these electric signals preserves the healthy tissues surrounding the tumors, therefore enabling the treatment of localized masses, including in delicate anatomical locations.
The impact of PEF was recently investigated on GBM cell lines, suggesting these electric stimuli are an extremely promising glioma therapy [12]. It also demonstrated that the use of PEF as a novel GBM therapy is related to the fact that it facilitates temporary blood–brain barrier disruption, allowing easy and effective penetration of therapeutic reagents [31][32], as well as the induction of immunogenic cell death for prolonged antitumor immunity [33]. In addition to these important aspects, due to GBM heterogeneity, the characterization of GBM CSCs’ response to these electric pulses represents a new and poorly investigated concept in search of new GBM therapies.

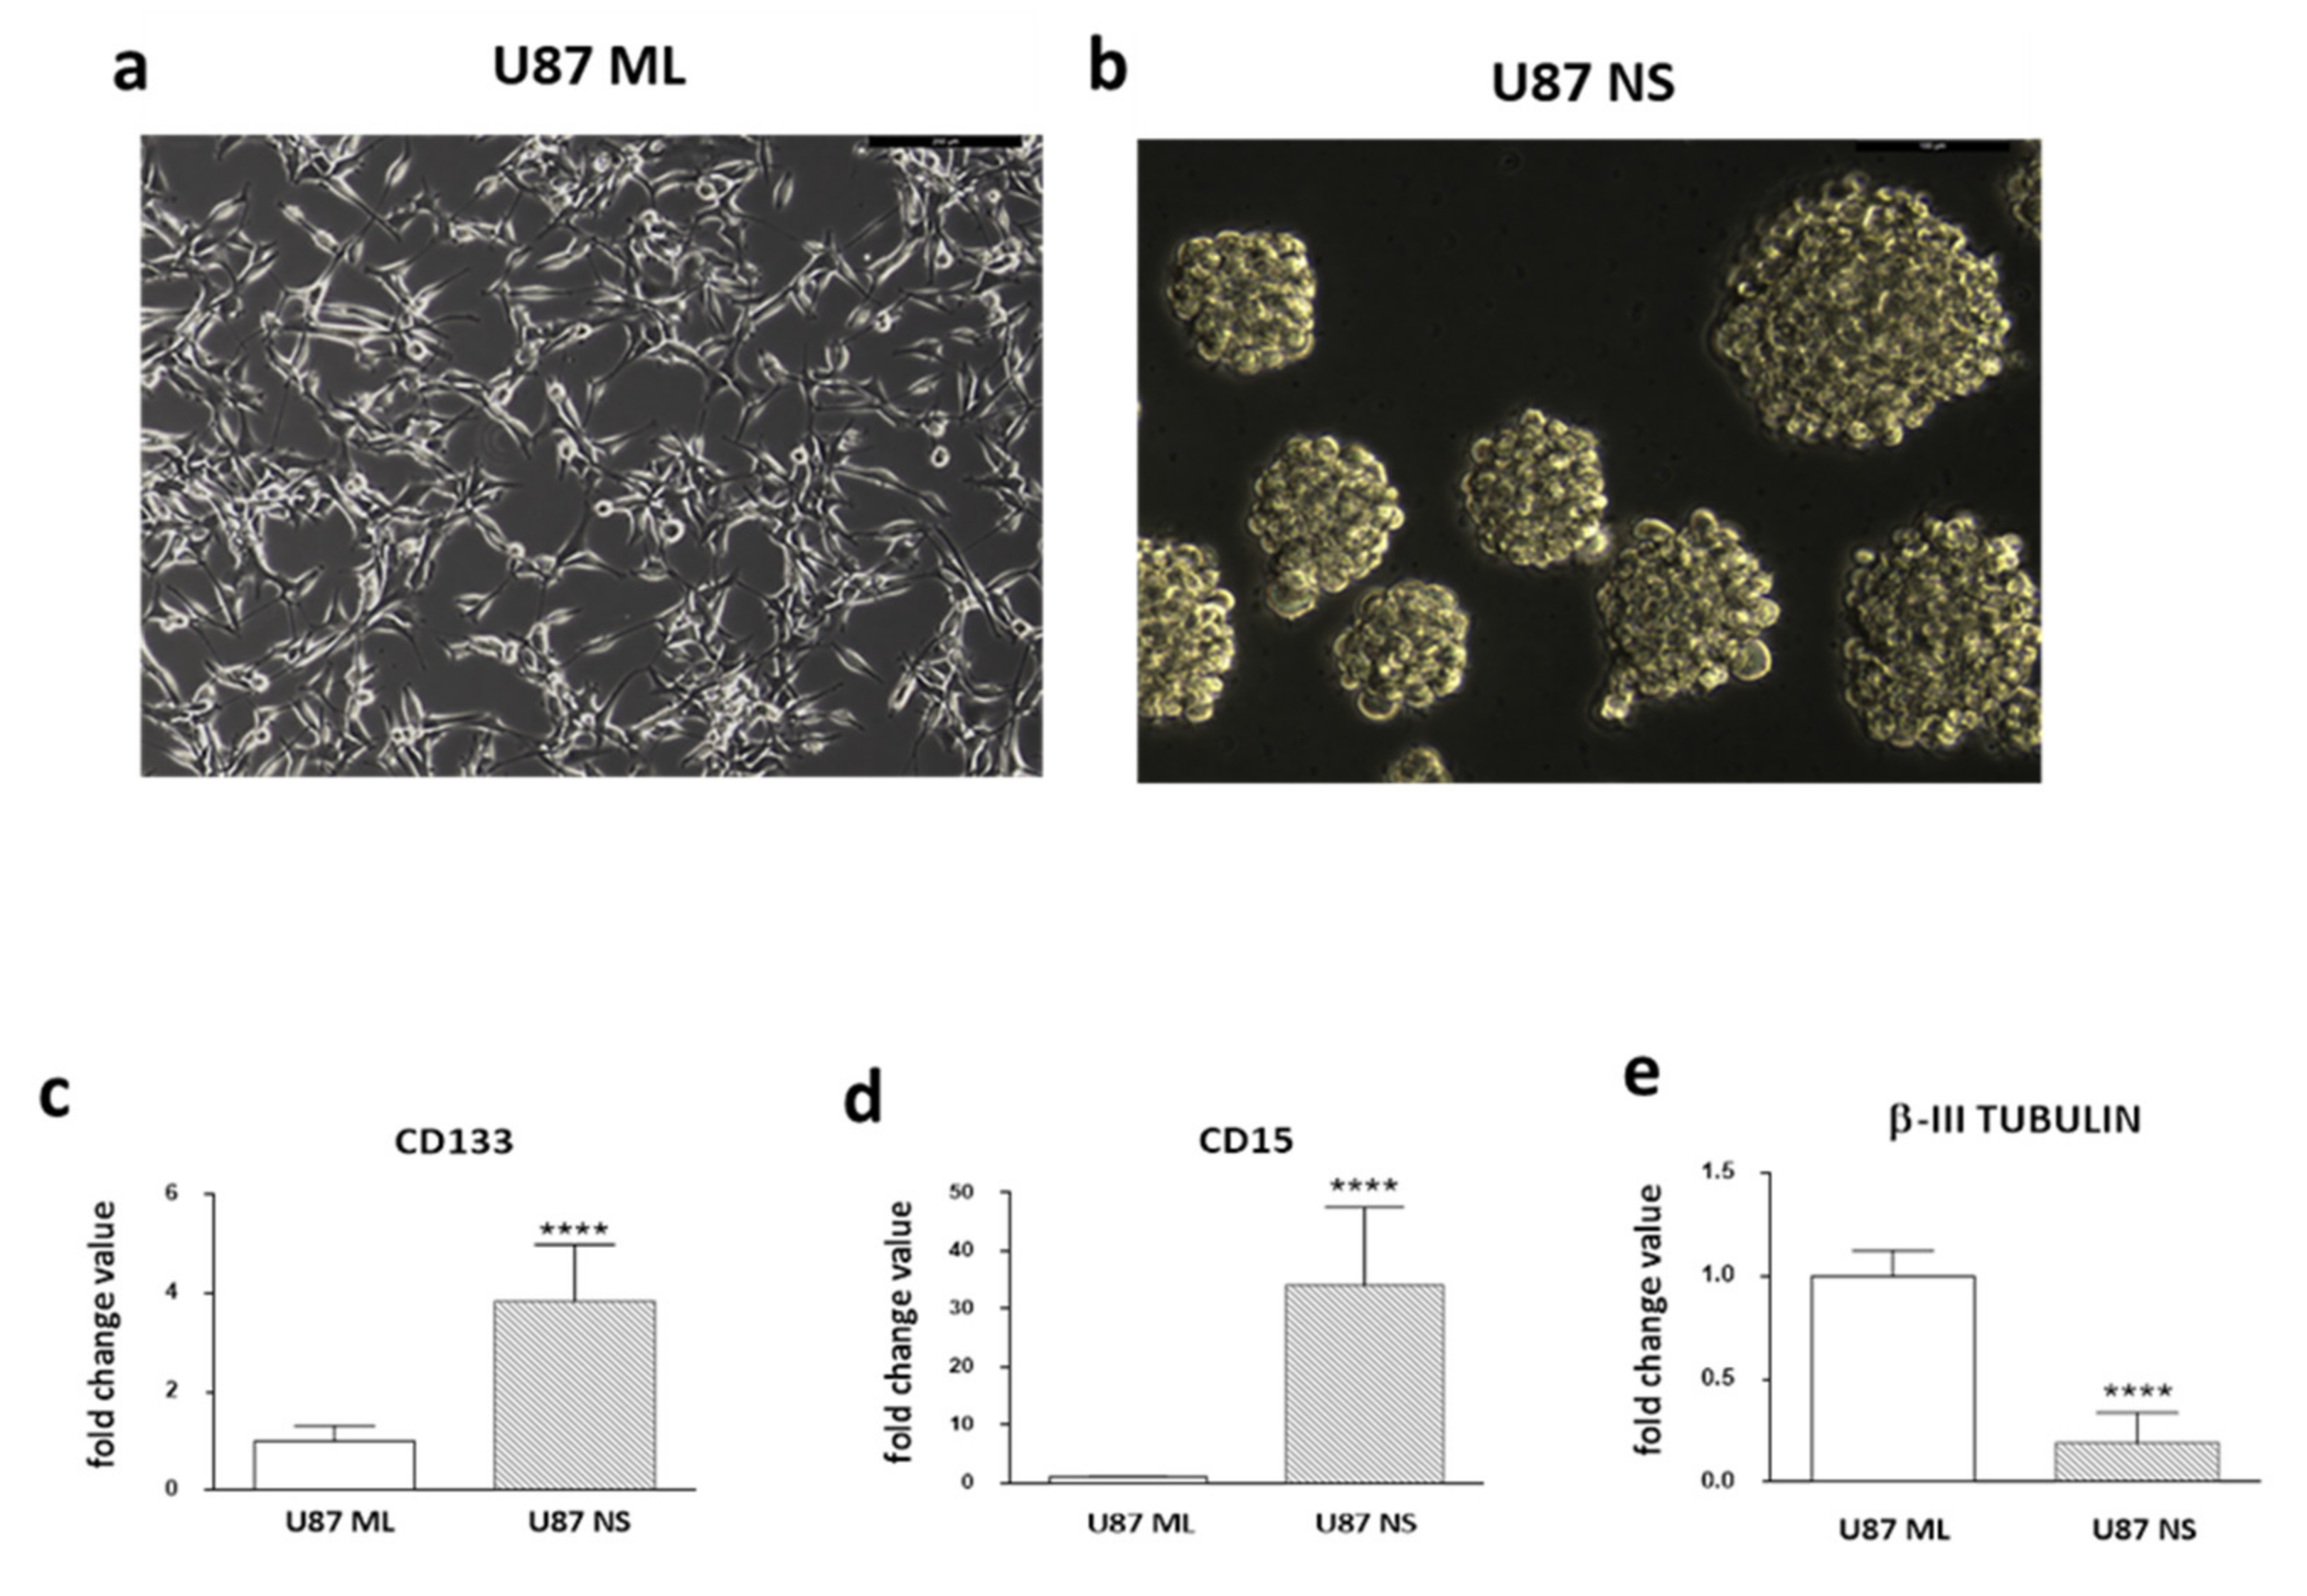
2. Expression Pattern of Stemness/Differentiation Genes in U87 ML and U87 NS Cells

First, researchers explored the potential differences in gene signature by looking at the stemness/differentiation pathways in U87 ML (Figure 1a) and U87 NS (Figure 1b) and evaluating, by qPCR, the expression levels of CD133, CD15 and β-III TUBULIN. They found a significantly higher level of stemness markers in U87 NS cells compared to U87 ML cells. CD133 and CD15 expression levels were 2.8- and 33.1-fold higher in U87 NS versus U87 ML cells, respectively (Figure 1c,d). On the contrary, U87 NS showed a statistically significant lower level of β-III TUBILIN (Figure 1e). These results confirmed the dynamic phenotypic state of GBM cells that can modulate their phenotypic features according to specific cell culture conditions.
Figure 1. Analysis of stemness/differentiation markers in U87 ML and U87 NS. (a) Representative images of U87 cells grown in standard medium as a monolayer. (b) Neurospheres grown for 7 days in a selective medium. (c,d) CD133 and CD15 mRNA expression levels, considered stemness markers, and (e) β-III TUBULIN, a well-known marker of neuron differentiation in U87 ML and NS cells. Data are shown as relative expression compared to U87 ML. p values were determined using a two-tailed t test, **** p < 0.0001.

3. Membrane Permeabilization and ROS Production after PEF-5 Exposure

To verify the efficacy of PEF-5 to induce cell membrane permeabilization in U87 ML and U87 NS, the uptake of the fluorescent Yo-Pro-1 dye was evaluated by flow cytometry. Graphs in Figure 2a show the percentage of permeabilized cells immediately (T = 0 h) and 3 h (T = 3 h) after exposure. Researchers found 91% of permeabilized cells immediately after exposure in U87 ML compared to 28% in U87-NS cells. This permeabilization phenomenon is transient, as at T = 3 h the dye uptake markedly decreased in both culture conditions (Figure 2a). Nonetheless, U87 NS cells, richer in CSCs, were more resistant to permeabilization. Following cell permeabilization, ROS levels were evaluated by DHE uptake at T = 0 h or at T = 3 h after PEF-5 exposure (Figure 2b). In U87 ML cells, a statistically significant ROS increase was observed after electric pulse exposure exclusively 3 h after exposure. On the contrary, in exposed U87 NS cells, ROS levels were significantly higher at T = 0 h, remaining stable at T = 3 h post-exposure. These results highlighted an overproduction of ROS that clearly indicated cellular stress in response to this exposure.
Figure 2. Membrane permeabilization, ROS production, cell survival and cell cycle. (a) Yo-pro-1 uptake at T = 0 h and at T = 3 h after PEF-5 exposure in U87 ML and U87 NS cells. (b) ROS levels after PEF-5 exposure at T = 0 h and T = 3 h. The histogram shows the ratio between the mean fluorescence intensity (MFI) of exposed and sham-exposed cells in both cell culture conditions. (ce) Bar graphs of sham-exposed and exposed U87 ML and NS cells 24 h after PEF-5 exposure for cell death quantification (Trypan blue assay). (df) Cell proliferation evaluated at different time points (0, 24 and 48 h) after PEF-5 exposure in U87 ML and U87 NS. (gj) Cell cycle phases in U87 ML and NS at 24 h after PEF-5 exposure. p values were determined using a two-tailed t test. * p < 0.05; ** p < 0.01; *** p < 0.001; **** p < 0.0001.

4. Survival, Proliferation and Cell Cycle Perturbation

By trypan blue assay, researchers assessed the cell viability in both U87 ML and NS after PEF-5 exposure to verify the level of cell survival following reversible cell permeabilization (Figure 2a,b). As shown in Figure 2c,e, U87 ML and NS cells reported a similar (22% and 24%) statistically significant decrease in cell viability 24 h after exposure to PEF-5, suggesting that PEF-5-mediated cell perturbations (i.e., transient permeabilization and ROS generation) did not induce massive death in GBM cells, regardless of their CSC content. Furthermore, as shown in Figure 2d,f, PEF-5 exposure induced a 2.5- or 4.7-fold lower proliferation rate in U87 ML surviving cells compared to the 1.3- and 2.0-fold decrease observed in U87 NS at 24 and 48 h after exposure, respectively.
In order to more deeply understand the reason for changes in cell proliferation, researchers analyzed the cell cycle (Figure 2g–j). The exposure of U87 ML cells did not induce differences in any phase of the cell cycle compared to the sham-exposed cells (Figure 2g,i). Instead, in the enriched CSC population, U87 NS, the exposure to PEF-5 induced a statistically significant increase of G0/G1 with a significantly high decrease in the G2/M phases (Figure 2h,j). In U87 ML cells, the proliferation reduction may be due to a generalized slowdown of all phases of the cell cycle; on the contrary, in the heterogeneous U87 NS cells, there is an imbalance in the different phases of the cycle and an accumulation of cells in G1.

5. Transcriptomic Profiles of U87 ML and NS Cells and Validation of mRNA Expression

5.1. Affymetrix Gene Chip Analyses

Following the observed PEF-5 effects in terms of ROS generation, survival and cell cycle changes, to more widely screen significantly deregulated genes, the gene profile of both U87 ML and NS was examined by Clarion S Affymetrix Gene Chip analyses, after 24 h from PEF-5 exposure. Genes were considered differentially expressed by Significance Analysis of Microarray (SAM) with FDR < 0.05. Relative heat maps with hierarchical clustering generated by normalization of CEL files, derived from whole transcriptional analysis, are shown in Figure 3a. The comparison between sham-exposed and PEF-5-exposed U87 ML cells allowed the identification of 156 differentially expressed transcription clusters (TCs; 115 upregulated and 41 downregulated TCs). In the same way, analysis of RNA derived from U87 NS cells disclosed 60 TCs as differentially expressed between sham and exposed cells (39 upregulated and 21 downregulated; Figure 3a,b). As shown by the Venn diagram in Figure 3b, fewer genes were modulated in U87 NS compared to ML cells (60 vs. 156 TCs observed in U87 ML). Of note, only a few commonly deregulated genes were identified after PEF-5 exposure. In particular, three upregulated genes, i.e., Hyaluron synthase 2 (HSA2), proline rich protein 2A (SPRR2A) and 2D (SPRR2D), were the same as U87 ML and NS cells (box in Figure 3b). These genes have been described as components of the plasmatic membrane, having a role in membrane integrity, cell survival and inflammatory responses even post radiation and stressful environmental conditions [34][35][36][37].
Figure 3. Transcriptomic analysis. (a) Heat maps displaying differentially expressed genes in U87 ML and NS cells. (b) Venn diagram depicting the number of significantly downregulated and upregulated genes in ML and NS U87 cells, as well as the name of commonly upregulated genes. (c,d) Bar graphs displaying the positive (red) and negative (blue) transcriptional enrichments in MSigDB gene sets of differentially expressed genes between sham-exposed and PEF5-exposed U87 ML and U87 NS cells. (e) Enrichment maps displaying transcriptional enrichments in cellular remodeling and inflammation processes in U87 ML cells and in DNA repair and RNA processing and post-transcriptional modification in U87 NS cells.
In order to identify the potential pathways and intracellular signaling affected by pulse exposure, the gene lists have been analyzed for their enrichment in pathways reported in multiple MSigDB gene sets, including Hallmarks and C2cp (common pathways). In particular, U87 ML cells displayed significant overactivation of multiple hypoxia-dependent targets, with biological processes involved in the response to intracellular oxidation, positive perturbation of P53/cell cycle and alterations of NFkB and TNFα-dependent inflammation signaling (Figure 3c). On the contrary, PEF-5 exposure negatively affected different processes involved in cellular remodeling and in regulation of the mTOR signaling pathway, known to be involved in tumor metabolism [38]. Moreover, U87 ML PEF-5-treated cells showed a clear enrichment of apoptosis and interleukin and cytokine-induced senescence secretory phenotype [39] (Figure 3c,e). Analysis of differentially expressed genes in U87 NS cells displayed a similar modulation of genes involved in hypoxia, intracellular oxidation, inflammation and in P53/cell cycle deregulation (Figure 3d). In particular, interleukin 6 (IL-6) with a significant alteration of NFkB/TNFα-dependent inflammation pathways may suggest a common signature between cell types. Moreover, in U87 NS PEF-5-exposed cells, a significant enriched deregulation of DNA repair processes and the upregulation of gene transcription and RNA processing seems to occur (Figure 3e).

5.2. qPCR Validation of Transcriptome Data for Selected Genes

With the aim of validating the transcriptomic data, researchers evaluated the expression levels of genes involved in the most deregulated pathways 24 h after PEF-5 exposure i.e., cell cycle (Figure 4a,b) and hypoxia-inflammation signaling (Figure 4c,d). In Figure 4a,b, they observed a significant increase of P53 and P21, the damage sensor proteins, in both U87 ML (P53 = +0.2 fold, p = 0.005; P21 = +0.4 fold, p = 0.008) and U87 NS cells (P53 = +0.4 fold, p = 0.003; P21= +0.5 fold p = 0.002), in agreement with the transcriptomic analysis. Due to the involvement of P53 in cell cycle regulation, researchers verified whether PEF-5 exposure altered the levels of different cell cycle components that might have contributed to G1 arrest in U87 NS cells.
Figure 4. Cell cycle checkpoint, hypoxia/inflammation and stemness/differentiation markers. (a,b) Relative mRNA expression levels of genes associated with cell cycle, i.e., P53, P21, CYCLIN D1, GADD45, CDK2 and CDK4. (c,d) Relative mRNA expression levels of genes associated with hypoxia/inflammation processes, i.e., IL6, CCL20, COX2, iNOS and β-CATENIN. (e,f) Relative mRNA expression levels of genes associated with stemness/differentiation processes, i.e., NANOG, OCT4, SOX2, CD133, CD15 and β-III TUBULIN. p values were determined using a two-tailed t test. * p < 0.05; ** p < 0.01; *** p < 0.001.
The expression levels of the two cyclin-dependent kinases, CDK2 and CDK4, were significantly affected in both cell conditions (CDK2 −0.6 fold, p = 0.02 and −0.5 fold, p = 0.05 in U87 ML and NS, respectively; CDK4, −0.6 fold, p = 0.002; −0.6 fold, p = 0.04 in U87 ML and NS, respectively). On the other hand, in U87 ML cells, no significant change was observed in CYCLIN D1 mRNA level (Figure 4a), while it was upregulated in U87 NS cells (+0.6 fold, p = 0.04; Figure 4b). In the same way, researchers observed an inverse behavior in the GADD45 levels, a gene involved in cell cycle progression, downregulated in U87 ML cells (−0.5 fold, p = 0.009) and upregulated in U87 NS (+0.4 fold, p = 0.03; Figure 4a,b). These data demonstrated that PEF-5 exposure induces a complex cell cycle perturbation, possibly enabling a consequent cell-dependent fate alteration. The significant alteration in many genes involved in cell cycle progression (Figure 4b), such as CYCLIN D1 (+0.6 fold, p = 0.04), GADD45a (+0.4 fold, p = 0.03) and CDK4 (−0.6 fold, p = 0.04), may explain the cell accumulation in the G1/G0 phase and the G2/M phase reduction observed in Figure 2j. Indeed, the complex of CYCLIN D1 with P21, concurrently with a selective decrease of both CDK2 and CDK4, appears responsible for the decrease of cell proliferation and cell cycle arrest (Figure 2f,j). To further validate the transcriptomic analysis, hypoxia/inflammation signaling was analyzed by mRNA expression levels of interleukin-6 (IL6) and chemokine (C-C motif) ligand 20 (CCL20), cyclooxygenase (COX)-2 and inducible nitric oxide synthase (iNOS), all downstream genes of NF-KB signaling (Figure 4c,d). Data showed a significant upregulation of IL6 mRNA (+4.0 fold, p = 0.006 and +0.4 fold, p = 0.001 in U87 ML and NS, respectively) and CCL20 (+3.9 fold, p = 0.03 and +0.6 fold, p = 0.0008 in U87 ML and NS, respectively). Furthermore, COX-2 (+9.6 fold, p = 0.0003 in U87 ML) and iNOS (+5.0 fold, p = 0.02 and +0.3 fold, p = 0.03 in U87 ML and NS, respectively) were significantly overexpressed compared to sham-exposed cells in both cell lines. Of note, the alteration of all genes analyzed was modest in U87 NS cells compared to U87 ML cells.
Furthermore, deregulation of β-CATENIN mRNA expression, observed in both U87 ML (−0.5 fold, p = 0.03) and U87 NS cells (+0.4 fold, p = 0.02), together with iNOS upregulation demonstrated the ability of PEF-5 to induce changes in oxygen-sensitive transcriptional regulators, including NF-kB and WNT/β-Catenin [40][41], thus providing support to the evidence of ROS generation after PEF-5 exposure.

5.3. Effects of PEF Exposure on the Stemness/Differentiation Status of GBM Cells

To verify if PEF-5 could affect self-renewal and possibly differentiation processes extremely important in CSCs’ fate, researchers also investigated the gene expression of NANOG, OCT4 and SOX2 24 h after the exposure. In U87 ML cells, researchers found a statistically significant downregulation of SOX2 (−0.24 fold, p = 0.05; Figure 4e). Notably, in U87 NS cells, all genes were upregulated (NANOG= +1.24 fold, p = 0.0048; OCT4 and SOX2= +0.5 fold, p = 0.01; Figure 4f). To evaluate whether PEF-5 could also change the balance between stemness and differentiation in GBM cells, researchers evaluated the expression of stemness (CD133 and CD15) and differentiation (β-III TUBULIN) markers. PEF exposure did not induce perturbation of CD15, CD133 and β-III TUBULIN in U87 ML cells compared to their unexposed counterparts (Figure 4e). Notably, exposure to PEF-5 induced a significant decrease in CD133 (−0.4 fold, p = 0.001) and CD15 (−0.6 fold, p = 0.0003) and a significant increase of β-III TUBULIN (+ 0.2 fold, p = 0.03) in U87 NS cells (Figure 4f), suggesting selective action of PEF exposure toward cells with a more undifferentiated status.

6. Functional testing after PEF-5 exposure

6.1. Clonogenic survival assay and IR combined treatment

To assess possible influence of PEF-5 on GBM clonogenic capacity, the survival clonogenic assay was performed on both first neurospheres derived from U87 ML (U87 NS1) and second generation neurospheres, derived from U87 NS cells (U87 NS2). As shown in Figure 5, exposure to PEF-5 efficiently decreased the clonogenic capacity in both neurosphere generations (about 2-fold lower than sham-exposed cells; p < 0.0001 in U87 ML and p < 0.001 in U87 NS). These results again suggested a strong ability of PEF-5 to modify the stem phenotype of CSCs decreasing their self-renewal capacity (Figure 5a-d). As radiosensitivity increases with cell differentiation status, researchers tested the effectiveness of a combined protocol, irradiating U87 ML and U87 NS cells with increasing IR doses (2, 5, 8 Gy), 3 hours after PEF-5 exposure, as suggested in the previous work. As shown in Figure 5a-d, the combined treatment of PEF-5 and IR was able to reduce clone formation as function of delivered doses, suggesting an additive effect between these two physical agents.

Ijms 23 03001 g005
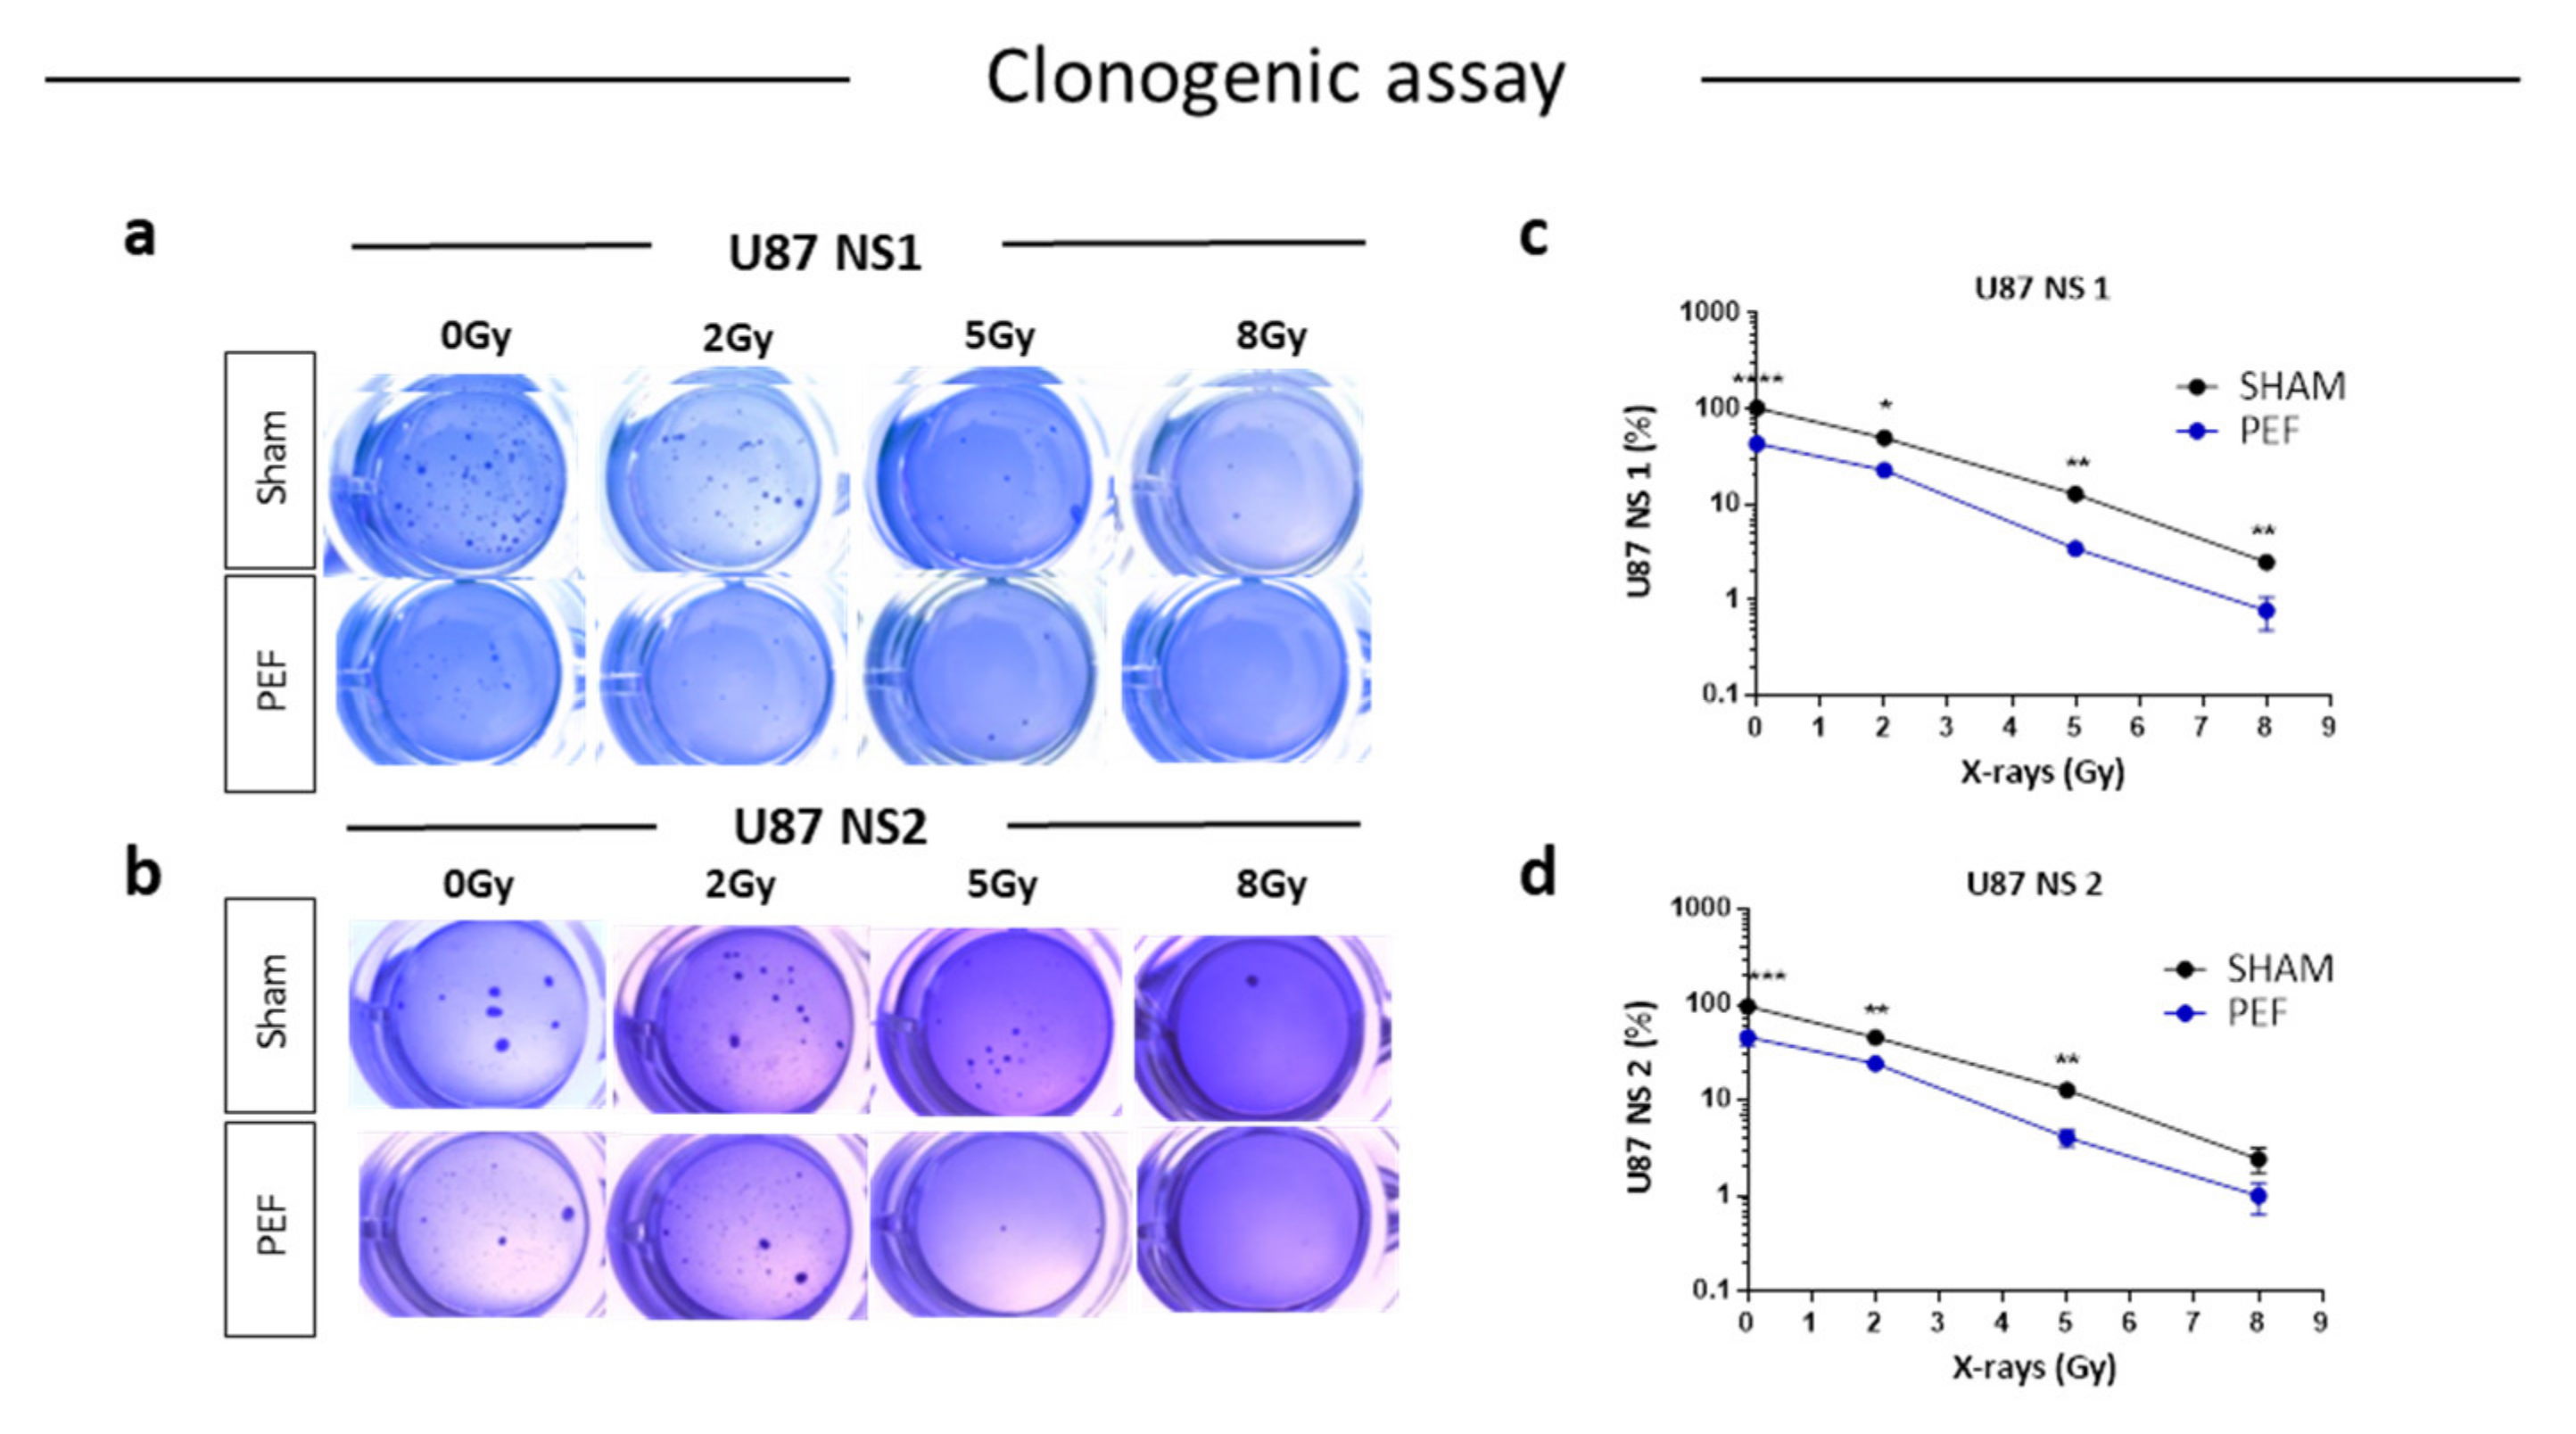
Figure 5. Survival clonogenic assay. (a-b) Representative images of primary and secondary neurospheres after PEF-5 exposure and IR treatments. (c-d) Quantitative analysis revealed a significant decrease in the clonogenic capacity between sham- and PEF-5 exposed cells, regardless of culture conditions. The combined treatment (PEF-5 + IR) reduced clone formation as function of delivered radiation doses.

6.2. Invasion assay after PEF-5 exposure

As invasiveness is another pathophysiological feature of human malignant gliomas, the effects of PEF-5 on the invasiveness and migration of GBM cells were checked in vitro by Transwell Matrigel invasion assay. As shown in Figure 6(a-d), the invasiveness of U87 ML and NS cells exposed to PEF-5 was strongly reduced compared with the control groups. U87 ML PEF-5 exposed cells showed a corresponding decrease of the invasion of 34% and U87 NS cells of 47%. This finding indicates the capacity of PEF-5 alone to inhibit the invasive ability of GBM cells in vitro. Also, for this assay, a combined protocol, PEF-5 + IR, was carried out using increasing IR doses (2, 5, 8 Gy) delivered 3 h after PEF-5 treatment. No further decrease in invasion ability was observed in only irradiated U87 ML samples (Figure 6c), instead, a decrease of 28% (p = 0.006) and of 29% (p = 0.009) was observed in U87 NS cells irradiated with 5 and 8 Gy, respectively (Figure 6d). This result may point out a migration response mediated by the cell types, and the specific delivered radiation dose. After the combined protocol of exposure, no significant changes were observed in migration and invasion abilities of these two cell types compared to those observed in the PEF-5 only treated groups. This result highlights the radio-resistance of GBM cells in both culture conditions. Notably, PEF-5 treatment alone was as effective as the combined treatment with radiations at all the delivered doses in both U87 ML (PEF vs 2Gy, -41% p = 0.04; PEF vs 5Gy, -32% p=0.0096; PEF vs 8Gy, -25% p=0.016), and U87 NS cells (PEF vs 2Gy, -41% p = 0.04).

Ijms 23 03001 g006

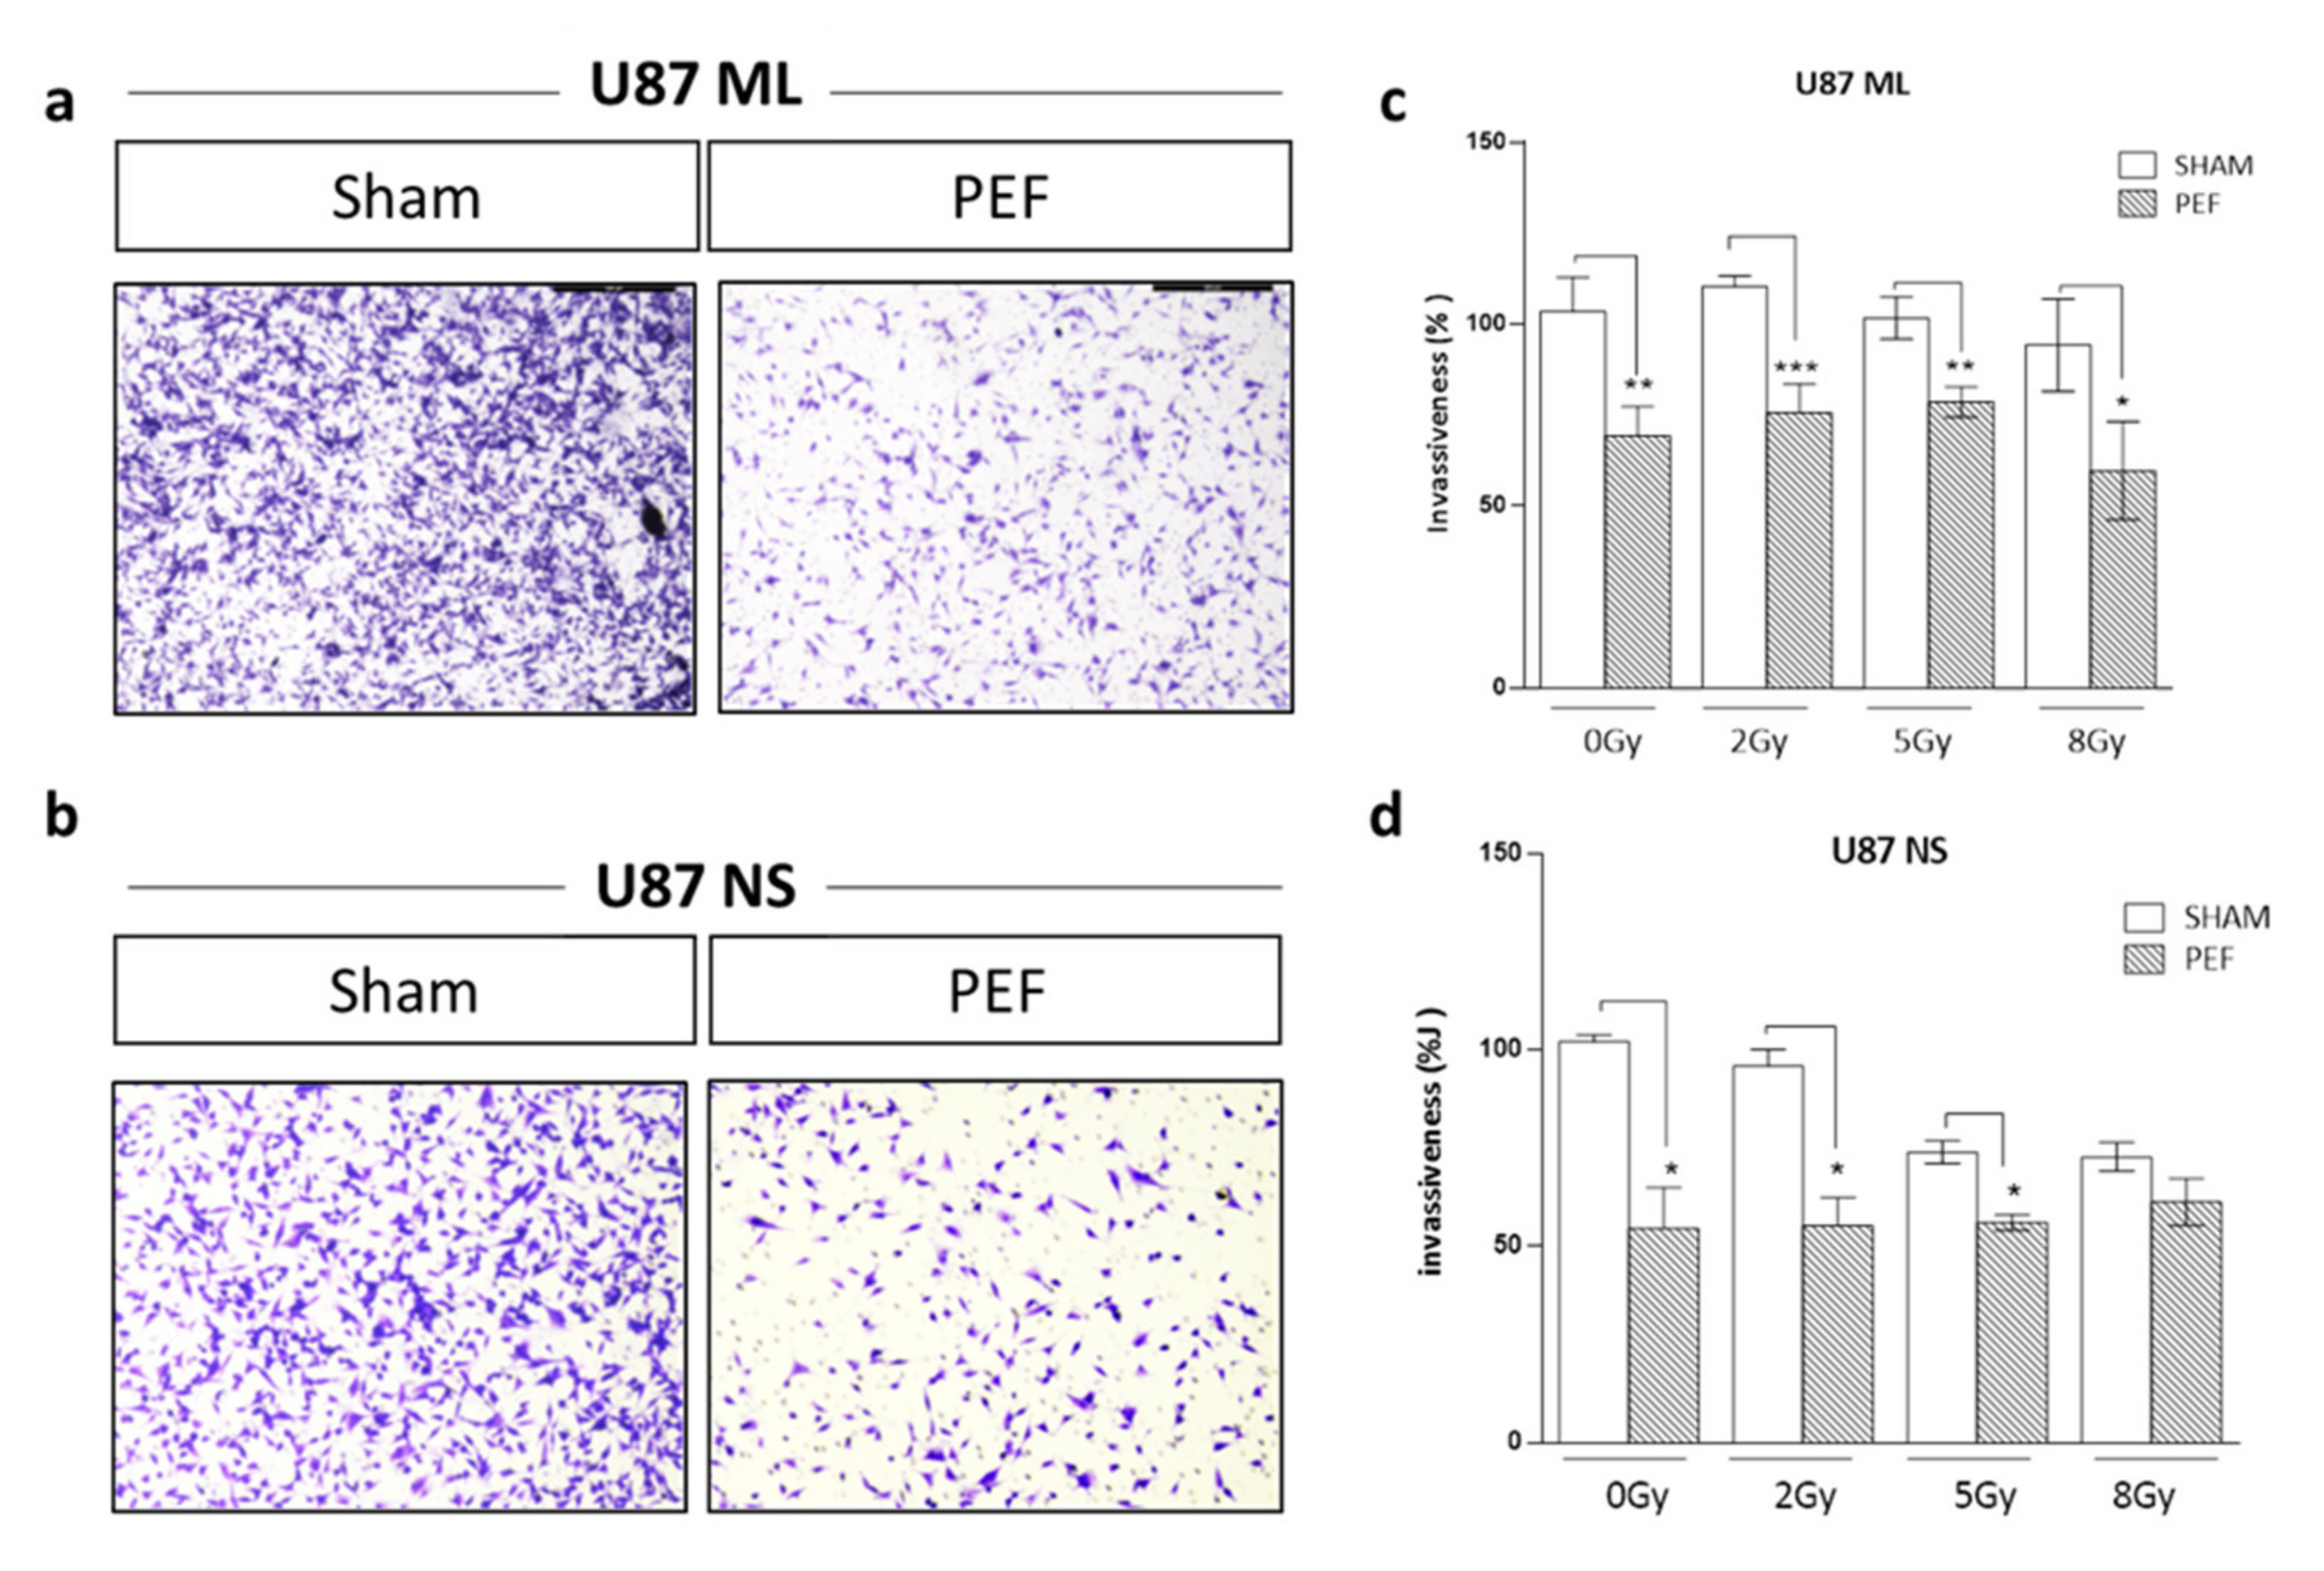
Figure 6. Invasion and migration assay. Representative images of transmigrated cells for (a) U87 ML and (b) U87 NS cells. (c-d) Percentage of invasiveness in U87 ML and NS cells evaluated 24 hours after PEF-5 exposure and IR combined treatment.

References

  1. Thakkar, J.P.; Dolecek, T.A.; Horbinski, C.; Ostrom, Q.; Lightner, D.D.; Barnholtz-Sloan, J.; Villano, J.L. Epidemiologic and Molecular Prognostic Review of Glioblastoma. Cancer Epidemiol. Biomarkers Prev. 2014, 23, 1985–1996.
  2. Bonavia, R.; Inda, M.-d.-M.; Cavenee, W.K.; Furnari, F.B. Heterogeneity Maintenance in Glioblastoma: A Social Network. Cancer Res. 2011, 71, 4055–4060.
  3. Marusyk, A.; Polyak, K. Tumor heterogeneity: Causes and consequences. Biochim. Biophys. Acta 2010, 1805, 105–117.
  4. Meyer, M.; Reimand, J.; Lan, X.; Head, R.; Zhu, X.; Kushida, M.; Bayani, J.; Pressey, J.C.; Lionel, A.C.; Clarke, I.D.; et al. Single cell-derived clonal analysis of human glioblastoma links functional and genomic heterogeneity. Proc. Natl. Acad. Sci. USA 2015, 112, 851–856.
  5. Patel, A.P.; Tirosh, I.; Trombetta, J.J.; Shalek, A.K.; Gillespie, S.M.; Wakimoto, H.; Cahill, D.P.; Nahed, B.V.; Curry, W.T.; Martuza, R.L.; et al. Single-cell RNA-seq highlights intratumoral heterogeneity in primary glioblastoma. Science 2014, 344, 1396–1401.
  6. Snuderl, M.; Fazlollahi, L.; Le, L.P.; Nitta, M.; Zhelyazkova, B.H.; Davidson, C.J.; Akhavanfard, S.; Cahill, D.; Aldape, K.D.; Betensky, R.A.; et al. Mosaic Amplification of Multiple Receptor Tyrosine Kinase Genes in Glioblastoma. Cancer Cell 2011, 20, 810–817.
  7. Sottoriva, A.; Spiteri, I.; Piccirillo, S.G.M.; Touloumis, A.; Collins, V.P.; Marioni, J.C.; Curtis, C.; Watts, C.; Tavaré, S. Intratumor heterogeneity in human glioblastoma reflects cancer evolutionary dynamics. Proc. Natl. Acad. Sci. USA 2013, 110, 4009–4014.
  8. Szerlip, N.J.; Pedraza, A.; Chakravarty, D.; Azim, M.; McGuire, J.; Fang, Y.; Ozawa, T.; Holland, E.C.; Huse, J.T.; Jhanwar, S.; et al. Intratumoral heterogeneity of receptor tyrosine kinases EGFR and PDGFRA amplification in glioblastoma defines subpopulations with distinct growth factor response. Proc. Natl. Acad. Sci. USA 2012, 109, 3041–3046.
  9. Galli, R.; Binda, E.; Orfanelli, U.; Cipelletti, B.; Gritti, A.; De Vitis, S.; Fiocco, R.; Foroni, C.; DiMeco, F.; Vescovi, A. Isolation and Characterization of Tumorigenic, Stem-like Neural Precursors from Human Glioblastoma. Cancer Res. 2004, 64, 7011–7021.
  10. Singh, S.K.; Clarke, I.D.; Terasaki, M.; Bonn, V.E.; Hawkins, C.; Squire, J.; Dirks, P.B. Identification of a cancer stem cell in human brain tumors. Cancer Res. 2003, 63, 5821–5828.
  11. Singh, S.K.; Hawkins, C.; Clarke, I.D.; Squire, J.A.; Bayani, J.; Hide, T.; Henkelman, R.M.; Cusimano, M.D.; Dirks, P.B. Identification of human brain tumour initiating cells. Nature 2004, 432, 396–401.
  12. Ivey, J.W.; Wasson, E.M.; Alinezhadbalalami, N.; Kanitkar, A.; Debinski, W.; Sheng, Z.; Davalos, R.V.; Verbridge, S.S. Characterization of Ablation Thresholds for 3D-Cultured Patient-Derived Glioma Stem Cells in Response to High-Frequency Irreversible Electroporation. Research 2019, 2019, 8081315.
  13. Jordan, C.T.; Guzman, M.L.; Noble, M. Cancer Stem Cells. N. Engl. J. Med. 2006, 355, 1253–1261.
  14. Auffinger, B.; Tobias, A.L.; Han, Y.; Lee, G.; Guo, D.; Dey, M.; Lesniak, M.S.; Ahmed, A.U. Conversion of differentiated cancer cells into cancer stem-like cells in a glioblastoma model after primary chemotherapy. Cell Death Differ. 2014, 21, 1119–1131.
  15. Ayob, A.Z.; Ramasamy, T.S. Cancer stem cells as key drivers of tumour progression. J. Biomed. Sci. 2018, 25, 20.
  16. Flemming, A. Targeting the root of cancer relapse. Nat. Rev. Drug Discov. 2015, 14, 165.
  17. Ostrom, Q.T.; Bauchet, L.; Davis, F.G.; Deltour, I.; Fisher, J.L.; Langer, C.E.; Pekmezci, M.; Schwartzbaum, J.A.; Turner, M.C.; Walsh, K.M.; et al. The epidemiology of glioma in adults: A "state of the science" review. Neuro Oncol. 2014, 16, 896–913.
  18. Reya, T.; Morrison, S.J.; Clarke, M.F.; Weissman, I.L. Stem cells, cancer, and cancer stem cells. Nature 2001, 414, 105–111.
  19. Jolly, M.K.; Celià-Terrassa, T. Dynamics of Phenotypic Heterogeneity Associated with EMT and Stemness during Cancer Progression. J. Clin. Med. 2019, 8, 1542.
  20. Chaffer, C.L.; Brueckmann, I.; Scheel, C.; Kaestli, A.J.; Wiggins, P.A.; Rodrigues, L.O.; Brooks, M.; Reinhardt, F.; Su, Y.; Polyak, K.; et al. Normal and neoplastic nonstem cells can spontaneously convert to a stem-like state. Proc. Natl. Acad. Sci. USA 2011, 108, 7950–7955.
  21. Gupta, P.B.; Fillmore, C.M.; Jiang, G.; Shapira, S.D.; Tao, K.; Kuperwasser, C.; Lander, E.S. Stochastic State Transitions Give Rise to Phenotypic Equilibrium in Populations of Cancer Cells. Cell 2011, 146, 633–644.
  22. Mani, S.A.; Guo, W.; Liao, M.-J.; Eaton, E.N.; Ayyanan, A.; Zhou, A.Y.; Brooks, M.; Reinhard, F.; Zhang, C.C.; Shipitsin, M.; et al. The Epithelial-Mesenchymal Transition Generates Cells with Properties of Stem Cells. Cell 2008, 133, 704–715.
  23. Nieto, M.A.; Huang, R.Y.-J.; Jackson, R.A.; Thiery, J.P. EMT: 2016. Cell 2016, 166, 21–45.
  24. Cornelis, F.H.; Ben Ammar, M.; Nouri-Neuville, M.; Matton, L.; Benderra, M.A.; Gligorov, J.; Fallet, V.; Mir, L.M. Percutaneous Image-Guided Electrochemotherapy of Spine Metastases: Initial Experience. Cardiovasc. Interv. Radiol. 2019, 42, 1806–1809.
  25. Davalos, R.V.; Mir, L.M.; Rubinsky, B. Tissue Ablation with Irreversible Electroporation. Ann. Biomed. Eng. 2005, 33, 223–231.
  26. Gehl, J.; Sersa, G.; Matthiessen, L.W.; Muir, T.; Soden, D.; Occhini, A.; Quaglino, P.; Curatolo, P.; Campana, L.G.; Kunte, C.; et al. Updated standard operating procedures for electrochemotherapy of cutaneous tumours and skin metastases. Acta Oncol. 2018, 57, 874–882.
  27. Sano, M.; Arena, C.B.; Bittleman, K.R.; DeWitt, M.R.; Cho, H.J.; Szot, C.S.; Saur, D.; Cissell, J.M.; Robertson, J.; Lee, Y.W.; et al. Bursts of Bipolar Microsecond Pulses Inhibit Tumor Growth. Sci. Rep. 2015, 5, 14999.
  28. Al-Sakere, B.; André, F.; Bernat, C.; Connault, E.; Opolon, P.; Davalos, R.V.; Rubinsky, B.; Mir, L.M. Tumor Ablation with Irreversible Electroporation. PLoS ONE 2007, 2, e1135.
  29. Kotnik, T.; Rems, L.; Tarek, M.; Miklavčič, D. Membrane Electroporation and Electropermeabilization: Mechanisms and Models. Annu. Rev. Biophys. 2019, 48, 63–91.
  30. Yarmush, M.L.; Golberg, A.; Serša, G.; Kotnik, T.; Miklavčič, D. Electroporation-Based Technologies for Medicine: Principles, Applications, and Challenges. Annu. Rev. Biomed. Eng. 2014, 16, 295–320.
  31. Arena, C.B.; Garcia, P.A.; Sano, M.B.; Olson, J.D.; Rogers-Cotrone, T.; Rossmeisl, J.H.; Davalos, R.V. Focal blood-brain-barrier disruption with high-frequency pulsed electric fields. Technology 2014, 2, 206–213.
  32. Garcia, P.A.; Rossmeisl, J.H.; Robertson, J.L.; Olson, J.D.; Johnson, A.J.; Ellis, T.L.; Davalos, R.V. 7.0-T Magnetic Resonance Imaging Characterization of Acute Blood-Brain-Barrier Disruption Achieved with Intracranial Irreversible Electroporation. PLoS ONE 2012, 7, e50482.
  33. Ringel-Scaia, V.M.; Beitel-White, N.; Lorenzo, M.F.; Brock, R.; Huie, K.E.; Coutermarsh-Ott, S.; Eden, K.; McDaniel, D.; Verbridge, S.S.; Rossmeisl, J.H.; et al. High-frequency irreversible electroporation is an effective tumor ablation strategy that induces immunologic cell death and promotes systemic anti-tumor immunity. EBioMedicine 2019, 44, 112–125.
  34. Tanori, M.; Casciati, A.; Zambotti, A.; Pinto, R.; Gianlorenzi, I.; Pannicelli, A.; Giardullo, P.; Benassi, B.; Marino, C.; Mancuso, M.; et al. Microsecond Pulsed Electric Fields: An Effective Way to Selectively Target and Radiosensitize Medulloblastoma Cancer Stem Cells. Int. J. Radiat. Oncol. 2021, 109, 1495–1507.
  35. Mizuguchi, Y.; Specht, S.; Lunz, J.G.; Isse, K.; Corbitt, N.; Takizawa, T.; Demetris, A.J. SPRR2A enhances p53 deacetylation through HDAC1 and down regulates p21 promoter activity. BMC Mol. Biol. 2012, 13, 20.
  36. Parnigoni, A.; Caon, I.; Moretto, P.; Viola, M.; Karousou, E.; Passi, A.; Vigetti, D. The role of the multifaceted long non-coding RNAs: A nuclear-cytosolic interplay to regulate hyaluronan metabolism. Matrix Biol. Plus 2021, 11, 100060.
  37. Yoo, K.-C.; Suh, Y.; An, Y.; Lee, H.-J.; Jeong, Y.J.; Uddin, N.; Cui, Y.-H.; Roh, T.H.; Shim, J.-K.; Chang, J.H.; et al. Proinvasive extracellular matrix remodeling in tumor microenvironment in response to radiation. Oncogene 2018, 37, 3317–3328.
  38. Zou, M.; Zhu, W.; Wang, L.; Shi, L.; Gao, R.; Ou, Y.; Chen, X.; Wang, Z.; Jiang, A.; Liu, K.; et al. AEG-1/MTDH-activated autophagy enhances human malignant glioma susceptibility to TGF-β1-triggered epithelial-mesenchymal transition. Oncotarget 2016, 7, 13122–13138.
  39. Orjalo, A.V.; Bhaumik, D.; Gengler, B.K.; Scott, G.K.; Campisi, J. Cell surface-bound IL-1α is an upstream regulator of the senescence-associated IL-6/IL-8 cytokine network. Proc. Natl. Acad. Sci. USA 2009, 106, 17031–17036.
  40. Boso, D.; Rampazzo, E.; Zanon, C.; Bresolin, S.; Maule, F.; Porcù, E.; Cani, A.; Della Puppa, A.; Trentin, L.; Basso, G.; et al. HIF-1α/Wnt signaling-dependent control of gene transcription regulates neuronal differentiation of glioblastoma stem cells. Theranostics 2019, 9, 4860–4877.
  41. Fitzpatrick, S.F.; Tambuwala, M.M.; Bruning, U.; Schaible, B.; Scholz, C.C.; Byrne, A.; O’Connor, A.; Gallagher, W.M.; Lenihan, C.R.; Garvey, J.F.; et al. An Intact Canonical NF-κB Pathway Is Required for Inflammatory Gene Expression in Response to Hypoxia. J. Immunol. 2010, 186, 1091–1096.
More
Information
Contributor MDPI registered users' name will be linked to their SciProfiles pages. To register with us, please refer to https://encyclopedia.pub/register :
View Times: 741
Revisions: 3 times (View History)
Update Date: 31 Mar 2022
1000/1000