Your browser does not fully support modern features. Please upgrade for a smoother experience.
Submitted Successfully!
 +1 credit
Thank you for your contribution! You can also upload a video entry or images related to this topic.
For video creation, please contact our Academic Video Service.
| Version | Summary | Created by | Modification | Content Size | Created at | Operation |
|---|---|---|---|---|---|---|
| 1 | Anja Bräuer | + 3650 word(s) | 3650 | 2022-02-24 08:50:54 | | | |
| 2 | Rita Xu | Meta information modification | 3650 | 2022-03-04 02:55:28 | | | | |
| 3 | Rita Xu | + 301 word(s) | 3951 | 2022-03-04 03:00:35 | | | | |
| 4 | Rita Xu | Meta information modification | 3951 | 2022-03-04 03:03:34 | | |
Video Upload Options
We provide professional Academic Video Service to translate complex research into visually appealing presentations. Would you like to try it?
Cite
If you have any further questions, please contact Encyclopedia Editorial Office.
Bräuer, A. Aβ-Induced Alterations in Membrane Lipids. Encyclopedia. Available online: https://encyclopedia.pub/entry/20160 (accessed on 27 July 2026).
Bräuer A. Aβ-Induced Alterations in Membrane Lipids. Encyclopedia. Available at: https://encyclopedia.pub/entry/20160. Accessed July 27, 2026.
Bräuer, Anja. "Aβ-Induced Alterations in Membrane Lipids" Encyclopedia, https://encyclopedia.pub/entry/20160 (accessed July 27, 2026).
Bräuer, A. (2022, March 03). Aβ-Induced Alterations in Membrane Lipids. In Encyclopedia. https://encyclopedia.pub/entry/20160
Bräuer, Anja. "Aβ-Induced Alterations in Membrane Lipids." Encyclopedia. Web. 03 March, 2022.
Copy Citation
Loss of active synapses and alterations in membrane lipids are crucial events in physiological aging as well as in neurodegenerative disorders. Both are related to the abnormal aggregation of amyloid-beta (Aβ) species, generally known as amyloidosis.
neurones
glia cells
synapses
Aβ species
membrane lipids
1. Introduction
Amyloidosis is used as an umbrella term for rare, serious diseases caused by the deposit of misfolded proteins. In brain tissue, it is characterised by the accumulation of amyloid-beta (Aβ), such as occurs in Alzheimer’s disease (AD) [1]. Aβ species are products of a proteolytic cleavage, generated from amyloid precursor protein (APP) by α- or β-secretase and γ-secretase activity, and their characteristics have been extensively reviewed [1][2][3]. However, the presumed neurotoxic effects of the major Aβ species, Aβ(1–40) and Aβ(1–42), under pathological and physiological conditions remain unclear. So far, the molecular and cellular mechanism of Aβ species and their impact on the loss of synaptic sites, as well as on the changes of membrane lipids of brain cells, is poorly understood.
APP has been shown to play a pivotal role in synaptic and neural plasticity [4]. In vitro and in vivo studies have demonstrated that soluble Aβ species accumulate at the synaptic sites, resulting in disrupted synaptic plasticity and long-term potential [5][6][7][8]. However, Aβ(1–42) is thought to be more aggregation-prone compared to Aβ(1–40). The aggregation status of Aβ species in senile plaques in AD is strongly regulated by time and their aggregation affinity [9][10]. Therefore, as has been demonstrated in vitro and in vivo, Aβ species have different influences on the pre- and postsynaptic densities dependent on the Aβ concentrations, the chemical structure of Aβ (α-helices or β-sheets), the time of Aβ treatment, and the Aβ aggregation status [2][11][12][13][14][15][16][17][18][19][20][21]. Previously, it was also shown that glial cells are involved in Aβ-induced inflammatory responses and play an important role in Aβ clearance and degradation [22]. In addition, glial activation itself could play a protective role against Aβ-induced toxicity on neurones [22].
APP and the cleavage products Aβ(1–40) and Aβ(1–42) have different influences on lipid homeostasis [23]. Major molecular targets for Aβ in the cholesterol and sphingolipid metabolic pathways are 3-Hydroxy-3-methylglutaryl-coenzyme A (HMG-CoA) reductase and sphingomyelinases (nSMase) [23]. Aβ(1–42) activates nSMase, whereas Aβ(1–40) suppresses the activity of HMG-CoA reductase, resulting in decreased cholesterol levels. Sphingomyelins (SM) reduce γ-secretase activity, thus reducing Aβ levels; cholesterol, on the contrary, induces γ-secretase activity and is responsible for elevated Aβ levels [23][24]. Inhibition of HMG-CoA reductase is responsible for a reduction of intracellular as well as extracellular Aβ(1–40) and Aβ(1–42) peptides, resulting in elevated levels of cholesterol [25]. Sphingosine-1-phosphate (So1P) has been shown to be protective for neuronal cells, whereas ceramide promotes Aβ biogenesis by influencing the β-secretase of APP [26]. Ceramides also interfere in the control of many cellular processes, influencing, e.g., Aβ aggregation in physiological and pathological aging processes [27]. Phosphatidylcholines can alter the Aβ(1–40) mediated aggregation, depending on the thickness of the lipid membrane [28]. Charged phospholipid bilayers consisting of phosphatidylcholines and phosphoglycerol showed an increase in Aβ(1–40) fibril formation [29].
2. Synaptic Loss after Aβ(1–40) and Aβ(1–42) Treatment
To examine whether Aβ species have a preferential early or late effect on the loss of active synapses, primary hippocampal neurones at 12 DIV were treated with (1 µM) Aβ(1–40) or (1 µM) Aβ(1–42) for 3 h and 12 h. Active synapses were analysed by colocalisation of fluorescent markers recognizing vesicular glutamate transport 1 (Vglut-1) and postsynaptic density protein-95 (PSD-95) (Figure 1A–C). Researchers quantified three ROI (47 µm2) on the dendritic tree of the hippocampal neurones by examining the colocalisation dots (Figure 1A, white boxes) of a pre- and postsynaptic marker. No significant effect on active synapses was observed after 3 h treatment between their control groups (CTRL and DMSO) compared to Aβ-treated groups (Aβ(1–40) and Aβ(1–42)). After 12 h, however, Aβ-treated groups showed a significant reduction in active synapses as compared to the control groups (Figure 1A and Table 1). Both 3 h and 12 h DMSO treatments showed a small decrease in active synapses compared to the CTRL, but this was not significant (Figure 1B,C and Table 1). Researchers observed no significant difference after 3 h and 12 h treatment between Aβ(1–40) and Aβ(1–42) treatments (Figure 1B,C and Table 1). However, 3 h Aβ(1–40) and Aβ(1–42) treatment showed a slight decrease in active synapse numbers as compared to their control groups, but this was not significant (Figure 1B,C and Table 1).
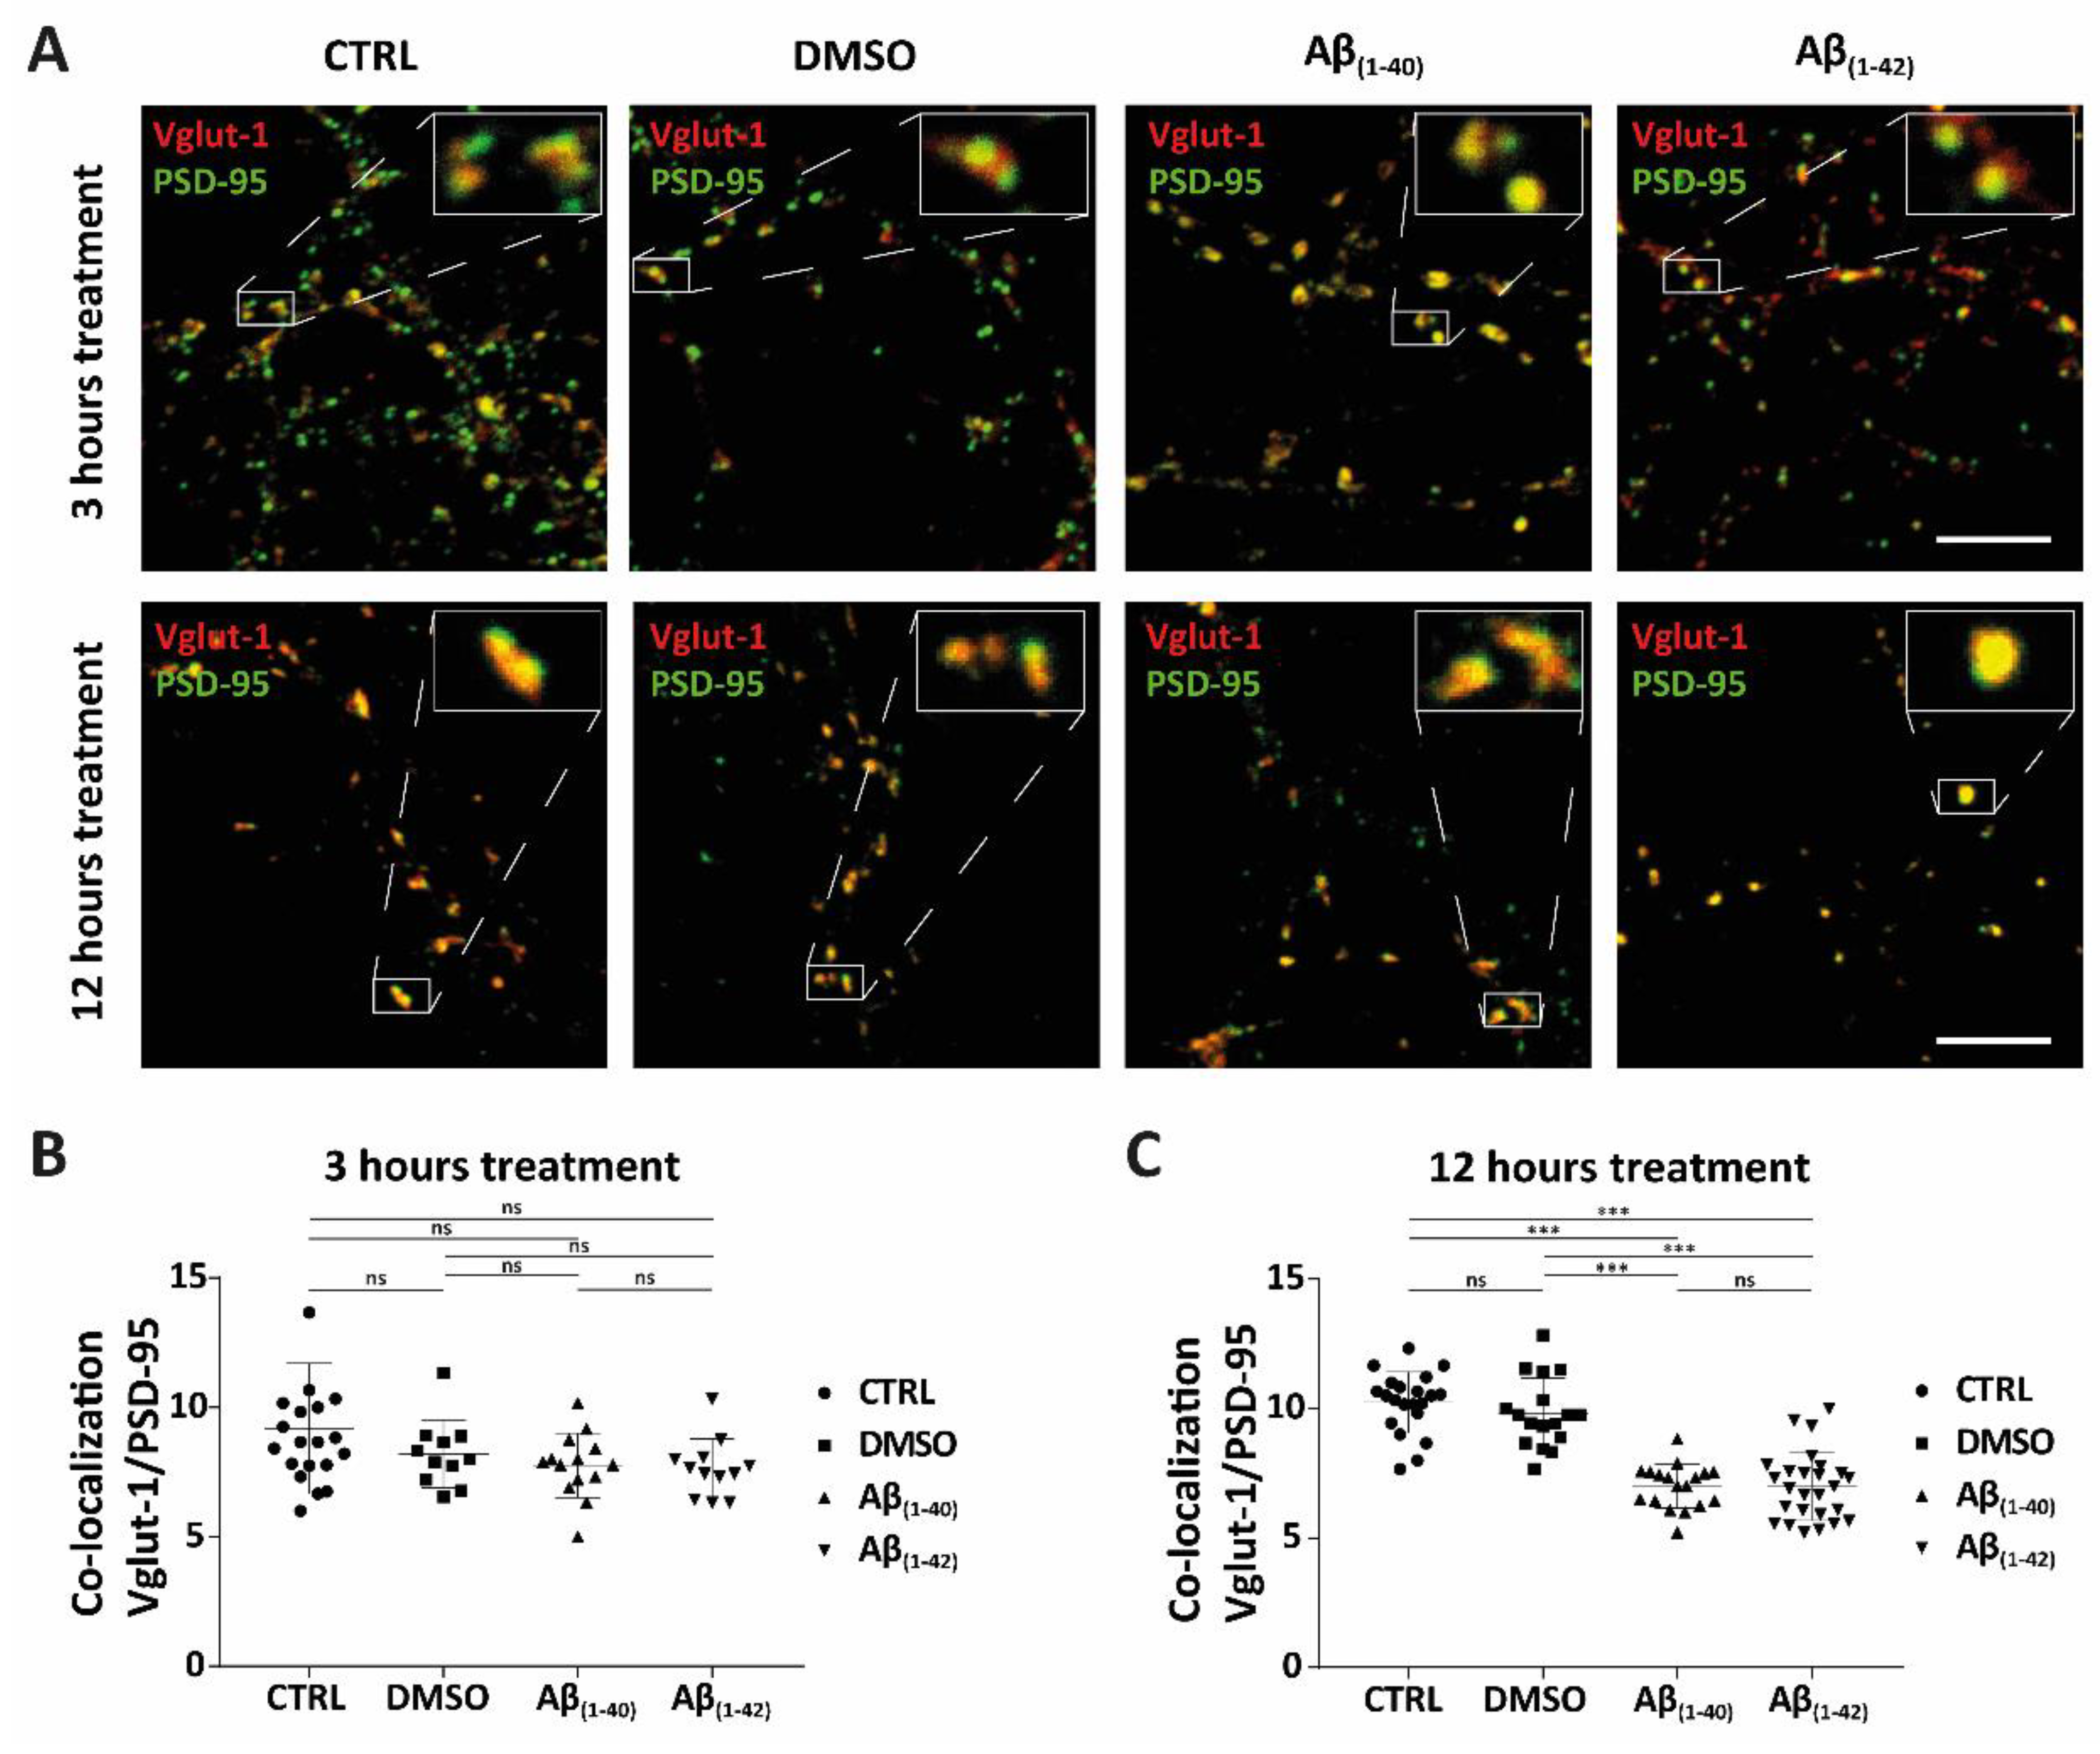
Figure 1. Synaptic loss of active synapses of Aβ accumulation in hippocampal neurones. (A–C) The synaptic study showed the colocalisation of presynaptic (Vglut-1) and postsynaptic (PSD-95) markers, which was defined as active synapses, in hippocampal neurones at DIV12 for both control groups (CTRL and DMSO) and Aβ-treated groups ((1 µM) Aβ(1–40) and (1 µM) Aβ(1–42)) at different time points (3 h and 12 h) of treatment (all groups from four independent cultures (n = 4)). In the 3 h treatment, the following average number of neurones was counted in each group: CTRL (n = 12), DMSO (n = 9), Aβ(1–40) (n = 11) and Aβ(1–42) (n = 9). In the 12 h treatment, the following average number of neurones was counted in each group: CTRL (n = 14), DMSO (n = 13), Aβ(1–40) (n = 13), and Aβ(1–42) (n = 17). For both 3 h and 12 h treatments, 3 ROI from each neurone was counted. (A) Representative confocal images of control groups and Aβ-treated groups of hippocampal neurones stained for both presynaptic (Vglut-1) and postsynaptic markers (PSD-95) are shown. There was a reduction in active synapses after 12 h of Aβ(1–40)- and Aβ(1–42)-treated neurones compared to control groups. White boxes show enlargements of an example of defined active synapses for both control groups and Aβ-treated groups (3 h and 12 h). (B,C) Quantification of active synapses from control- and Aβ-treated groups of hippocampal neurones. (B) No significant effect on active synapses was seen in Aβ-treated groups after 3 h (3 ROI of average counted cells; n = 10, from four independent cultures (n = 4)). (C) A significant reduction of active synapses was observed after 12 h of Aβ(1–40)- and Aβ(1–42)-treated neurones compared to control groups. No significance (ns) was seen between CTRL and DMSO, nor between Aβ(1–40)- and Aβ(1–42)-treated neurones (3 ROI of average counted cells; n = 14, from four independent cultures (n = 4)). *** p < 0.0001; scale bars represent 5 µm. The size of the ROI was 47 µm2.
Table 1. List of the statistically adjusted p-value (from Figure 1B,C) between separate groups (CTRL, DMSO, Aβ(1–40) and Aβ(1–42)) after 3 h and 12 h of treatment conditions. A Kruskal–Wallis test was performed, followed by a Dunn’s multiple comparison test.
| 3 h Treatment | 12 h Treatment | |
|---|---|---|
| Kruskal–Wallis test | 0.0732 | <0.0001 |
| Dunn’s multiple comparison test | adjusted p-value | adjusted p-value |
| CTRL vs. DMSO | >0.9999 | 0.6106 |
| CTRL vs. Aβ(1–40) | 0.3017 | <0.0001 |
| CTRL vs. Aβ(1–42) | 0.0867 | <0.0001 |
| DMSO vs. Aβ(1–40) | >0.9999 | <0.0001 |
| DMSO vs. Aβ(1–42) | >0.9999 | <0.0001 |
| Aβ(1–40) vs. Aβ(1–42) | >0.9999 | >0.9999 |
3. Alterations in Cellular Lipids of Hippocampal Neurones and Glial Cells after Aβ(1–40) and Aβ(1–42) Treatment
3.1. Disruption in Cellular Lipids of Hippocampal Neurones and Glial Cells after Aβ(1–40) and Aβ(1–42) Treatment Using High-Performance Thin-Layer Chromatography (HPTLC)
Hippocampal neurones at 12 DIV and glial cells were treated with Aβ(1–40) and Aβ(1–42) for 3 h and 12 h to test whether Aβ species influence cellular lipids, whether that has a preference for a specific class of lipids, and to examine whether Aβ(1–40) and Aβ(1–42) have early effects on the lipid changes in these cells. Two different sets of analyses were performed: HPTLC and tandem MS. Lipids of hippocampal neurones and glial cells were extracted equally from their control groups (CTRL and DMSO) and Aβ-treated groups (Aβ(1–40) and Aβ(1–42)) after 3 h and 12 h of treatment. TopFluor lysophosphatidic acid (LPA) was used as the internal standard, to see whether the same amounts of lipids were extracted from each sample of control- and Aβ-treated groups. To analyse which different lipid classes (e.g., sphingolipids and glycerophospholipids) were dysregulated, researchers showed HPTLC-derivatised copper (II)-sulphate images and their corresponding scanning profiles for hippocampal neurones and glial cells treated with Aβ(1–40) and Aβ(1–42) for 3 h and 12 h. These images and profiles revealed changes in different lipid classes (e.g., sphingolipids and glycerophospholipids), which were in accordance with the external standards used. Each numbered purple arrow and box refers to external standards that could be detected from hippocampal neurones and glial cells after 3 h and 12 h of Aβ(1–40) and Aβ(1–42) treatment. The copper (II)-sulphate scanning profiles are shown to facilitate examination of the changes between control groups and Aβ-treated groups. The represented retention factor and arbitrary unit are both based on the peak’s end in the copper (II)-sulphate scanning profiles. These show the changes in band intensity of the HPTLC copper (II)-sulphate images and correspond to the numbered labelled purple arrows and boxes.
3.2. Specific Identification of Various Lipid Isoforms after Aβ(1–40) and Aβ(1–42) Treatment from Hippocampal Neurones and Glial Cells Using Tandem Mass Spectrometry Analysis
To corroborate whether Aβ(1–40) and Aβ(1–42) preferentially influence specific sphingolipid or glycerophospholipids isoforms, researchers treated hippocampal neurones at DIV 12 and glial cells for 3 h and 12 h with Aβ(1–40) and Aβ(1–42) and subsequently analysed them by tandem MS. Here, the characterisation of altered lipid isoforms for hippocampal neurones and glial cells after 3 h and 12 h Aβ(1–40) and Aβ(1–42) treatment are shown, focussing on sphingolipids such as ceramides (Cer), dihydroceramides (DHCer), lactosylceramides (LacCer), monohexosylceramides (HexCer), sphingosine (So), sphinganine (Sa), sphingosine-1-phosphate (Sa1P), sphinganine-1-phosphate (So1P), sphingosylphosphorylcholine (SPC), sphingomylines (SM), dihydrosphingomylines (DHSM), and glycerophospholipids such as phosphatidylcholine (PC), lyso-phosphatidylcholine (LPC), lyso-phosphatidylethanolamine (LPE), lyso-phosphatidylglycerol (LPG), lyso-phosphatidylserine (LPS), Lyso-platelet-activating factor (Lyso-PAF) (Figure 2, Figure 3 and Figure 4). All results are presented as a log10 transformation and were performed in triplicate. Furthermore, ratios between the Aβ-treated groups and their negative control (DMSO) were calculated, setting the negative control (DMSO) to 0. After taking the ratios, the Z-score was taken for the total data set. Changes in lipid isoforms are shown as tendencies. This means that the red colours refer to an increase of lipid quantities and the green colour indicates a reduction compared to their negative control (DMSO) which was set to 0 as baseline parameter (Figure 2, Figure 3 and Figure 4).
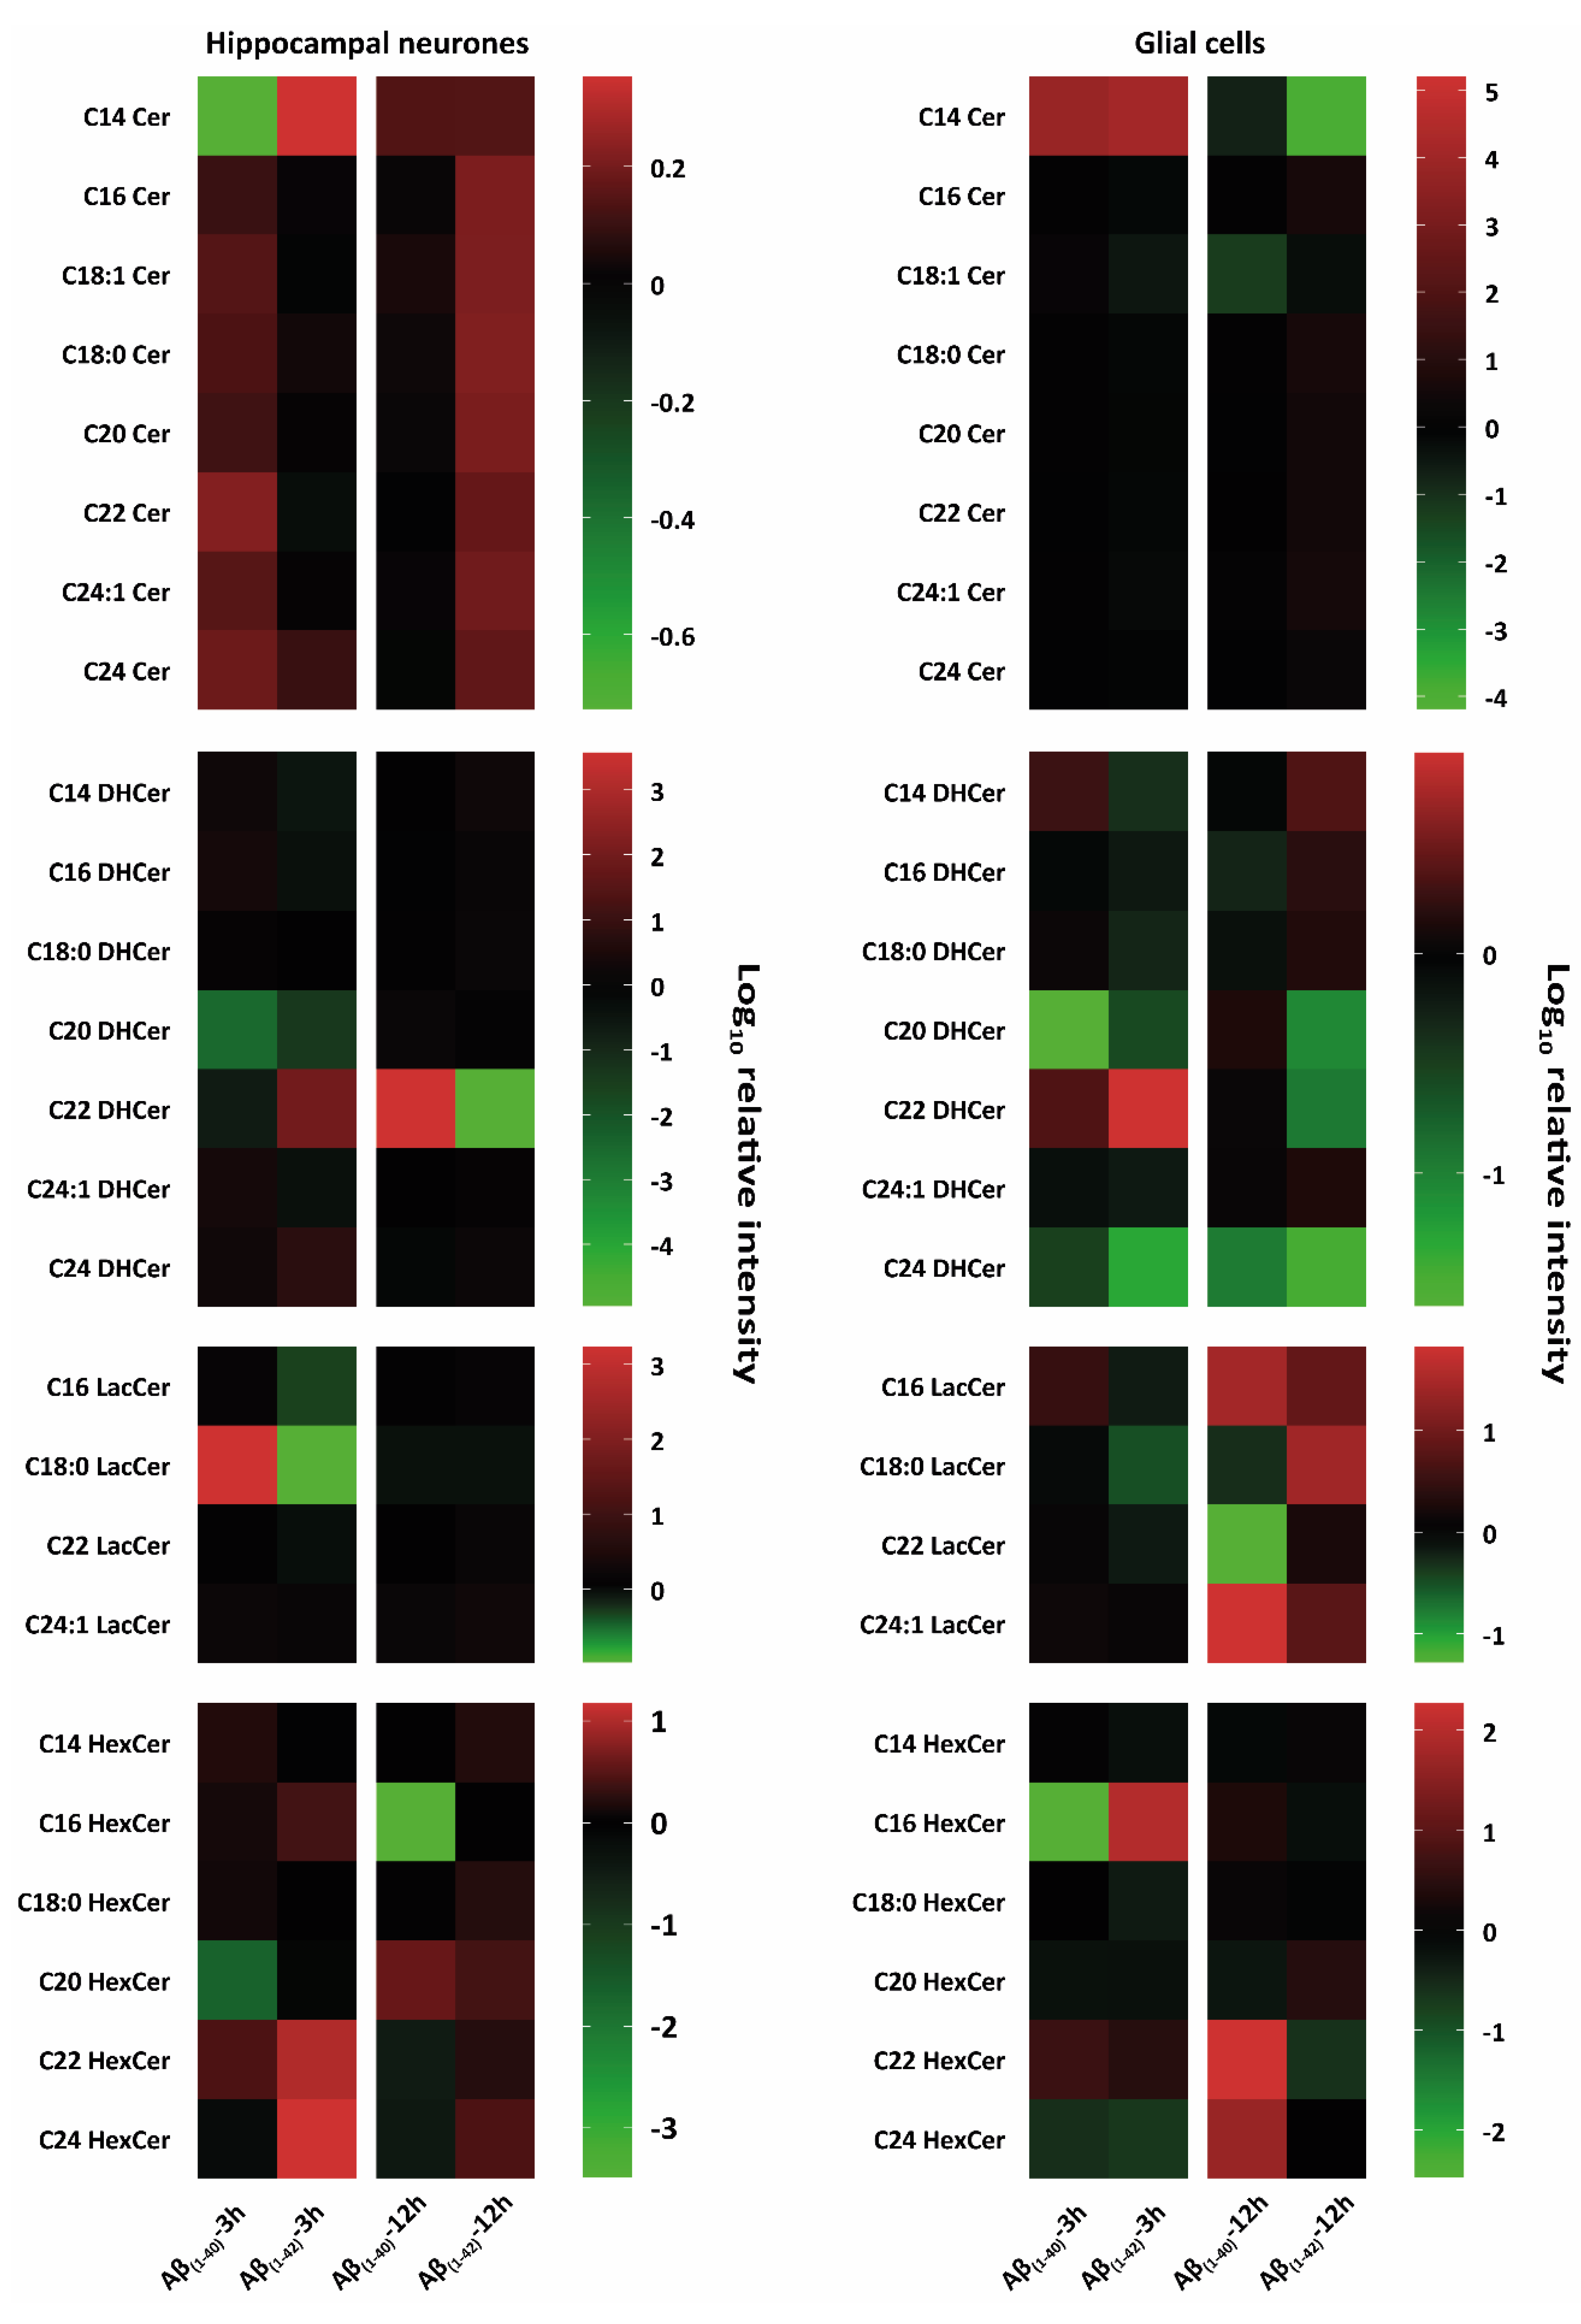
Figure 2. Heat-map-based mass spectrometry analysis of sphingolipid classes from hippocampal neurones and glial cells after 3 h and 12 h Aβ treatment. Here, researchers examined different sphingolipid isoforms: ceramides (Cer), dihydroceramides (DHCer), lactosylceramides (LacCer), and monohexosylceramides (HexCer) after 3 h and 12 h treatment with (1 µM) Aβ(1–40) and (1 µM) Aβ(1–42) of hippocampal neurons at DIV 12 and glial cells (all groups, from three independent experiments (n = 3)). Changes of these lipid classes are shown as logarithmic (log10) relative intensity (arbitrary unit); the green colour refers to a reduction, and the red colour refers to an increase of lipid levels compared to their negative control (DMSO), which was set to 0 as baseline. Both hippocampal neurones and glial cells showed an increased and reduced intensity of Cer, DHCer, LacCer, and HexCer isoforms after both 3 h and 12 h Aβ(1–40) and Aβ(1–42) treatment. Different changes in the lipid classes are shown between treated hippocampal neurones and glial cells. Aβ-treated hippocampal neurones showed prominent increases and decreases in Cer isoforms and LacCer and HexCer isoforms after 3 h and 12 h of Aβ(1–40) and Aβ(1–42) treatment. There was both a prominent intensity increase and a decrease of DHCer isoforms after 3 h and 12 h of Aβ(1–40) and Aβ(1–42) treatment. Glial cells showed prominent lipid changes of Cer, DHCer, LacCer, and HexCer isoforms after 3 h and 12 h of Aβ(1–40) or Aβ(1–42) treatment.
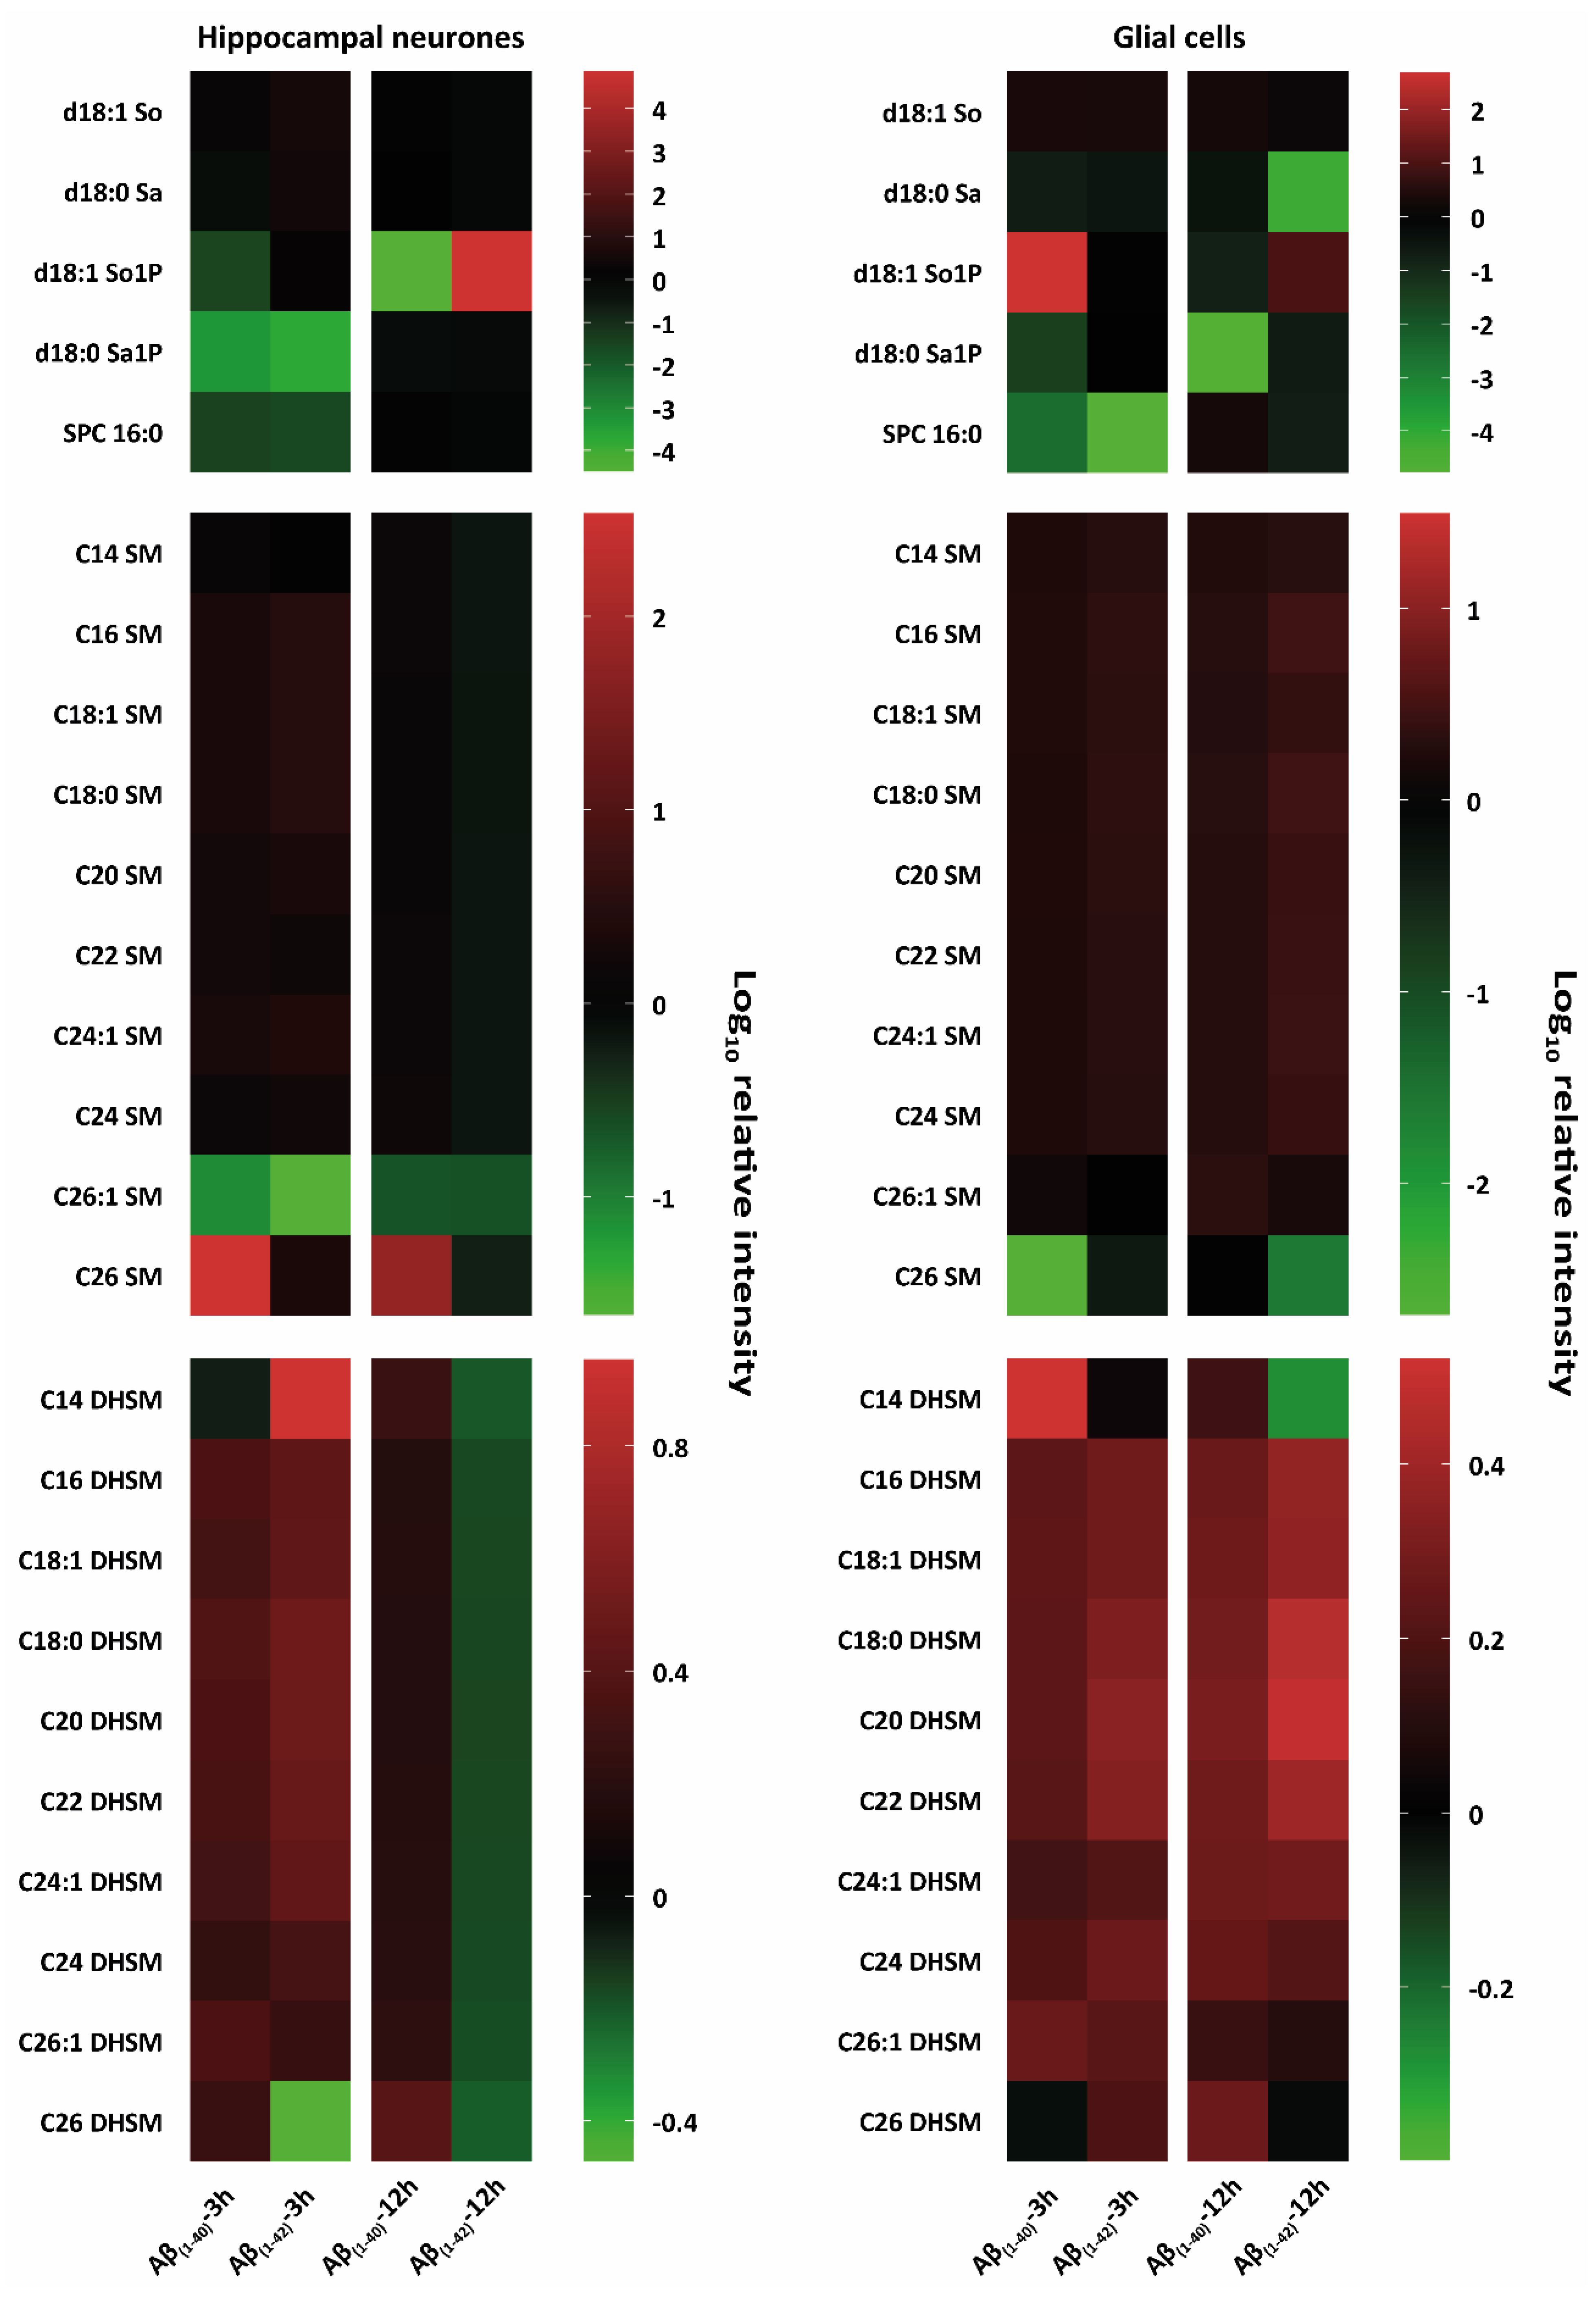
Figure 3. Heat-map-based mass spectrometry analysis of sphingophospholipid classes from hippocampal neurones and glial cells after 3 h and 12 h Aβ treatment. Here, researchers examined different sphingophospholipid isoforms; sphingosine (d18:1 So), sphinganine (d18:0 Sa), sphingosine-1-phosphate (d18:1 So1P), sphinganine-1-phosphate (d18:1 Sa1P), sphingomyelines (SM) and dihydrosphingomyelines (DHSM) after 3 h and 12 h treatment with (1 µM) Aβ(1–40) and (1 µM) Aβ(1–42) hippocampal neurones at DIV 12 and glial cells (all groups, from three independent experiments (n = 3)). Changes of these lipid classes are shown as logarithmic (log10) relative intensity (arbitrary unit); the green colour refers to a reduction and the red colour refers to an increase in lipid levels compared to their negative control (DMSO), which was set to 0 as baseline. Major intensity changes in lipid classes of d18:1 So, d18:0 Sa, d18:1 So1P, d18:1 Sa1P after 3 h and 12 h Aβ(1–40) and Aβ(1–42) treatment of hippocampal neurones and glial cells were observed. Specific lipid intensity changes after Aβ(1–40) and Aβ(1–42) treatment of hippocampal neurones of very long fatty acid SM compared to Aβ-treated glial cells were detected.
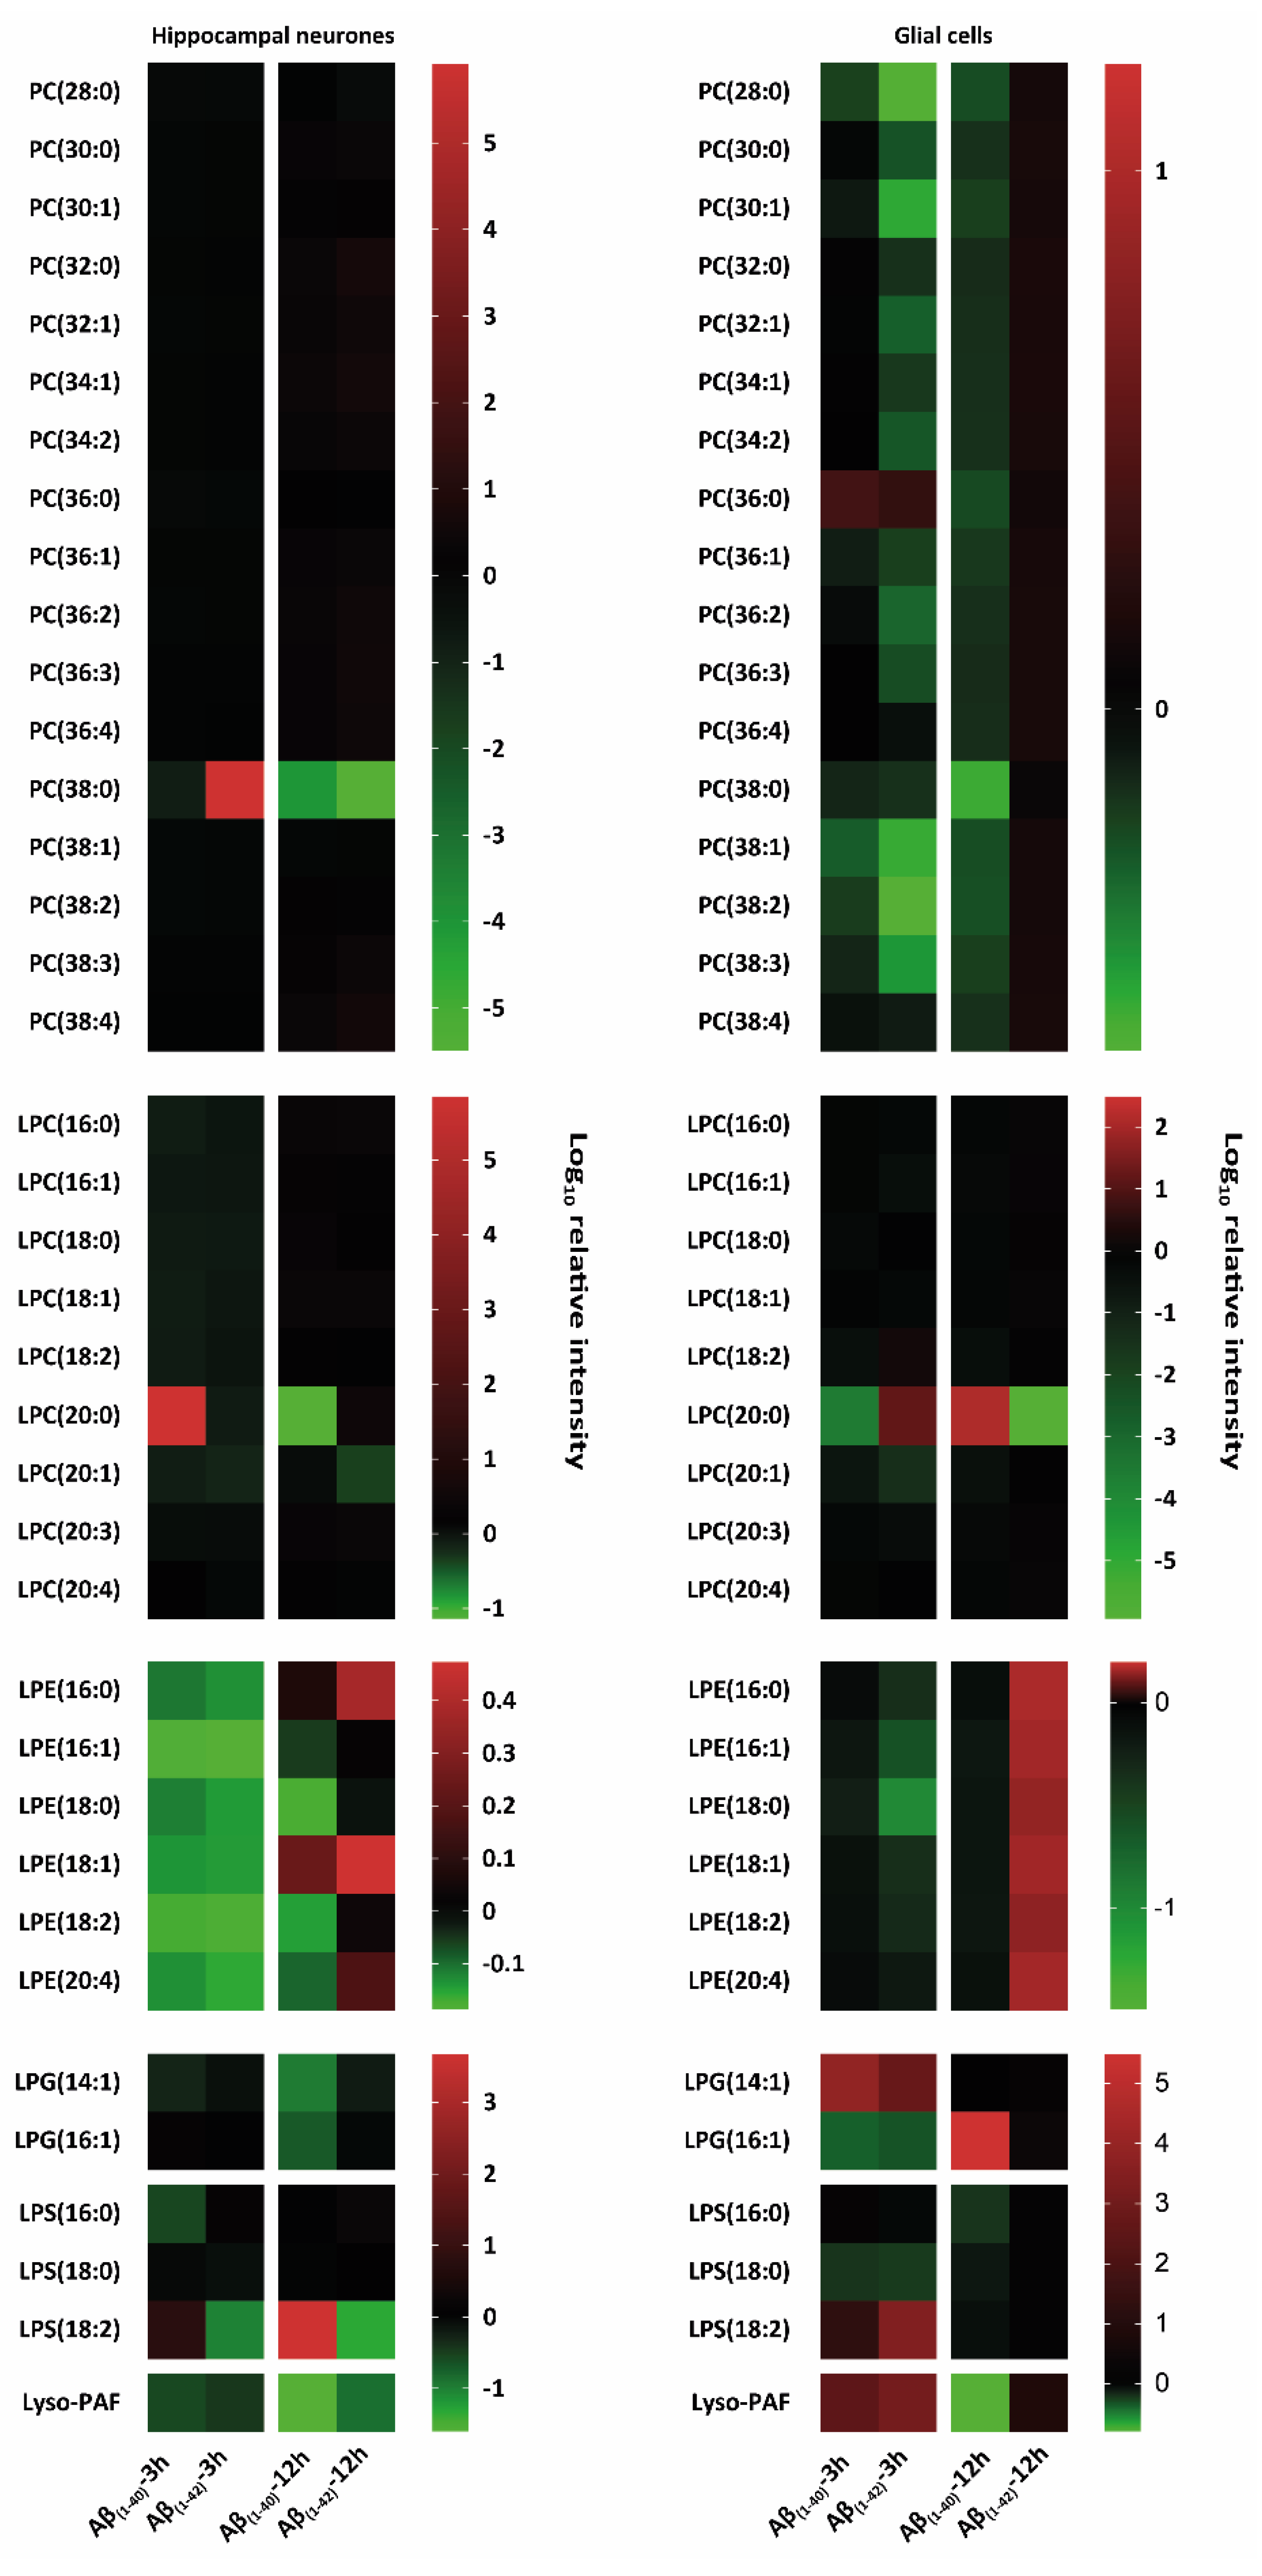
Figure 4. Heat map-based mass spectrometry analysis of glycerophospholipid classes from hippocampal neurones and glial cells after 3 h and 12 h Aβ treatment. Here, researchers examined different glycerophospholipids isoforms: phosphatidylcholine (PC), lyso-phosphatidylcholine (LPC), lyso-phosphatidylethanolamine (LPE), lyso-phosphatidylglycerol (LPG), lyso-phosphatidylserine (LPS), and lyso-platelet-activating factor (Lyso-PAF) after 3 h and 12 h treatment with (1 µM) Aβ(1–40) and (1 µM) Aβ(1–42) of hippocampal neurones at DIV 12 and glial cells (all groups, from three independent experiments (n = 3)). Changes in these lipid classes are shown as logarithmic (log10) relative intensity (arbitrary unit); the green colour refers to a reduction and the red colour refers to an increase in lipid levels compared to their negative control (DMSO), which was set to 0 as baseline. Hippocampal neurones specifically showed PC (38:0) intensity changes after 3 h and 12 h Aβ(1–40) and Aβ(1–42) treatment compared to an overall reduction in PC for Aβ(1–40) and Aβ(1–42)-treated glial cells. LPC, LPG, LPS, and Lyso-PAF showed specific changes after 3 h and 12 h Aβ(1–40) and Aβ(1–42) treatment in both hippocampal neurones and glial cells.
Ceramides (Cer)
Both hippocampal neurones and glial cells showed alterations in Cer isoforms after 3 h and 12 h Aβ(1–40) and Aβ(1–42) treatment (Figure 2). Neurones showed a reduction in C14 Cer after 3 h Aβ(1–40) treatment. An increase of C14 Cer was observed after 3 h and 12 h of Aβ(1–40) and Aβ(1–42) treatment. Other ceramide isoforms (C16 Cer, C18:0 Cer, C20 Cer, C22 Cer, C24:1 Cer) showed an increase in 3 h Aβ(1–40)-and 12 h Aβ(1–42)-treated neurons. Aβ-treated glial cells showed a strong increase after 3 h Aβ(1–40) and Aβ(1–42) treatment for C14 Cer. After 12 h, Aβ(1–42)-treated glial cells showed a strong reduction compared to Aβ(1–40) for C14 Cer. A weak reduction in C18:1 Cer for 3 h Aβ(1–42) and 12 h Aβ(1–40) (Figure 2) was also observed. Other ceramide isoforms (C16 Cer, C18:0 Cer, C20 Cer, C22 Cer, C24:1 Cer) showed a weak increase after 12 h Aβ(1–42)-treatment on glial cells. An increase was observed in C24 Cer after 3 h Aβ(1–40) as well as after 3 h and 12 h Aβ(1–42) in treated neurones. No changes were observed in C24 Cer of Aβ(1–40)- and Aβ(1–42)-treated glial cells (Figure 2).
Dihydroceramides (DHCer)
In Aβ(1–42)-treated glial cells, C14 DHCer, C16 DHCer and C18:0 DHCer decreased after 3 h and increased after 12 h treatment. However, in glial cells C14 DHCer and C18:0 DHCer was increased after 3 h of Aβ(1–40) treatment. After 3 h Aβ(1–40)- and Aβ(1–42)-treatment on glial cells, a reduction in C20 DHCer and an increase in C22 DHCer was observed. After 12 h there was a decrease in Aβ(1–40)- and an slight increase in Aβ(1–42)-treated glial cells. C24:1 DHCer showed a weak reduction after 3 h Aβ(1–40) and Aβ(1–42) treatment as well as an increase after 12 h Aβ(1–42) treatment in glial cells. After 3 h and 12 h Aβ treatment, glial cells showed a decrease in C24 DHCer (Figure 2). Aβ(1–40)- and Aβ(1–42)-treated hippocampal neurones showed a specific decrease in C20 DHCer after 3 h, and no changes after 12 h Aβ(1–40) and Aβ(1–42) treatment. C22 DHCer showed a decrease in 3 h Aβ(1–40)- and 12 h Aβ(1–42)-treated hippocampal neurones. An increase in C22 DHCer was seen in 3 h Aβ(1–42)- and 12 h Aβ(1–40)-treated hippocampal neurones (Figure 2). Other Dihydroceramides isoforms (C14 DHCer, C16 DHCer, C24:1 DHCer, C24 DHCer) showed a weak increase in 3 h Aβ(1–40)-treated neurons. However, 3 h Aβ(1–42) treatment showed a reduction in C14 DHCer, C16 DHCer, C24:1 DHCer, and increase in C24 DHCer (Figure 2).
Lactosylceramides (LacCer)
Glial cells treated with Aβ(1–40) and Aβ(1–42) showed a reduction in all LacCer isoforms after 12 h. In 3 h Aβ(1–42)-and 12 h Aβ(1–40)-treated glial cells, decreases in C18:0 LacCer and C22 LacCer and an increase after 12 h Aβ(1–42) treatment were seen. In C16 LacCer and C24:1 LacCer an increase after 12 h Aβ(1–40) and Aβ(1–42) treatment on glial cells was seen. A reduction was observed in C16 LacCer after 3 h Aβ(1–40) and a decrease after 3 h Aβ(1–42) treatment on glial cells. After 3 h, Aβ(1–40)-treated hippocampal neurones showed an increase in C18:0 LacCer. A decrease in C16 LacCer and C18 LacCer was seen in 3 h Aβ(1–42)-treated hippocampal neurons (Figure 2). A slight decrease was observed in C18:0 LacCer after 12 h Aβ(1–40) and Aβ(1–42)-treatment on neurones as well as in C22 LacCer after 3 h Aβ(1–42) treatment.
Monohexosylceramides (HexCer)
After Aβ(1–40) treatment, C16 HexCer showed a strong reduction in 12 h-treated hippocampal neurones and in 3 h-treated glial cells, whereas 3 h Aβ(1–42)-treated glial cells and 3 h Aβ(1–40)- and Aβ(1–42)-treated hippocampal neurones showed an increase (Figure 2). C22 HexCer and C24 HexCer showed strong increases after 12 h Aβ(1–40) and decreases in 12 h Aβ(1–42) for glial cells and a slight reduction in 12 h Aβ(1–40)- and a strong increase in 12 h Aβ(1–42)-treated hippocampal neurones. After 3 h of Aβ(1–40)- and Aβ(1–42)-treated hippocampal neurons and glial cells, a strong increase was seen in C22 HexCer. C24 HexCer showed an increase in 3 h Aβ(1–40)- and Aβ(1–42)-treated glial cells as well as in 3 h Aβ(1–42)-treated hippocampal neurons. Slight increases were observed in C14 HexCer, C18:0 HexCer, and C20 HexCer after 3 h Aβ(1–40) treatment on hippocampal neurones. However, C14 HexCer showed an weak increase after 3 h Aβ(1–40) and 12 h Aβ(1–42) treatment on hippocampal neurones. A slight reduction was seen in C14 DHCer after 3 h Aβ(1–42) and 12 h Aβ(1–40) treatment on glial cells. C18:0 HexCer showed an increase after 3 h Aβ(1–40) and 12 h Aβ(1–42) on hippocampal neurones. A slight decrease in C18:0 HexCer was observed after 3 h Aβ(1–42) treatment (Figure 2).
Sphingosine (So) and Sphingosine-1-Phosphate (So1P)
Hippocampal neurones and glial cells showed weak changes of d18:1 So after both 3 h and 12 h Aβ(1–40) and Aβ(1–42) treatments (Figure 3). There was a decrease in d18:1 So1P after 3 h Aβ(1–42) treatment in hippocampal neurones and an increase after 12 h Aβ(1–42) treatment in glial cells. A reduction in d18:1 So1P was also observed after 3 h and 12 h Aβ(1–40) treatment of hippocampal neurons (Figure 3). An increase in d18:1 So1P for both 3 h Aβ(1–40)-treated glial cells and 12 h Aβ(1–42)-treated hippocampal neurones was observed (Figure 3).
Sphinganine (Sa) and Sphinganine-1-Phosphate (Sa1P)
A prominent reduction was seen in d18:0 Sa for glial cells after 3 h and 12 h Aβ(1–40) and Aβ(1–42) treatment (Figure 3). In hippocampal neurones d18:0 Sa was slightly increased after 3 h Aβ(1–40) treatment and slightly reduced after 12 h Aβ(1–42) treatment. A reduction was also observed in d18:0 Sa1 P after 3 h Aβ(1–40)- and Aβ(1–42)-treated hippocampal neurones, as well as 3 h and 12 h Aβ(1–40)-treated glial cells. No strong reduction was observed in d18:0 Sa1P after 12 h Aβ(1–40) and Aβ(1–42) treatment of hippocampal neurones as well as in 3 h Aβ(1–42)-treated glial cells (Figure 3).
Sphingosylphosphorylcholine (SPC)
Both, hippocampal neurones and glial cells showed alterations in SPC 16:0 after 3 h Aβ(1–40) and Aβ(1–42) treatment. The most prominent decrease in SPC 16:0 was shown after 3 h of Aβ(1–40) and Aβ(1–42) treatment for both hippocampal neurones and glial cells. A decrease was also observed after 12 h of Aβ(1–42) treatment for both hippocampal neurones and glial cells (Figure 3).
Sphingomyelines (SM)
All SM isoforms (C14 SM, C16 SM, C18:1 SM, C18:0 SM, C20 SM, C22 SM, C24:1 SM, C24 SM, C26:1 SM, and C26 SM) showed a slight increase after 3 h Aβ(1–40) and Aβ(1–42) treatment on hippocampal neurones, and glial cells after 3 h and 12 h Aβ(1–40) and Aβ(1–42) treatment (Figure 3). The most prominent reductions were observed in C26 SM for glial cells after 3 h Aβ(1–40) and 12 h Aβ(1–42) treatment and in C26:1 SM for hippocampal neurones after 3 h and 12 h Aβ(1–40) and Aβ(1–42) treatment. 3 h and 12 h Aβ(1–40)-treated hippocampal neurones showed a strong increase in C26 SM (Figure 3).
Dihydrosphingomyelines (DHSM)
Almost all DHSM isoforms (C14 DHSM, C16 DHSM, C18:1 DHSM, C18:0 DHSM, C20 DHSM, C22 DHSM, C24:1 DHSM, C24 DHSM, C26:1 DHSM and C26 DHSM) showed an increase after 3 h Aβ(1–40) and Aβ(1–42) and 12 h Aβ(1–40) treatment, as well as a decrease after 12 h Aβ(1–42) treatment of hippocampal neurones. The most prominent reduction in DHSM for hippocampal neurones was observed after 3 h in C14 DHSM after Aβ(1–40) treatment and C26 DHSM after Aβ(1–42) treatment, and for all DHSM isoforms after 12 h Aβ(1–42) treatment (Figure 3). However, the most prominent increase in DHSM for hippocampal neurones was observed after 3 h in C14 DHSM after Aβ(1–42) treatment and C26 DHSM after Aβ(1–40) treatment, and for all DHSM isoforms after 12 h Aβ(1–40) treatment (Figure 3). Almost all DHSM isoforms (C14 DHSM, C16 DHSM, C18:1 DHSM, C18:0 DHSM, C20 DHSM, C22 DHSM, C24:1 DHSM, C24 DHSM, C26:1 DHSM, and C26 DHSM) from glial cells treated with Aβ were increased, whereas in glial cells, the most prominent increase are observed after 3 h Aβ(1–40) treatment for C14 DHSM and after 12 h Aβ(1–42) treatment for C18:0 DHSM, C20 DHSM, and C22 DHSM. Additionally, glial cells showed a prominent decrease in C14 DHSM after 12 h Aβ(1–42) (Figure 3).
Phosphatidylcholines (PC) and Lyso-Phosphatidylcholines (LPC)
A prominent decrease in PC (38:0) in hippocampal neurones after 3 h Aβ(1–40) as well as 12 h Aβ(1–40) and Aβ(1–42) was observed, as well as an strong increase after 3 h Aβ(1–42) treatment. All other PC isoforms (PC (28:0), PC (30:0), PC (30:1), PC (32:0), PC (32:1), PC (34:1), PC (34:2), PC (36:1), PC (36:2), PC (36:2), PC (36:3), PC (38:0), PC (38:1), PC (38:2), PC (38:3), PC (38:4)) showed a decrease in 3 h Aβ(1–40)- and 12 h Aβ(1–40)-treated glial cells. Beside PC (28:0), a weak increase was observed after 12 h Aβ(1–42) treatment in glial cells. The following PC isoforms (PC (28:0), PC (30:1), PC (32:0), PC (32:1), PC (34:1), PC (36:1), PC (38:0), PC (38:1), PC (38:2), PC (38:3)) were reduced after 3 h Aβ(1–40) treatment of glial cells. Glial cells also showed a prominent increase in PC (36:0) after 3 h Aβ(1–40) and Aβ(1–42) treatment. No changes were observed in PC (38:0) after 12 h Aβ(1–42) treatment of glial cells. LPC (20:0) showed a strong increase after 3 h Aβ(1–40) treatment of hippocampal neurones and in 3 h Aβ(1–42)- and 12 h Aβ(1–40)-treated glial cells (Figure 4). A prominent decrease was observed in LPC (20:0) in 3 h Aβ(1–40) and 12 h Aβ(1–42) treated glial cells and a weak decrease in 12 h Aβ(1–40)-treated hippocampal neurones (Figure 4).
Lyso-Phosphatidylethanolamine (LPE)
A reduction in all LPE isoforms (LPE (16:0), LPE (16:1), LPE (18:0), LPE (18:1), LPE (18:2), and LPE (20:4)) was shown in 3 h Aβ(1–40)- and Aβ(1–42)-treated hippocampal neurones. A slight decrease in all LPE isoforms (LPE (16:0), LPE (16:1), LPE (18:0), LPE (18:1), LPE (18:2), and LPE (20:4)) was shown in 3 h Aβ(1–42)-treated glial cells (Figure 4). An increase was observed in all LPE isoforms (LPE (16:0), LPE (16:1), LPE (18:0), LPE (18:1), LPE (18:2), and LPE (20:4)) in 12 h Aβ(1–42)-treated glial cells (Figure 4). 12 h Aβ(1–40)-treated hippocampal neurones showed an decrease in LPE (16:1), LPE (18:0), LPE (18:2), and LPE (20:4) as well as an increase in LPE (16:0), LPE (18:1) isoforms. An increase of LPE (16:0), LPE (18:1), and LPE (20:4)) was seen in 12 h Aβ(1–42)-treated hippocampal neurones.
Lyso-Phosphatidylglycerol (LPG)
LPG (14:1) and LPG (16:1) showed a reduction in 12 h Aβ(1–40)-treated hippocampal neurones. Glial cells showed a strong increase after 3 h Aβ(1–40) and Aβ(1–42) treatment in LPG (14:1) and after 12 h Aβ(1–40) treatment in LPG (16:1). In addition, LPG (16:1) showed a decrease after 3 h Aβ(1–40) and Aβ(1–42) treatment of glial cells (Figure 4).
Lyso-Phosphatidylserine (LPS)
LPS (18:2) showed an increase in 3 h Aβ(1–40)- and Aβ(1–42)-treated glial cells as well as in 3 h and 12 h Aβ(1–40)-treated hippocampal neurones. A reduction was observed in Aβ(1–42)-treated hippocampal neurons after 3 h and 12 h (Figure 4). A decrease was observed in LPS (18:0) after 3 h Aβ(1–40)- and Aβ(1–42)-treated glial cells. LPS (16:0) was reduced in 3 h Aβ(1–40)-treated hippocampal neurones, as well as in 12 h Aβ(1–40)-treated glial cells (Figure 4).
Lyso-Platelet-Activating Factor (Lyso-PAF)
Lyso-PAF showed a reduction in 12 h Aβ(1–40)-treated glial cells, as well as in hippocampal neurones after 3 h and 12 h, for both Aβ(1–40) and Aβ(1–42) treatment. A prominent increase of lyso-PAF was observed in 3 h Aβ(1–40)- and Aβ(1–42)-treated glial cells (Figure 4).
References
- Brothers, H.M.; Gosztyla, M.L.; Robinson, S.R. The Physiological Roles of Amyloid-β Peptide Hint at New Ways to Treat Alzheimer’s Disease. Front. Aging Neurosci. 2018, 10, 118.
- Pearson, H.A.; Peers, C. Physiological roles for amyloid beta peptides. J. Physiol. 2006, 575, 5–10.
- Kumar, A.; Singh, A.; Ekavali. A review on Alzheimer’s disease pathophysiology and its management: An update. Pharmacol. Rep. 2015, 67, 195–203.
- Sosa, L.J.; Cáceres, A.; Dupraz, S.; Oksdath, M.; Quiroga, S.; Lorenzo, A. The physiological role of the amyloid precursor protein as an adhesion molecule in the developing nervous system. J. Neurochem. 2017, 143, 11–29.
- Walsh, D.M.; Klyubin, I.; Fadeeva, J.V.; Cullen, W.K.; Anwyl, R.; Wolfe, M.S.; Rowan, M.J.; Selkoe, D.J. Naturally secreted oligomers of amyloid beta protein potently inhibit hippocampal long-term potentiation in vivo. Nature 2002, 416, 535–539.
- Takahashi, R.H.; Milner, T.A.; Li, F.; Nam, E.E.; Edgar, M.A.; Yamaguchi, H.; Beal, M.F.; Xu, H.; Greengard, P.; Gouras, G.K. Intraneuronal Alzheimer abeta42 accumulates in multivesicular bodies and is associated with synaptic pathology. Am. J. Pathol. 2002, 161, 1869–1879.
- Walsh, D.M.; Selkoe, D.J. Deciphering the Molecular Basis of Memory Failure in Alzheimer’s Disease. Neuron 2004, 44, 181–193.
- Lacor, P.N.; Buniel, M.C.; Chang, L.; Fernandez, S.J.; Gong, Y.; Viola, K.L.; Lambert, M.P.; Velasco, P.T.; Bigio, E.H.; Finch, C.E.; et al. Synaptic targeting by Alzheimer’s-related amyloid beta oligomers. J. Neurosci. Off. J. Soc. Neurosci. 2004, 24, 10191–10200.
- Thal, D.R.; Schultz, C.; Dehghani, F.; Yamaguchi, H.; Braak, H.; Braak, E. Amyloid beta-protein (Abeta)-containing astrocytes are located preferentially near N-terminal-truncated Abeta deposits in the human entorhinal cortex. Acta Neuropathol. 2000, 100, 608–617.
- Gouras, G.K.; Tsai, J.; Naslund, J.; Vincent, B.; Edgar, M.; Checler, F.; Greenfield, J.P.; Haroutunian, V.; Buxbaum, J.D.; Xu, H.; et al. Intraneuronal Abeta42 accumulation in human brain. Am. J. Pathol. 2000, 156, 15–20.
- Hayashi, M.K.; Tang, C.; Verpelli, C.; Narayanan, R.; Stearns, M.H.; Xu, R.-M.; Li, H.; Sala, C.; Hayashi, Y. The postsynaptic density proteins Homer and Shank form a polymeric network structure. Cell 2009, 137, 159–171.
- Almeida, C.G.; Tampellini, D.; Takahashi, R.H.; Greengard, P.; Lin, M.T.; Snyder, E.M.; Gouras, G.K. Beta-amyloid accumulation in APP mutant neurons reduces PSD-95 and GluR1 in synapses. Neurobiol. Dis. 2005, 20, 187–198.
- Heras-Sandoval, D.; Ferrera, P.; Arias, C. Amyloid-β protein modulates insulin signaling in presynaptic terminals. Neurochem. Res. 2012, 37, 1879–1885.
- Sokolow, S.; Luu, S.H.; Nandy, K.; Miller, C.A.; Vinters, H.V.; Poon, W.W.; Gylys, K.H. Preferential accumulation of amyloid-beta in presynaptic glutamatergic terminals (VGluT1 and VGluT2) in Alzheimer’s disease cortex. Neurobiol. Dis. 2012, 45, 381–387.
- Takahashi, H.; Sekino, Y.; Tanaka, S.; Mizui, T.; Kishi, S.; Shirao, T. Drebrin-dependent actin clustering in dendritic filopodia governs synaptic targeting of postsynaptic density-95 and dendritic spine morphogenesis. J. Neurosci. Off. J. Soc. Neurosci. 2003, 23, 6586–6595.
- Takahashi, R.H.; Almeida, C.G.; Kearney, P.F.; Yu, F.; Lin, M.T.; Milner, T.A.; Gouras, G.K. Oligomerization of Alzheimer’s beta-amyloid within processes and synapses of cultured neurons and brain. J. Neurosci. Off. J. Soc. Neurosci. 2004, 24, 3592–3599.
- Klementieva, O.; Willén, K.; Martinsson, I.; Israelsson, B.; Engdahl, A.; Cladera, J.; Uvdal, P.; Gouras, G.K. Pre-plaque conformational changes in Alzheimer’s disease-linked Aβ and APP. Nat. Commun. 2017, 8, 14726.
- Gouras, G.K.; Olsson, T.T.; Hansson, O. β-Amyloid peptides and amyloid plaques in Alzheimer’s disease. Neurother. J. Am. Soc. Exp. NeuroTher. 2015, 12, 3–11.
- Hu, X.; Crick, S.L.; Bu, G.; Frieden, C.; Pappu, R.V.; Lee, J.-M. Amyloid seeds formed by cellular uptake, concentration, and aggregation of the amyloid-beta peptide. Proc. Natl. Acad. Sci. USA 2009, 106, 20324–20329.
- Chen, G.-F.; Xu, T.-H.; Yan, Y.; Zhou, Y.-R.; Jiang, Y.; Melcher, K.; Xu, H.E. Amyloid beta: Structure, biology and structure-based therapeutic development. Acta Pharmacol. Sin. 2017, 38, 1205–1235.
- Novo, M.; Freire, S.; Al-Soufi, W. Critical aggregation concentration for the formation of early Amyloid-β (1-42) oligomers. Sci. Rep. 2018, 8, 1783.
- Ries, M.; Sastre, M. Mechanisms of Aβ Clearance and Degradation by Glial Cells. Front. Aging Neurosci. 2016, 8, 160.
- Grimm, M.O.W.; Grimm, H.S.; Pätzold, A.J.; Zinser, E.G.; Halonen, R.; Duering, M.; Tschäpe, J.-A.; Strooper, B.D.; Müller, U.; Shen, J.; et al. Regulation of cholesterol and sphingomyelin metabolism by amyloid-β and presenilin. Nat. Cell Biol. 2005, 7, 1118–1123.
- He, X.; Huang, Y.; Li, B.; Gong, C.-X.; Schuchman, E.H. Deregulation of sphingolipid metabolism in Alzheimer’s disease. Neurobiol. Aging 2010, 31, 398–408.
- Kim, Y.; Kim, C.; Jang, H.Y.; Mook-Jung, I. Inhibition of Cholesterol Biosynthesis Reduces γ-Secretase Activity and Amyloid-β Generation. J. Alzheimer’s Dis. JAD 2016, 51, 1057–1068.
- Puglielli, L.; Ellis, B.C.; Saunders, A.J.; Kovacs, D.M. Ceramide stabilizes beta-site amyloid precursor protein-cleaving enzyme 1 and promotes amyloid beta-peptide biogenesis. J. Biol. Chem. 2003, 278, 19777–19783.
- Venkateswaran, A.; Laffitte, B.A.; Joseph, S.B.; Mak, P.A.; Wilpitz, D.C.; Edwards, P.A.; Tontonoz, P. Control of cellular cholesterol efflux by the nuclear oxysterol receptor LXR alpha. Proc. Natl. Acad. Sci. USA 2000, 97, 12097–12102.
- Korshavn, K.J.; Satriano, C.; Lin, Y.; Zhang, R.; Dulchavsky, M.; Bhunia, A.; Ivanova, M.I.; Lee, Y.-H.; La Rosa, C.; Lim, M.H.; et al. Reduced Lipid Bilayer Thickness Regulates the Aggregation and Cytotoxicity of Amyloid-β. J. Biol. Chem. 2017, 292, 4638–4650.
- Niu, Z.; Zhao, W.; Zhang, Z.; Xiao, F.; Tang, X.; Yang, J. The molecular structure of Alzheimer β-amyloid fibrils formed in the presence of phospholipid vesicles. Angew. Chem. Int. Ed. Engl. 2014, 53, 9294–9297.
More
Information
Subjects:
Agriculture, Dairy & Animal Science
Contributor
MDPI registered users' name will be linked to their SciProfiles pages. To register with us, please refer to https://encyclopedia.pub/register
:
View Times:
560
Revisions:
4 times
(View History)
Update Date:
04 Mar 2022
Table of Contents


Notice
You are not a member of the advisory board for this topic. If you want to update advisory board member profile, please contact office@encyclopedia.pub.
OK
Confirm
Only members of the Encyclopedia advisory board for this topic are allowed to note entries. Would you like to become an advisory board member of the Encyclopedia?
Yes
No
${ textCharacter }/${ maxCharacter }
Submit
Cancel
Back
Comments
${ item }
|
${ item.createdUser.fullName }
${ item.createdAt }
${ item.vote }
${ item.reply }
Delete
${ reply.createdUser.fullName }
${ reply.createdAt }
${ reply.vote }
Delete
There is no reply to this comment~
${ item.replyTextCharacter }/${ item.replyMaxCharacter }
Submit
Cancel
More
No more~
There is no comment~
${ textCharacter }/${ maxCharacter }
Submit
Cancel
${ selectedItem.replyTextCharacter }/${ selectedItem.replyMaxCharacter }
Submit
Cancel
Confirm
Are you sure to Delete?
Yes
No