Your browser does not fully support modern features. Please upgrade for a smoother experience.
Submitted Successfully!
 +1 credit
Thank you for your contribution! You can also upload a video entry or images related to this topic.
For video creation, please contact our Academic Video Service.
| Version | Summary | Created by | Modification | Content Size | Created at | Operation |
|---|---|---|---|---|---|---|
| 1 | Marisa Martin-Fernandez | + 3803 word(s) | 3803 | 2022-02-07 05:13:02 | | | |
| 2 | Conner Chen | -71 word(s) | 3732 | 2022-02-23 04:13:08 | | | | |
| 3 | Conner Chen | -71 word(s) | 3732 | 2022-02-23 04:20:16 | | | | |
| 4 | Conner Chen | + 12 word(s) | 3744 | 2022-02-24 08:02:07 | | | | |
| 5 | Conner Chen | + 12 word(s) | 3744 | 2022-02-24 08:04:01 | | | | |
| 6 | Conner Chen | Meta information modification | 3744 | 2022-02-28 02:21:02 | | |
Video Upload Options
We provide professional Academic Video Service to translate complex research into visually appealing presentations. Would you like to try it?
Cite
If you have any further questions, please contact Encyclopedia Editorial Office.
Martin-Fernandez, M. A Complex Disease: Non-Small Cell Lung Cancer. Encyclopedia. Available online: https://encyclopedia.pub/entry/19766 (accessed on 24 July 2026).
Martin-Fernandez M. A Complex Disease: Non-Small Cell Lung Cancer. Encyclopedia. Available at: https://encyclopedia.pub/entry/19766. Accessed July 24, 2026.
Martin-Fernandez, Marisa. "A Complex Disease: Non-Small Cell Lung Cancer" Encyclopedia, https://encyclopedia.pub/entry/19766 (accessed July 24, 2026).
Martin-Fernandez, M. (2022, February 22). A Complex Disease: Non-Small Cell Lung Cancer. In Encyclopedia. https://encyclopedia.pub/entry/19766
Martin-Fernandez, Marisa. "A Complex Disease: Non-Small Cell Lung Cancer." Encyclopedia. Web. 22 February, 2022.
Copy Citation
Non-small cell lung cancer (NSCLC) is a complex disease often driven by activating mutations or amplification of the epidermal growth factor receptor (EGFR) gene, which expresses a transmembrane receptor tyrosine kinase. Targeted anti-EGFR treatments include small-molecule tyrosine kinase inhibitors (TKIs), among which gefitinib and erlotinib are the best studied, and their function more often imaged. TKIs block EGFR activation, inducing apoptosis in cancer cells addicted to EGFR signals.
Non-small cell lung cancer
epidermal growth factor receptor
egfr
fluorescence
microscopy
1. A Brief Outline of Non-Small Cell Lung Cancer
Lung cancers are classified in two main histological groups: small-cell lung cancer (SCLC) and non-small cell lung cancer (NSCLC) [1]. SCLC comprises ~15–20% of all primary lung tumours and is often caused by smoking [2]. NSCLC frequently arises among non-smokers and can be sub-divided into adenocarcinoma, squamous cell carcinoma, the most prevalent, large cell carcinoma, and bronchial carcinoid tumour [3]. Like all tumours, dysregulated cell division is driven in NSCLC by genetic alterations, the accumulation of which eventually enables tumour cells to acquire limitless replicative potential [4]. Gene sequencing technologies have allowed the identification of driver oncogenic gene alterations in the EGFR gene itself [5], and/or of genes expressing oncogenic proteins within EGFR’s downstream signalling pathways, especially those that regulate cell survival and proliferation, on which tumour initiation and growth critically depend [6] (examples in Box 1). Mutations in genes downstream of EGFR decouple cell growth and proliferation from EGFR signalling, hence anti-EGFR drugs become ineffective.
Box 1. Some Common Oncogenes in NSCLC.
| EGFR | EGFR is one of the four members of the human epidermal growth factor (HER) family transmembrane receptors (HER1/EGFR, HER2, HER3, and HER4). The prevalence of EGFR oncogene mutations is 50% among Asian patients with lung adenocarcinoma and 15% among Western patients [7]. Exon 19 deletions or L858R point mutations in exon 21 account for 90% of the activating mutations in the tyrosine kinase domain of EGFR, resulting in constitutive activation of EGFR without growth factor-induced stimulation, thus promoting cell proliferation [5]. |
| KRAS | KRAS is the predominantly mutated RAS isoform (85%) and also the most frequent oncogene in NSCLC [8]. KRAS fosters tumour growth via several mechanisms, including by upregulating rate-limiting enzymes involved in amino acid, fatty acid, or nucleotide biosynthesis, and by stimulating scavenging pathways, such as macropinocytosis and autophagy [9][10], which, in turn provide building blocks for the anabolic routes, also maintaining the energy levels and the cell’s redox potential [11]. |
| BRAF | BRAF is a proto-oncogene encoding a serine-threonine protein kinase acting downstream of the RAS/RAF/ERK signalling pathway. BRAF carries signals from membrane receptors (such as EGFR) to the nucleus of the cell to regulate DNA transcription [12]. BRAF is an oncogene located on chromosome 7 involved in several cell functions, including growth, proliferation, survival, and differentiation. Immunotherapy is beginning to show promise as an active therapy in BRAF-mutated NSCLC [13]. |
| ALK | The ALK gene encodes the ALK tyrosine kinase receptor and is associated with many types of cancers, including NSCLC [14]. There are three types of ALK mutations: rearrangement (ALK-R), amplification (ALK-A), and point mutation. ALK gene rearrangement is a driving mutation underlying the development of NSCLC [15], which appears to be more common in younger patients and never or light smokers diagnosed with adenocarcinoma. ALK can phosphorylate STAT3 and PI3K independently of ERK to antagonise apoptosis and promote cell survival [16]. |
| TP53 | The TP53 gene encodes a DNA damage check point p53 protein, which is at the heart of the cellular decision to proliferate or activate programmed cell death. It regulates the transcription of ~500 genes [17], including cell cycle regulatory genes and transcription factors, and DNA repair genes [18]. Over 50% of human cancers carry loss of function mutations in TP53, with the mutant form acting as a dominant-negative inhibitor towards the wild-type moiety. When chromosomal abnormalities or environment stresses become overwhelming, p53 can arrest cell-cycle progression and induce apoptosis. TP53 alterations carry a worse prognosis in NSCLC [19]. |
| MYC | A family of three human proto-oncogenes (c-MYC, l-MYC, and n-MYC) code for transcription factors [20]. In normal cells, depending on nucleotide pools’ levels, growth signals, glucose, or oxygenation, elevated MYC expression can cause apoptosis. Transformed cells can, however, adapt to constitutively elevated levels of MYC expression, resist its apoptotic effects, and only respond to MYC pro-proliferative signals either via loss of growth suppression surveillance mechanisms (e.g., TP53 mutation) and/or by gain of pro-survival signals. MYC is a metastasis gene for NSCLC [21]. |
Surgery, radiation, and chemotherapy remain among the first-line treatments for NSCLC [22]. More targeted therapies include immune check-point inhibitors, engineered cytotoxic chimeric antigen receptor-immune T cells, oncolytic viruses, anti-tumour vaccines, and small-molecule inhibitors against oncogenes driving NSCLC tumours [23]. Of interest here is the sub-class of quinazoline-derived small-molecule EGFR-selective tyrosine kinase inhibitors (TKIs) that target EGFR, and specifically first-generation gefitinib and erlotinib, because these two TKIs are still commonly employed as first-line therapies [24] and have also been extensively investigated via fluorescence microscopy methods.
EGFR signalling is at the heart of cell growth and proliferation. This makes EGFR mutations highly susceptible to be exploited by cancer cells to alter their physiology and achieve immortalisation [5]. Key oncogenetic EGFR alterations upon which NSCLC tumours become addicted to EGFR signals include somatic mutations in the EGFR gene clustered around the periphery of the catalytic adenosine triphosphate (ATP)-binding cleft in EGFR’s kinase domain (Figure 1A). The two most common are a point substitution in exon 21 (L858R), which, for example, accounts for 90% of all NSCLC activating oncogenic EGFR mutations in the NSCLC Caucasian patient subset, and an in-frame deletion in exon 19 (e.g., DL746-P750) [25] (Figure 1B). Lower-frequency mutations include point mutations in exon 18 (G719X, G719S, G719A) and exon 20 (V765A and T783A) [26]. Different mutations can display different sensitivities to TKI inhibition of autophosphorylation and downstream signals (see, for example, [27]).
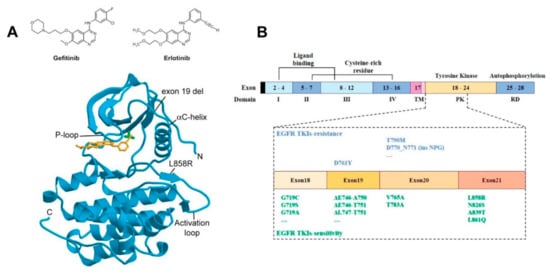
Figure 1. Gefitinib and erlotinib binding to EGFR’s kinase domain. (A) Top: Structures of gefinitib and erlotinib; bottom: Schematic representation of the wild-type EGFR tyrosine kinase domain (cyan) bound to erlotinib (orange) (PDB entry 1M17). The threonine 790 side chain is shown in green (top right of the bound TKI). EGFR numbering includes the 24 residue signal sequence [28]. Conserved structural features essential to the activation of the kinase domain, the phosphate-binding loop (P-loop), the αC-helix, and the activation loop are shown. Sites of common NSCLC TKI-sensitive mutations (exon 19 deletion and L858R substitution) are also shown. Reproduced from [28]. (B) Schematic representation of the domains of EGFR and the corresponding exons. Specific NSCLC-related mutations in the kinase domain of EGFR (exons 18–24) that are associated with sensitivity or resistance to EGFR-TKIs are denoted [29]. Reproduced from [29].
The first tumour-suppressing responses to TKI therapy were observed for gefitinib and erlotinib almost 20 years ago (see, for example, [30][31][32]). Orally administered, these TKIs reversibly outcompete the binding of ATP to the phosphate-binding loop in the kinase domain of EGFR, thus suppressing its tyrosine kinase activity [33] (Figure 1A). A striking response was found in a subset of ~10–40% of patients who harboured NSCLC tumours driven by somatic activating mutations in the first 4 exons of the tyrosine kinase domain of the EGFR gene [34][35] (Figure 1B). This success led to the approval of gefitinib and erlotinib for the treatment of NSCLC patients bearing such mutations [36].
Another common driver of NSCLC found in 50–90% of cases is an increase in the EGFR copy number, which often results in the overexpression of wild-type EGFR (wtEGFR) [37]. Among these tumours, approximately 80% were found to be de novo resistant to gefitinib and erlotinib despite TKIs potently blocking the kinase activity and autophosphorylation of wtEGFR [38]. The intrinsic resistance of wtEGFR-expressing tumours to TKIs is recapitulated by many other solid tumour types [39]. This is so even in the absence of mutations in effectors downstream of EGFR that decouple growth and survival pathways from EGFR signalling [15] (Box 1). The reasons for this are not well understood.
APOPTOSIS: Associated plasma membrane structural changes include translocation of the anionic phosphatidyl serine (PS) from the inner to the outer leaflet of the lipid bilayer where it can bind Annexin V, a Ca2+-dependent phospholipid-binding protein with high affinity for PS. By labelling Annexin V with fluorescent dyes (e.g., FITC [40]), one can image, for example, via wide-field or confocal microscopy, and/or flow cytometry, Annexin V-positive cells to determine the rate of apoptosis [41]. Fluorescent Annexin V conjugates provide a quick and reliable detection method of the early stages of apoptosis [42]. Apoptosis in cells can also be detected, for example, by imaging fluorescence conjugates of Bax as it translocates from the cytosol to the outer mitochondrial membrane, and/or cytochrome C as it is released from the mitochondria into the cytosol [43].
ENDOCYTOSIS: Immunostaining against endosomal protein markers [44] includes against early endosome proteins (Syntaxin 6 and Rab5 [45], and EEA1 [46]), recycling endosome markers (e.g., Rab25 [47]), and late endosome/lysosomal markers (Rab7 [48], LAMP1 and LAMP2 [49], cathepsin D, and LIMPII [50]). Primary or secondary antibodies can be conjugated with dyes of different colours (e.g., Alexa 488, Alexa 594, or Alexa 647). Typical endosomes (~100 nm) are smaller than optical resolution (~250 nm), hence endosomes look like puncta under a wide-field or confocal fluorescence microscope. To image EGFR endocytic traffic, one can, for example, label an EGFR cognate ligand (e.g., EGF) with organic dyes, both visible and infrared [51], or clone EGFR with tags, such as Halo [52] and SNAP [53], which are subsequently labelled with Alexa or Cyanine dyes. In live cells, one can use fluorescent protein (FP) fusions of the endosomal markers and/or of other proteins (e.g., clathrin [54]). To image in the nucleus, a popular method is fluorescence in situ hybridisation (FISH) assays [55].
AUTOPHAGY: FP constructs of the 17 kDa soluble microtubule-associated protein 1A/1B-Light Chain 3 (LC3) [56] are commonly used (e.g., eGFP-LC3, mCherry-LC3, or RFP-LC3). During autophagy, the cytoplasmic form of LC3 (LC3-I) becomes covalently ligated to phosphatidyl ethanolamine (PE). The appearance of fluorescent puncta of the lipidated LC3-II form allow determination via wide-field or confocal fluorescence microscopy of the number of autophagosomes (dia. 500–900 nm [57]), where LC3-II is recruited to [58]. Serum depletion and the autophagic inhibitor 3-methyladenine (chloroquine) are often used as positive controls [59]. Colocalisation of red and green probes (e.g., RFP-LC3 and LysoSensor Green) allows for the morphological observation and quantification of autophagosome maturation and fusion with the lysosome [60]. pH-responsive FPs (and organic dyes) allow the evaluation of intracellular pH and interrogation of specific subcellular compartments [61].
SINGLE PARTICLE TRACKING (SPT): A direct probe of fluorescent particle movement in live cells [62]. In two colours, SPT can report molecular association and dissociation events in real time from which kinetic and dynamic interaction parameters can be determined (e.g., [63][64]). At the plasma membrane, SPT exploits total internal reflection fluorescence (TIRF) illumination to improve contrast [65]. Suitable organic dyes and other probes have to be selected to ensure specific interactions with the proteins of interest and to minimise non-specific staining of the (typically) glass surface where the TIRF evanescent wave illuminating the adjacent basolateral cell surface is concentrated [66][67]. SPT can also be used to track particles in endosomes and at the nucleus using probes, such as adaptamers and FPs, and/or bright organic dyes, such as Atto 647N (e.g., [68][69]).
NEAR-FIELD SCANNING OPTICAL MICROSCOPY (NSOM) [70]: The resolution of NSOM is defined by the size of the point light source used (typically 50–100 nm). NSOM breaks the far-field optical resolution limit (~250 nm) by exploiting the properties of evanescent waves in close vicinity (i.e., ~nanometres) of the aperture defining the size of the point light source, which must therefore be brought within nanometres of the surface to collect the near-field optical signal. The point source is scanned over the surface, without touching it. The distance between the point light source and the sample surface is usually controlled through a feedback mechanism that is unrelated to the NSOM signal (e.g., as in AFM) [71]).
STOCHASTIC OPTICAL RECONSTRUCTION MICROSCOPY (STORM) [72]: A single-molecule localisation microscopy (SMLM) method with a resolution of ~20 nm. It reports on the number of proteins that form nanoclusters and on the size of the clusters (example shown in Figure 6). STORM is compatible with many commonly used organic dyes, which can be converted to an off state using specific excitation parameters combined with oxygen-scavenging imaging buffers. Fluorophores for STORM should be bright, have a high rate of photo-switching, and exhibit minimal photo-bleaching in thiol-containing buffers. Normally used to analyse clusters in chemically fixed cells, sub-12 nm resolution is possible in cryo-vitrified samples using solid immersion lenses [73].
FLUORESCENCE RESONANCE ENERGY TRANSFER (FRET): A spectroscopic ruler useful for measuring intra-molecular and inter-molecular separations in the range ~2–8 nm [74]. It is based on the transfer of excitation energy between two fluorescent molecules through non-radiative dipole–dipole coupling [75][76]. The rate of energy transfer, from which the separation between donor and acceptor molecules can be measured, is determined chiefly from the overlap between the emission spectra of the donor and the excitation spectra of the acceptor. FRET can be combined with SPT [77][78][79] (Figure 6E), fluorescence lifetime imaging (FLIM) [80], and fluorescence polarisation [81]. The combination can be used to detect dimers and oligomers, and/or to determine separations between two planes, as a proxy for molecular orientation at the plasma membrane [82].
FLUOROPHORE LOCALISATION IMAGING WITH PHOTOBLEACHING (FLImP) [83][84]: Based on SMLM, the position of a cluster of fluorescent molecules changes upon each individual photobleaching event. The shift in the position of the cluster can be analysed to report on the lateral separations between the molecules in the cluster. FLImP can measure separations between identical fluorophores in the 0–60 nm range, and can achieve sub-5 nm resolution [85]. Combined with atomic molecular dynamics (MD) simulations, it can report on the dimer and oligomer structure [85][86].
2. EGFR’s Role in the Development of NSCLC Tumours
2.1. EGFR Structure and Signalling Pathways
EGFR is the founding member of the family of four human receptor tyrosine kinases (HER1–4) [87]. Additionally termed ErbB1 because of its close similarity with the avian viral v-erb-B oncogene protein [88], EGFR was cloned and sequenced in the early 1980s [89], and is ubiquitously expressed in epithelial, mesenchymal, and neuronal cells [90]. Structurally, the EGFR consists of a growth factor-binding ectodomain made out of four subdomains, a single-pass transmembrane alpha helix, an inner juxtamembrane segment, a kinase domain locus of EGFR’s intrinsic protein tyrosine kinase activity, and a long unstructured C-terminal domain [91] (Figure 2A). EGFR binds seven cognate growth factors, namely epidermal growth factor (EGF), transforming growth factor alpha, betacellulin, heparin-binding EGF-like growth factor, epiregulin, and epigen [92]. Growth factor binding induces a conformational change in EGFR’s ectodomain [93] that exposes a loop required for ectodomain dimerization [94][95] (Figure 2A). This leads to allosteric changes across the plasma membrane, chiefly the formation of a catalytically active asymmetric kinase domain dimer [96], via which EGFR becomes phosphorylated (p-EGFR) in five key C-terminal tyrosine phosphorylation sites (Tyr992, Tyr1045, Tyr1068, Tyr1086, and Tyr1173) [97][98]. Activating EGFR mutations and EGFR overexpression elicits growth factor-independent constitutive receptor dimerisation and/or oligomerisation, thereby activating the catalytic activity of the receptor without the need for the growth factor stimulus [86][99]. This allows EGFR to trigger downstream signalling pathways in a growth factor-independent dysregulated fashion, ultimately eliciting uncontrolled cell division and tumour proliferation [5][38].
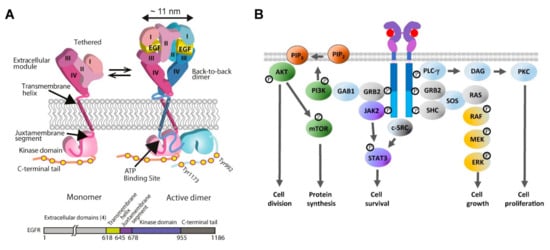
Figure 2. (A) Cartoon of the EGF-induced receptor dimerisation process and an EGFR sequence diagram. Left: A tethered single-pass EGFR monomer [93]. Right: The EGFR monomer binds EGF to form an extended back-to-back ectodomain dimer [94][95], structurally coupled via an N-crossing dimer of two transmembrane alpha-helices [99] to an asymmetric tyrosine kinase dimer [96], in which the activator kinase (pink) allosterically activates a receiver kinase (blue), which phosphorylates the C-terminal domain of the donor kinase [96][99]. Reproduced from [85]. (B) Growth factor-dependent EGFR signalling pathways. EGFR activates the RAS/extracellular signal-regulated kinase (ERK) pathway for cell growth, and the JAK/signal transducer and activator of transcription 3 (STAT3) signalling cascade for cell survival. Activation of the PI3K/AKT/mammalian target of rapamycin (mTOR) signalling pathway leads to cell division via AKT phosphorylation and protein synthesis via mTOR phosphorylation. EGFR activates Phospholipase C gamma (PLCγ), which in turn activates the PKC signalling pathway, leading to cell proliferation [100].
Summarised [100]in Figure 2B, EGFR recruits via its C-terminal pY992 the Src Homology 2 (SH2) domain of PLC-γ, which hydrolyses PIP2, releasing diacylglycerol (DAG) and inositol 1,4,5-triphosphate (IP3), and leading to the activation of PKC and cell proliferation. EGFR can recruit via pY1068, pY1148, and pY1173 the SH2/SH3 adaptors GRB2 and SHC, which bind via their SH3 domains the protein scaffolds SOS and GAB1 to initiate well-defined tyrosine/serine/threonine phosphorylation cascades [101]. One is the RAS-RAF-MEK-ERK1/2 signalling pathway, which leads to ERK activation and translocation of ERK from the cytoplasm to the nucleus, where it upregulates genes that promote cell growth [102]. GRB2 also recruits via GAB1 the lipid kinase PI3K [103]. PI3K catalyses PIP2 into PIP3, which recruits AKT, leading to the activation of the PI3K-AKT-mTOR signalling pathway. Phosphorylation of AKT leads to the inhibition of antagonists of Cyclin D1 and cell division [104]. AKT-mediated phosphorylation of mTOR upregulates the cell’s anabolic metabolism [105]. Phosphorylated EGFR also activates the JAK2/STAT3 signalling axis to upregulate the transcription of a variety of proteins involved in the survival of cancer cells [106]. EGFR also interacts with c-SRC, a crucial non-receptor tyrosine kinase and an oncogenic partner in EGFR-driven NSCLC [107]. Among many other pro-survival functions [108], c-SRC synergises with EGFR to activate STAT3 in a JAK-independent manner [109].
2.2. TKI Treatments Induce Apoptosis via the Mitochondrial Intrinsic Pathway
The oncogenic addiction of some NSCLC tumours to dysregulated EGFR signalling underpins the rationale for treating the disease by using TKIs to stop the p-EGFR-dependent downstream signalling pathways that are essential to sustain uncontrolled cell proliferation, thereby inducing programmed cell death [110]. Early experiments in lung adenocarcinoma A549 cells [111] showed that termination of p-EGFR signals by gefitinib resulted in phosphorylation and activation of the cell cycle regulator protein p53 (Box 1), followed by p53-dependent upregulation of PUMA, a pro-apoptotic, BCL2 homology 3 (BH3) domain-containing member of the BCL2 family [112], which activates rapid induction of the caspase-dependent intrinsic apoptosis pathway [113] (Figure 3). Gefinitib also upregulated pro-apoptotic Fas and downregulated the anti-apoptotic proteins survivin and XIAP [111]. Further experiments in TKI-sensitive lung adenocarcinoma cell lines (PC-9 and H1560, which express the D746–750 deletion EGFR mutant, and H1975 that express the L858R mutant) showed that erlotinib dramatically induces the expression of BIM, another pro-apoptotic BH3-only member of the BCL2 family [112], which, like PUMA, also mediates TKI-induced apoptosis via the intrinsic pathway of caspase activation [114] (for a transcriptional profiling of NSCLC cell lines, see [115][116]). In cells with activating EGFR somatic mutations, BIM’s pro-apoptotic effects are synergistic with the loss of survivin, whose downregulation enhances gefitinib-induced apoptotic death in TKI-sensitive NSCLC cells [117]. These results were confirmed in lung tumours and xenografts from mice bearing mutant EGFR-dependent lung adenocarcinomas, which also display increased concentrations of BIM after erlotinib treatment [27]. Gefitinib and erlotinib also block EGFR phosphorylation of ERK and AKT, therefore pushing the closely regulated equilibrium maintained by the BH3-only BCL2 family towards the activation of effector members BAK and BAX, which thereby form oligomers at the outer mitochondrial membrane, leading to mitochondrial outer membrane permeabilisation (MOMP) and apoptosis [118][119] (Figure 3). Confocal microscopy images in live cells of the cellular distribution of BAX fused to GFP before and 3 h after stimulating apoptosis via treatment with staurosporine [120] are also shown in Figure 3.
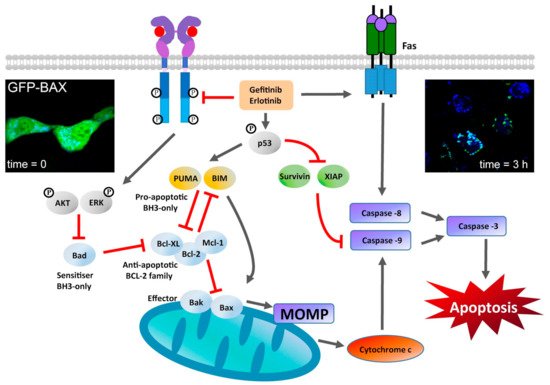
Figure 3. Stimulation of the mitochondrial-dependent intrinsic apoptosis pathway by gefitinib and erlotinib. This pathway is marked by a key event—mitochondrial outer membrane permeabilization (MOMP)—which results in the release of cytochrome c from the mitochondrial intermembrane space. MOMP can be triggered by the activation of BH3-only proteins of the BCL-2 family [112] following their post-translational modification (e.g., phosphorylation) [121]. Activated BH3-only proteins generally stimulate MOMP by inducing the oligomerization of BCL2-associated X protein (BAX) and/or BCL2 antagonist or killer (BAK) in the outer mitochondrial membrane, thereby forming supramolecular channels that mediate the liberation of cytochrome c [118]. At the cytosol, cytochrome c triggers the assembly of a caspase-activating complex between caspase 9 and apoptotic protease-activating factor 1 [122]. TKI inhibition can stimulate the transactivation of genes encoding pro-apoptotic proteins (such as the BH3-only protein p53-upregulated modulator of apoptosis (PUMA)). Gefitinib and erlotininib can also activate the so-called death receptor FAS, leading to activation of caspase 8 [111][112]. Caspase 8 proteolytically activates downstream effector caspases or truncates the BH3-only protein BID (BH3-interacting domain death agonist), which co-activates the intrinsic pathway of apoptosis by translocating to mitochondria. Caspase-8 interacts with caspase-9 to activate the executioner caspase-3, which coordinates the destruction of cellular structures, such as DNA fragmentation or degradation of cytoskeletal proteins [123]. Fluorescence image inserts: left: Live cell image of exogenous GFP-BAX expressed in D407 cells (immortalized human retinal pigment epithelial cells); right: same area imaged after inducing apoptosis using 1 μM staurosporine prepared in DMSO. Images were taking using a spinning disk confocal microscope, which is ideal for fast 3D imaging of live cells and using an EM-CCD camera. Scale bar = 5 μm. Images reproduced from [120].
2.3. The Development of Resistance to TKI Treatment
Even among the NSCLC patients that respond, the effects of gefinitib and erlotinib are transient (mean progression-free survival of 10–14 months) [124]. Approximately 50% of NSCLC cases develop a secondary point substitution in exon 20 of the EGFR gene (T790M), which confers resistance to first-generation TKI by impeding the inhibition of receptor phosphorylation through a substantially increased affinity of the EGFR’s kinase domain pocket for ATP [125]. New generations of TKIs have been developed in a race to overcome the effects of the single T790M and double L858R/T790M mutations, including second-generation (irreversible) afatinib and dacomitinib, and third-generation (T790M selective) osimertinib, which are currently used in the clinic [126]. However, further mutations in the EGFR gene and of downstream effectors eventually allow tumours to overcome the TKI therapeutic block and resume uncontrolled proliferation [6][127].
Acquired mutations not only involve the EGFR gene (e.g., the secondary T790M acquired EGFR mutation and others [26]), but can also be EGFR independent (e.g., loss of p53 function, constitutive activation of RAS, etc. (Box 1)). Together, acquired mutations contribute to increase tumour heterogeneity and develop pro-survival adaptation mechanisms at cellular and tumour levels [128][129]. However, for such mutations to accumulate, cells need to first survive the initial therapeutic insult. An important observation is that TKIs fail to trigger apoptosis in a fraction of responsive NSCLC tumour cells addicted to EGFR signals, instead inducing G1 cycle arrest [27]. Whilst the latter contributes to suppress tumour growth, quiescent cells surviving TKI treatment have the opportunity to acquire mutations and/or invoke adaptation mechanisms by which they can eventually resume uncontrolled proliferation. Chiefly among EGFR-dependent mechanisms of adaptation are pro-survival functions exercised by EGFR independently of its kinase activity, which can be recapitulated in quiescent cells by the actions of TKI-bound EGFRs [39]. Examples of EGFR kinase-independent functions include stimulation of DNA synthesis [130], expression of the c-fos proto-oncogene [131], and dysregulation of cellular self-degradation processes [132], with the latter extensively imaged by fluorescence microscopy methods.
References
- Kentaro Inamura; Lung Cancer: Understanding Its Molecular Pathology and the 2015 WHO Classification. Frontiers in Oncology 2017, 7, 193, 10.3389/fonc.2017.00193.
- Jun Chen; Yingwei Qi; Jason A. Wampfler; Aminah Jatoi; Yolanda I. Garces; Allan J. Busta; Sumithra J. Mandrekar; Ping Yang; Effect of cigarette smoking on quality of life in small cell lung cancer patients. European Journal of Cancer 2012, 48, 1593-1601, 10.1016/j.ejca.2011.12.002.
- Cesare Gridelli; Antonio Rossi; David P. Carbone; Juliana Guarize; Niki Karachaliou; Tony Mok; Francesco Petrella; Lorenzo Spaggiari; Rafael Rosell; Non-small-cell lung cancer. Nature Reviews Disease Primers 2015, 1, 15009, 10.1038/nrdp.2015.9.
- Yixin Yao Wei Dai; Genomic Instability and Cancer. Journal of Carcinogenesis & Mutagenesis 2014, 5, 1000165, 10.4172/2157-2518.1000165.
- Jean-Charles Soria; Tony S. Mok; Federico Cappuzzo; Pasi A. Jänne; EGFR-mutated oncogene-addicted non-small cell lung cancer: Current trends and future prospects. Cancer Treatment Reviews 2012, 38, 416-430, 10.1016/j.ctrv.2011.10.003.
- Ya-Sian Chang; Siang-Jyun Tu; Yu-Chia Chen; Ting-Yuan Liu; Ya-Ting Lee; Ju-Chen Yen; Hsin-Yuan Fang; Jan-Gowth Chang; Mutation profile of non-small cell lung cancer revealed by next generation sequencing. Respiratory Research 2021, 22, 1-10, 10.1186/s12931-020-01608-5.
- Mathieu Chevallier; Maxime Borgeaud; Alfredo Addeo; Alex Friedlaender; Oncogenic driver mutations in non-small cell lung cancer: Past, present and future. World Journal of Clinical Oncology 2021, 12, 217-237, 10.5306/wjco.v12.i4.217.
- Ian A. Prior; Paul D. Lewis; Carla Mattos; A Comprehensive Survey of Ras Mutations in Cancer. Cancer Research 2012, 72, 2457-2467, 10.1158/0008-5472.can-11-2612.
- Vaishali Jayashankar; Aimee L. Edinger; Macropinocytosis confers resistance to therapies targeting cancer anabolism. Nature Communications 2020, 11, 1-15, 10.1038/s41467-020-14928-3.
- Jessie Yanxiang Guo; Gizem Karsli-Uzunbas; Robin Mathew; Seena C. Aisner; Jurre J. Kamphorst; Anne M. Strohecker; Guanghua Chen; Sandy Price; Wenyun Lu; Xin Teng; et al.Eric SnyderUrmila SantanamRobert S. DiPaolaTyler JacksJoshua D. RabinowitzEileen White Autophagy suppresses progression of K-ras-induced lung tumors to oncocytomas and maintains lipid homeostasis. Genes & Development 2013, 27, 1447-1461, 10.1101/gad.219642.113.
- Emma M. Kerr; Carla P. Martins; Metabolic rewiring in mutant Kras lung cancer. FEBS Journal 2017, 285, 28-41, 10.1111/febs.14125.
- Qing-Ge Zhu; Shi-Ming Zhang; Xiao-Xiao Ding; Bing He; Hu-Qin Zhang; Driver genes in non-small cell lung cancer: Characteristics, detection methods, and targeted therapies. Oncotarget 2017, 8, 57680-57692, 10.18632/oncotarget.17016.
- Connor Gerard O’Leary; Vladamir Andelkovic; Rahul Ladwa; Nick Pavlakis; Caicun Zhou; Fred Hirsch; Derek Richard; Kenneth O’Byrne; Targeting BRAF mutations in non-small cell lung cancer. Translational Lung Cancer Research 2019, 8, 1119-1124, 10.21037/tlcr.2019.10.22.
- Xue Du; Yun Shao; Hai-Feng Qin; Yan-Hong Tai; Hong-Jun Gao; ALK- rearrangement in non-small-cell lung cancer (NSCLC). Thoracic Cancer 2018, 9, 423-430, 10.1111/1759-7714.12613.
- Siddhartha Devarakonda; Daniel Morgensztern; Ramaswamy Govindan; Genomic alterations in lung adenocarcinoma. The Lancet Oncology 2015, 16, e342-e351, 10.1016/s1470-2045(15)00077-7.
- Roberto Chiarle; Claudia Voena; Chiara Ambrogio; Roberto Piva; Giorgio Inghirami; The anaplastic lymphoma kinase in the pathogenesis of cancer. Nature Reviews Cancer 2008, 8, 11-23, 10.1038/nrc2291.
- Brandon J Aubrey; Gemma L Kelly; Ana Janic; Marco J Herold; Andreas Strasser; How does p53 induce apoptosis and how does this relate to p53-mediated tumour suppression?. Cell Death & Differentiation 2017, 25, 104-113.
- Sagar Sengupta; Curtis C. Harris; p53: traffic cop at the crossroads of DNA repair and recombination. Nature Reviews Molecular Cell Biology 2005, 6, 44-55, 10.1038/nrm1546.
- Akira Mogi; Hiroyuki Kuwano; TP53 Mutations in Nonsmall Cell Lung Cancer. Journal of Biomedicine and Biotechnology 2011, 2011, 1-9, 10.1155/2011/583929.
- Steven B. McMahon; MYC and the Control of Apoptosis. Cold Spring Harbor Perspectives in Medicine 2014, 4, a014407-a014407, 10.1101/cshperspect.a014407.
- Ulf R. Rapp; Christian Korn; Fatih Ceteci; Christiaan Karreman; Katharina Luetkenhaus; Valentina Serafin; Emanuele Zanucco; Inês Castro; Tamara Potapenko; Myc Is a Metastasis Gene for Non-Small-Cell Lung Cancer. PLoS ONE 2009, 4, e6029, 10.1371/journal.pone.0006029.
- Cecilia Zappa; Shaker A. Mousa; Non-small cell lung cancer: current treatment and future advances. Translational Lung Cancer Research 2016, 5, 288-300, 10.21037/tlcr.2016.06.07.
- Volker Schirrmacher; From chemotherapy to biological therapy: A review of novel concepts to reduce the side effects of systemic cancer treatment (Review).. International Journal of Oncology 2018, 54, 407-419, 10.3892/ijo.2018.4661.
- Jens Köhler; Martin Schuler; Afatinib, Erlotinib and Gefitinib in the First-Line Therapy of EGFR Mutation-Positive Lung Adenocarcinoma: A Review. Onkologie 2013, 36, 5-5, 10.1159/000354627.
- A. T. Dimou; K. N. Syrigos; S. Agarwal; L. Lozovatsky; V. Zolota; V. K. Anagnostou; D. Rimm; Frequency of L858R and D746-750 EGFR mutations in 411 Caucasian patients with non-small cell lung cancer measured by mutation-specific antibodies.. Journal of Clinical Oncology 2010, 28, 1587-1587, 10.1200/jco.2010.28.15_suppl.1587.
- Allan R. Li; Dhananjay Chitale; Gregory J. Riely; William Pao; Vincent A. Miller; Maureen F. Zakowski; Valerie Rusch; Mark G. Kris; Marc Ladanyi; EGFR Mutations in Lung Adenocarcinomas: Clinical Testing Experience and Relationship to EGFR Gene Copy Number and Immunohistochemical Expression. The Journal of Molecular Diagnostics 2008, 10, 242-248, 10.2353/jmoldx.2008.070178.
- Yixuan Gong; Romel Somwar; Katerina Politi; Marissa Balak; Juliann Chmielecki; Xuejun Jiang; William Pao; Induction of BIM Is Essential for Apoptosis Triggered by EGFR Kinase Inhibitors in Mutant EGFR-Dependent Lung Adenocarcinomas. PLoS Medicine 2007, 4, e294-e294, 10.1371/journal.pmed.0040294.
- Jennifer Clark; Jan Cools; D. Gary Gilliland; EGFR Inhibition in Non-Small Cell Lung Cancer: Resistance, Once Again, Rears Its Ugly Head. PLOS Medicine 2005, 2, e75, 10.1371/journal.pmed.0020075.
- Yoojung Kwon; Misun Kim; Hyun Suk Jung; Youngmi Kim; Dooil Jeoung; Targeting Autophagy for Overcoming Resistance to Anti-EGFR Treatments. Cancers 2019, 11, 1374, 10.3390/cancers11091374.
- N.H. Hanna; EGFR Mutation and Resistance of Non-Small-Cell Lung Cancer to Gefitinib. Yearbook of Oncology 2006, 2006, 228-229, 10.1016/s1040-1741(08)70161-1.
- Makoto Maemondo; Yuji Minegishi; Akira Inoue; Kunihiko Kobayashi; Masao Harada; Shoji Okinaga; Naoto Morikawa; Satoshi Oizumi; Tomoaki Tanaka; Hiroshi Isobe; et al.Shoji KudohKoichi HagiwaraToshihiro NukiwaAkihiko Gemmah First-Line Gefitinib in Patients Aged 75 or Older With Advanced Non–Small Cell Lung Cancer Harboring Epidermal Growth Factor Receptor Mutations: NEJ 003 Study. Journal of Thoracic Oncology 2012, 7, 1417-1422, 10.1097/jto.0b013e318260de8b.
- Siow Ming Lee; Iftekhar Khan; Sunil Upadhyay; Conrad Lewanski; Stephen Falk; Geraldine Skailes; Ernie Marshall; Penella Woll; Matthew Hatton; Rohit Lal; et al.Richard JonesElizabeth ToyDavid ChaoGary MiddletonSue BulleyYenting NgaiRobin RuddAllan HackshawChris Boshoff First-line erlotinib in patients with advanced non-small-cell lung cancer unsuitable for chemotherapy (TOPICAL): a double-blind, placebo-controlled, phase 3 trial. The Lancet Oncology 2012, 13, 1161-1170, 10.1016/s1470-2045(12)70412-6.
- Wenxiong Zhang; Yiping Wei; Dongliang Yu; Jianjun Xu; Jinhua Peng; Gefitinib provides similar effectiveness and improved safety than erlotinib for east Asian populations with advanced non–small cell lung cancer: a meta-analysis. BMC Cancer 2018, 18, 780, 10.1186/s12885-018-4685-y.
- William Pao; Vincent Miller; Maureen Zakowski; Jennifer Doherty; Katerina Politi; Inderpal Sarkaria; Bhuvanesh Singh; Robert Heelan; Valerie Rusch; Lucinda Fulton; et al.Elaine MardisDoris KupferRichard WilsonMark KrisHarold Varmus EGF receptor gene mutations are common in lung cancers from "never smokers" and are associated with sensitivity of tumors to gefitinib and erlotinib. Proceedings of the National Academy of Sciences 2004, 101, 13306-13311, 10.1073/pnas.0405220101.
- Keunchil Park; Chong-Jen Yu; Sang-We Kim; Meng-Chih Lin; Virote Sriuranpong; Chun-Ming Tsai; Jong-Seok Lee; Jin-Hyoung Kang; K. C. Allen Chan; Pablo Perez-Moreno; et al.Peter ButtonMyung-Ju AhnTony Mok First-Line Erlotinib Therapy Until and Beyond Response Evaluation Criteria in Solid Tumors Progression in Asian Patients With Epidermal Growth Factor Receptor Mutation–Positive Non–Small-Cell Lung Cancer. JAMA Oncology 2016, 2, 305-8, 10.1001/jamaoncol.2015.4921.
- Mauricio Burotto; Elisabet E. Manasanch; Julia Wilkerson; Tito Fojo; Gefitinib and Erlotinib in Metastatic Non-Small Cell Lung Cancer: A Meta-Analysis of Toxicity and Efficacy of Randomized Clinical Trials. The Oncologist 2015, 20, 400-410, 10.1634/theoncologist.2014-0154.
- Charles N. Prabhakar; Epidermal growth factor receptor in non-small cell lung cancer. Translational Lung Cancer Research 2015, 4, 110-118, 10.3978/j.issn.2218-6751.2015.01.01.
- Naiqing Xu; Wenfeng Fang; Libing Mu; Yanna Tang; Lei Gao; Shengxiang Ren; Dengfeng Cao; Lixin Zhou; Aiqun Zhang; Deruo Liu; et al.Caicun ZhouKwok Kin WongLei YuLi ZhangLiang Chen Overexpression of wildtype EGFR is tumorigenic and denotes a therapeutic target in non-small cell lung cancer. Oncotarget 2015, 7, 3884-3896, 10.18632/oncotarget.6461.
- Rintu Thomas; Zhang Weihua; Rethink of EGFR in Cancer With Its Kinase Independent Function on Board. Frontiers in Oncology 2019, 9, 800, 10.3389/fonc.2019.00800.
- Ukhyun Jo; Kyong Hwa Park; Young Mi Whang; Jae Sook Sung; Nam Hee Won; Jong Kuk Park; Yeul Hong Kim; EGFR endocytosis is a novel therapeutic target in lung cancer with wild-type EGFR. Oncotarget 2014, 5, 1265-1278, 10.18632/oncotarget.1711.
- Lisa Crowley; Brooke J. Marfell; Adrian P. Scott; Nigel J. Waterhouse; Quantitation of Apoptosis and Necrosis by Annexin V Binding, Propidium Iodide Uptake, and Flow Cytometry. Cold Spring Harbor Protocols 2016, 2016, 87288, 10.1101/pdb.prot087288.
- Wenbin Zeng; Xiaobo Wang; Pengfei Xu; Gang Liu; Henry S. Eden; Xiaoyuan Chen; Molecular Imaging of Apoptosis: From Micro to Macro. Theranostics 2015, 5, 559-582, 10.7150/thno.11548.
- Chunxin Wang; Richard J. Youle; The Role of Mitochondria in Apoptosis. Annual Review of Genetics 2009, 43, 95-118, 10.1146/annurev-genet-102108-134850.
- Lindsay J. Shearer; Nils O. Petersen; Distribution and Co-localization of endosome markers in cells. Heliyon 2019, 5, e02375, 10.1016/j.heliyon.2019.e02375.
- Marko Jovic; Mahak Sharma; Juliati Rahajeng; Steve Caplan; The early endosome: a busy sorting station for proteins at the crossroads.. Histol. Histopathol. 2010, 25, 99-112, 10.14670/hh-25.99.
- Fi-Tjen Mu; Judy M. Callaghan; Olivia Steele-Mortimer; Harald Stenmark; Robert G. Parton; Paul L. Campbell; James McCluskey; Jing-Ping Yeo; Edward P.C. Tock; Ban-Hock Toh; et al. EEA1, an Early Endosome-Associated Protein.. Journal of Biological Chemistry 1995, 270, 13503-13511, 10.1074/jbc.270.22.13503.
- Patrick Morley Willoughby; Molly Allen; Jessica Yu; Roman Korytnikov; Tianhui Chen; Yupeng Liu; Isis So; Neil Macpherson; Jennifer A Mitchell; Rodrigo Fernandez-Gonzalez; et al.Ashley Ee Bruce The recycling endosome protein Rab25 coordinates collective cell movements in the zebrafish surface epithelium. eLife 2021, 10, 66060, 10.7554/elife.66060.
- Phillip A. Vanlandingham; Brian P. Ceresa; Rab7 Regulates Late Endocytic Trafficking Downstream of Multivesicular Body Biogenesis and Cargo Sequestration. Journal of Biological Chemistry 2009, 284, 12110-12124, 10.1074/jbc.m809277200.
- Xiu-Tang Cheng; Yu-Xiang Xie; Bing Zhou; Ning Huang; Tamar Farfel-Becker; Zu-Hang Sheng; Revisiting LAMP1 as a marker for degradative autophagy-lysosomal organelles in the nervous system. Autophagy 2018, 14, 1472-1474, 10.1080/15548627.2018.1482147.
- Yukio Nishimura; Biborka Bereczky; Mayumi Ono; The EGFR inhibitor gefitinib suppresses ligand-stimulated endocytosis of EGFR via the early/late endocytic pathway in non-small cell lung cancer cell lines. Histochemistry and Cell Biology 2007, 127, 541-553, 10.1007/s00418-007-0281-y.
- Christopher J. Tynan; David Clarke; Benjamin C. Coles; Daniel Rolfe; Marisa Martin-Fernandez; Stephen E. D. Webb; Multicolour Single Molecule Imaging in Cells with Near Infra-Red Dyes. PLOS ONE 2012, 7, e36265, 10.1371/journal.pone.0036265.
- Christopher G. England; Haiming Luo; Weibo Cai; HaloTag Technology: A Versatile Platform for Biomedical Applications. Bioconjugate Chemistry 2015, 26, 975-986, 10.1021/acs.bioconjchem.5b00191.
- Peter J. Bosch; Ivan Correa; Michael H. Sonntag; Jenny Ibach; Luc Brunsveld; Johannes S. Kanger; Vinod Subramaniam; Evaluation of Fluorophores to Label SNAP-Tag Fused Proteins for Multicolor Single-Molecule Tracking Microscopy in Live Cells. Biophysical Journal 2014, 107, 803-814, 10.1016/j.bpj.2014.06.040.
- Manuela Ecker; Gregory M. I. Redpath; Philip R. Nicovich; Jérémie Rossy; Quantitative visualization of endocytic trafficking through photoactivation of fluorescent proteins. Molecular Biology of the Cell 2021, 32, 892-902, 10.1091/mbc.e20-10-0669.
- M Varella-Garcia; J Diebold; D A Eberhard; K Geenen; A Hirschmann; M Kockx; I Nagelmeier; J Ruschoff; M Schmitt; S Arbogast; et al.Federico Cappuzzo EGFR fluorescence in situ hybridisation assay: guidelines for application to non-small-cell lung cancer. Journal of Clinical Pathology 2009, 62, 970-977, 10.1136/jcp.2009.066548.
- Yukiko Kabeya; Noboru Mizushima; Takashi Ueno; Akitsugu Yamamoto; Takayoshi Kirisako; Takeshi Noda; Eiki Kominami; Yoshinori Ohsumi; Tamotsu Yoshimori; LC3, a mammalian homologue of yeast Apg8p, is localized in autophagosome membranes after processing. The EMBO Journal 2000, 19, 5720-5728, 10.1093/emboj/19.21.5720.
- Steven K Backues; Dachuan Chen; Jishou Ruan; Zhiping Xie; Daniel J Klionsky; Estimating the size and number of autophagic bodies by electron microscopy. Autophagy 2013, 10, 155-164, 10.4161/auto.26856.
- Idil Orhon; Fulvio Reggiori; Assays to Monitor Autophagy Progression in Cell Cultures. Cells 2017, 6, 20, 10.3390/cells6030020.
- Yiyu Zou; Yi-He Ling; Juan Sironi; Edward L. Schwartz; Roman Perez-Soler; Bilal Piperdi; The Autophagy Inhibitor Chloroquine Overcomes the Innate Resistance of Wild-Type EGFR Non-Small-Cell Lung Cancer Cells to Erlotinib. Journal of Thoracic Oncology 2013, 8, 693-702, 10.1097/jto.0b013e31828c7210.
- Mona Bains; Kim A. Heidenreich; Chapter 7 Live‐Cell Imaging of Autophagy Induction and Autophagosome‐Lysosome Fusion in Primary Cultured Neurons. Methods in Enzymology 2009, 453, 145-158, 10.1016/s0076-6879(08)04007-x.
- Sethuraman Sankaranarayanan; Dino De Angelis; James E. Rothman; Timothy A. Ryan; The Use of pHluorins for Optical Measurements of Presynaptic Activity. Biophysical Journal 2000, 79, 2199-2208, 10.1016/s0006-3495(00)76468-x.
- Marisa L. Martin-Fernandez; David T. Clarke; Single Molecule Fluorescence Detection and Tracking in Mammalian Cells: The State-of-the-Art and Future Perspectives. International Journal of Molecular Sciences 2012, 13, 14742-14765, 10.3390/ijms131114742.
- Shalini T Low-Nam; Keith A Lidke; Patrick J Cutler; Rob Roovers; Paul M P Van Bergen En Henegouwen; Bridget S Wilson; Diane S Lidke; ErbB1 dimerization is promoted by domain co-confinement and stabilized by ligand binding. Nature Structural & Molecular Biology 2011, 18, 1244-1249, 10.1038/nsmb.2135.
- Daniel J. Rolfe; Charles I. McLachlan; Michael Hirsch; Sarah R. Needham; Christopher J. Tynan; Stephen E. D. Webb; Marisa L. Martin-Fernandez; Michael P. Hobson; Automated multidimensional single molecule fluorescence microscopy feature detection and tracking. European Biophysics Journal 2011, 40, 1167-1186, 10.1007/s00249-011-0747-7.
- M.L. Martin‐Fernandez; C.J. Tynan; Stephen Webb; A ‘pocket guide’ to total internal reflection fluorescence. Journal of Microscopy 2013, 252, 16-22, 10.1111/jmi.12070.
- Laura Carolina Zanetti-Domingues; Christopher J. Tynan; Daniel Rolfe; David T. Clarke; Marisa Martin-Fernandez; Hydrophobic Fluorescent Probes Introduce Artifacts into Single Molecule Tracking Experiments Due to Non-Specific Binding. PLOS ONE 2013, 8, e74200, 10.1371/journal.pone.0074200.
- Laura C. Zanetti-Domingues; Marisa L. Martin-Fernandez; Sarah R. Needham; Daniel J. Rolfe; David T. Clarke; A Systematic Investigation of Differential Effects of Cell Culture Substrates on the Extent of Artifacts in Single-Molecule Tracking. PLoS ONE 2012, 7, e45655, 10.1371/journal.pone.0045655.
- Cheng Lv; Cai Yang; Ding Ding; Yang Sun; Ruowen Wang; Da Han; Weihong Tan; Endocytic Pathways and Intracellular Transport of Aptamer-Drug Conjugates in Live Cells Monitored by Single-Particle Tracking. Analytical Chemistry 2019, 91, 13818-13823, 10.1021/acs.analchem.9b03281.
- Ignacio Izeddin; Vincent Récamier; Lana Bosanac; Ibrahim I Cissé; Lydia Boudarene; Claire Dugast-Darzacq; Florence Proux; Olivier Bénichou; Raphaël Voituriez; Olivier Bensaude; et al.Maxime DahanXavier Darzacq Single-molecule tracking in live cells reveals distinct target-search strategies of transcription factors in the nucleus. eLife 2014, 3, e02230, 10.7554/elife.02230.
- A. Harootunian; E. Betzig; M. Isaacson; A. Lewis; Super‐resolution fluorescence near‐field scanning optical microscopy. Applied Physics Letters 1986, 49, 674-676, 10.1063/1.97565.
- Carlo Manzo; Thomas S. van Zanten; Maria F. Garcia-Parajo; Nanoscale Fluorescence Correlation Spectroscopy on Intact Living Cell Membranes with NSOM Probes. Biophysical Journal 2011, 100, L8-L10, 10.1016/j.bpj.2010.12.3690.
- Michael J. Rust; Mark Bates; Xiaowei Zhuang; Sub-diffraction-limit imaging by stochastic optical reconstruction microscopy (STORM). Nature Methods 2006, 3, 793-796, 10.1038/nmeth929.
- Lin Wang; Benji Bateman; Laura Carolina Zanetti-Domingues; Amy N. Moores; Sam Astbury; Christopher Spindloe; Michele C. Darrow; Maria Romano; Sarah Needham; Konstantinos Beis; et al.Daniel RolfeDavid T. ClarkeMarisa L. Martin-Fernandez Solid immersion microscopy images cells under cryogenic conditions with 12 nm resolution. Communications Biology 2019, 2, 1-11, 10.1038/s42003-019-0317-6.
- Rajesh Babu Sekar; Ammasi Periasamy; Fluorescence resonance energy transfer (FRET) microscopy imaging of live cell protein localizations. Journal of Cell Biology 2003, 160, 629-633, 10.1083/jcb.200210140.
- Th Foerster; DELOCALIZED EXCITATION AND EXCITATION TRANSFER. Bulletin No. 18. DELOCALIZED EXCITATION AND EXCITATION TRANSFER. Bulletin No. 18 1964, 2, 93-137, 10.2172/4626886.
- Marisa Martin-Fernandez; David T. Clarke; Mark J. Tobin; Samantha V. Jones; Gareth R. Jones; Preformed Oligomeric Epidermal Growth Factor Receptors Undergo an Ectodomain Structure Change during Signaling. Biophysical Journal 2002, 82, 2415-2427, 10.1016/s0006-3495(02)75585-9.
- Tai Kiuchi; Elena Ortiz-Zapater; James Monypenny; Daniel R. Matthews; Lan K. Nguyen; Jody Barbeau; Oana Coban; Katherine Lawler; Brian Burford; Daniel J. Rolfe; et al.Emanuele de RinaldisDimitra DafouMichael A. SimpsonNatalie WoodmanSarah PinderCheryl E. GillettViviane DevaugesSimon P. PolandGilbert FruhwirthPierfrancesco MarraYkelien L. BoersmaAndreas PlückthunWilliam J. GullickYosef YardenGeorge SantisMartyn WinnBoris N. KholodenkoMarisa L. Martin-FernandezPeter ParkerAndrew TuttSimon M. Ameer-BegTony Ng The ErbB4 CYT2 variant protects EGFR from ligand-induced degradation to enhance cancer cell motility. Science Signaling 2014, 7, ra78-ra78, 10.1126/scisignal.2005157.
- Stephen E.D. Webb; Selene K. Roberts; Sarah R. Needham; Christopher J. Tynan; Daniel J. Rolfe; Martyn D. Winn; David T. Clarke; Roger Barraclough; Marisa L. Martin-Fernandez; Single-Molecule Imaging and Fluorescence Lifetime Imaging Microscopy Show Different Structures for High- and Low-Affinity Epidermal Growth Factor Receptors in A431 Cells. Biophysical Journal 2008, 94, 803-819, 10.1529/biophysj.107.112623.
- Stephen Webb; Sarah Needham; S. K. Roberts; Marisa Martin-Fernandez; Multidimensional single-molecule imaging in live cells using total-internal-reflection fluorescence microscopy. Optics Letters 2006, 31, 2157-2159, 10.1364/ol.31.002157.
- Theodorus Gadella; T.M. Jovin; Oligomerization of epidermal growth factor receptors on A431 cells studied by time-resolved fluorescence imaging microscopy. A stereochemical model for tyrosine kinase receptor activation.. Journal of Cell Biology 1995, 129, 1543-1558, 10.1083/jcb.129.6.1543.
- S. E. D. Webb; D. J. Rolfe; S. R. Needham; S. K. Roberts; D. T. Clarke; C. I. McLachlan; M. P. Hobson; M. L. Martin-Fernandez; Simultaneous widefield single molecule orientation and FRET microscopy in cells. Optics Express 2008, 16, 20258-20265, 10.1364/oe.16.020258.
- Christopher J. Tynan; Selene K. Roberts; Daniel J. Rolfe; David T. Clarke; Hannes H. Loeffler; Johannes Kästner; Martyn D. Winn; Peter Parker; Marisa L. Martin-Fernandez; Human Epidermal Growth Factor Receptor (EGFR) Aligned on the Plasma Membrane Adopts Key Features of Drosophila EGFR Asymmetry. Molecular and Cellular Biology 2011, 31, 2241-2252, 10.1128/mcb.01431-10.
- Sarah Needham; Michael Hirsch; Daniel Rolfe; David Clarke; Laura Carolina Zanetti-Domingues; Richard Wareham; Marisa L. Martin-Fernandez; Measuring EGFR Separations on Cells with ∼10 nm Resolution via Fluorophore Localization Imaging with Photobleaching. PLoS ONE 2013, 8, e62331, 10.1371/journal.pone.0062331.
- Laura C. Zanetti-Domingues; Michael Hirsch; Christopher J. Tynan; Daniel J. Rolfe; Teodor V. Boyadzhiev; Kathrin M. Scherer; David T. Clarke; Marisa L. Martin-Fernandez; Sarah R. Needham; Determining the geometry of oligomers of the human epidermal growth factor family on cells with 7 nm resolution. Progress in Biophysics and Molecular Biology 2015, 118, 139-152, 10.1016/j.pbiomolbio.2015.04.002.
- Sarah Needham; Selene K. Roberts; Anton Arkhipov; Venkatesh P. Mysore; Christopher J. Tynan; Laura Carolina Zanetti-Domingues; Eric T. Kim; Valeria Losasso; Dimitris Korovesis; Michael Hirsch; et al.Daniel RolfeDavid ClarkeMartyn D. WinnAlireza LajevardipourAndrew H. A. ClaytonLinda J. PikeMichela PeraniPeter ParkerYibing ShanDavid E. ShawMarisa L. Martin-Fernandez EGFR oligomerization organizes kinase-active dimers into competent signalling platforms. Nature Communications 2016, 7, 13307, 10.1038/ncomms13307.
- Laura Carolina Zanetti-Domingues; Dimitris Korovesis; Sarah Needham; Christopher J. Tynan; Shiori Sagawa; Selene K. Roberts; Antonija Kuzmanic; Elena Ortiz-Zapater; Purvi Jain; Rob C. Roovers; et al.Alireza LajevardipourPaul M. P. Van Bergen En HenegouwenGeorge SantisAndrew H. A. ClaytonDavid T. ClarkeFrancesco L. GervasioYibing ShanDavid E. ShawDaniel RolfePeter ParkerMarisa L. Martin-Fernandez The architecture of EGFR’s basal complexes reveals autoinhibition mechanisms in dimers and oligomers. Nature Communications 2018, 9, 1-17, 10.1038/s41467-018-06632-0.
- Robert Roskoski; The ErbB/HER family of protein-tyrosine kinases and cancer. Pharmacological Research 2014, 79, 34-74, 10.1016/j.phrs.2013.11.002.
- Julian Downward; Yosef Yarden; Elaine L V Mayes; G. Scrace; Nicholas F Totty; Peter A Stockwell; Alexander Ullrich; Joseph Schlessinger; M. D. Waterfield; Close similarity of epidermal growth factor receptor and v-erb-B oncogene protein sequences. Nature 1984, 307, 521-527, 10.1038/307521a0.
- Axel Ullrich; Lisa M Coussens; J. S. Hayflick; T. J. Dull; Andrew T Gray; A. W. Tam; Joohyung Lee; Yosef Yarden; Towia Libermann; J. Schlessinger; et al.Julian DownwardElaine L V MayesNigel WhittleM. D. WaterfieldPeter H Seeburg Human epidermal growth factor receptor cDNA sequence and aberrant expression of the amplified gene in A431 epidermoid carcinoma cells. Nature 1984, 309, 418-425, 10.1038/309418a0.
- Jianchun Chen; Fenghua Zeng; Steven J. Forrester; Satoru Eguchi; Ming-Zhi Zhang; Raymond C. Harris; Expression and Function of the Epidermal Growth Factor Receptor in Physiology and Disease. Physiological Reviews 2016, 96, 1025-1069, 10.1152/physrev.00030.2015.
- Erika Kovacs; Julie Anne Zorn; Yongjian Huang; Tiago Barros; John Kuriyan; A Structural Perspective on the Regulation of the Epidermal Growth Factor Receptor. Annual Review of Biochemistry 2015, 84, 739-764, 10.1146/annurev-biochem-060614-034402.
- Bhuminder Singh; Graham Carpenter; Robert J. Coffey; EGF receptor ligands: recent advances. F1000Research 2016, 5, 2270, 10.12688/f1000research.9025.1.
- Kathryn M Ferguson; Mitchell Berger; Jeannine M Mendrola; Hyun-Soo Cho; Daniel J Leahy; Mark A Lemmon; EGF Activates Its Receptor by Removing Interactions that Autoinhibit Ectodomain Dimerization. Molecular Cell 2003, 11, 507-517, 10.1016/s1097-2765(03)00047-9.
- Hideo Ogiso; Ryuichiro Ishitani; Osamu Nureki; Shuya Fukai; Mari Yamanaka; Jae-Hoon Kim; Kazuki Saito; Ayako Sakamoto; Mio Inoue; Mikako Shirouzu; et al.Shigeyuki Yokoyama Crystal Structure of the Complex of Human Epidermal Growth Factor and Receptor Extracellular Domains. Cell 2002, 110, 775-787, 10.1016/s0092-8674(02)00963-7.
- Thomas P.J. Garrett; Neil M. McKern; Meizhen Lou; Thomas C. Elleman; Timothy Adams; George O. Lovrecz; Hong-Jian Zhu; Francesca Walker; Morry J. Frenkel; Peter A. Hoyne; et al.Robert JorissenEdouard C. NiceAntony W. BurgessColin W. Ward Crystal Structure of a Truncated Epidermal Growth Factor Receptor Extracellular Domain Bound to Transforming Growth Factor α. Cell 2002, 110, 763-773, 10.1016/s0092-8674(02)00940-6.
- Xuewu Zhang; Jodi Gureasko; Kui Shen; Philip A. Cole; John Kuriyan; An Allosteric Mechanism for Activation of the Kinase Domain of Epidermal Growth Factor Receptor. Cell 2006, 125, 1137-1149, 10.1016/j.cell.2006.05.013.
- Axel Ullrich; Joseph Schlessinger; Signal transduction by receptors with tyrosine kinase activity. Cell 1990, 61, 203-212, 10.1016/0092-8674(90)90801-k.
- Aaron J. Cantor; Neel H. Shah; John Kuriyan; Deep mutational analysis reveals functional trade-offs in the sequences of EGFR autophosphorylation sites. Proceedings of the National Academy of Sciences 2018, 115, E7303-E7312, 10.1073/pnas.1803598115.
- Nicholas F. Endres; Rahul Das; Adam W. Smith; Anton Arkhipov; Erika Kovacs; Yongjian Huang; Jeffrey G. Pelton; Yibing Shan; David E. Shaw; David E. Wemmer; et al.Jay T. GrovesJohn Kuriyan Conformational Coupling across the Plasma Membrane in Activation of the EGF Receptor. Cell 2013, 152, 543-556, 10.1016/j.cell.2012.12.032.
- Ping Wee; Zhixiang Wang; Epidermal Growth Factor Receptor Cell Proliferation Signaling Pathways. Cancers 2017, 9, 52, 10.3390/cancers9050052.
- A G Batzer; D Rotin; J M Ureña; E Y Skolnik; J Schlessinger; Hierarchy of binding sites for Grb2 and Shc on the epidermal growth factor receptor. Molecular and Cellular Biology 1994, 14, 5192-5201, 10.1128/mcb.14.8.5192-5201.1994.
- Julian R. Molina; Alex A. Adjei; The Ras/Raf/MAPK Pathway. Journal of Thoracic Oncology 2006, 1, 7-9, 10.1016/s1556-0864(15)31506-9.
- Malcolm Whitman; C. Peter Downes; Marilyn Keeler; Tracy Keller; Lewis Cantley; Type I phosphatidylinositol kinase makes a novel inositol phospholipid, phosphatidylinositol-3-phosphate. Nature 1988, 332, 644-646, 10.1038/332644a0.
- Camillo Porta; Chiara Paglino; Alessandra Mosca; Targeting PI3K/Akt/mTOR Signaling in Cancer. Frontiers in Oncology 2014, 4, 64, 10.3389/fonc.2014.00064.
- Abdul Alim Al‐Bari; Pingyong Xu; Molecular regulation of autophagy machinery by mTOR‐dependent and ‐independent pathways. Annals of the New York Academy of Sciences 2020, 1467, 3-20, 10.1111/nyas.14305.
- Emira Bousoik; Hamidreza Montazeri Aliabadi; “Do We Know Jack” About JAK? A Closer Look at JAK/STAT Signaling Pathway. Frontiers in Oncology 2018, 8, 287, 10.3389/fonc.2018.00287.
- Byung Min Chung; Manjari Dimri; Manju George; Alagarsamy Lakku Reddi; Gengsheng Chen; Vimla Band; Hamid Band; The role of cooperativity with Src in oncogenic transformation mediated by non-small cell lung cancer-associated EGF receptor mutants. Oncogene 2009, 28, 1821-1832, 10.1038/onc.2009.31.
- Jie Zhang; Shailaja Kalyankrishna; Marie Wislez; Nishan Thilaganathan; Babita Saigal; Wei Wei; Long Ma; Ignacio I. Wistuba; Faye M. Johnson; Jonathan M. Kurie; et al. Src-Family Kinases Are Activated in Non-Small Cell Lung Cancer and Promote the Survival of Epidermal Growth Factor Receptor-Dependent Cell Lines. The American Journal of Pathology 2007, 170, 366-376, 10.2353/ajpath.2007.060706.
- Daijiro Harada; Nagio Takigawa; Katsuyuki Kiura; The Role of STAT3 in Non-Small Cell Lung Cancer. Cancers 2014, 6, 708-722, 10.3390/cancers6020708.
- Tatiana V. Denisenko; Inna N. Budkevich; Boris Zhivotovsky; Cell death-based treatment of lung adenocarcinoma. Cell Death & Disease 2018, 9, 1-14, 10.1038/s41419-017-0063-y.
- Gee-Chen Chang; Chang-Tze Ricky Yu; Ching-Hwa Tsai; Jia-Rong Tsai; Jen-Chi Chen; Chun-Chi Wu; Wen-Jun Wu; Shih-Lan Hsu; An epidermal growth factor inhibitor, Gefitinib, induces apoptosis through a p53-dependent upregulation of pro-apoptotic molecules and downregulation of anti-apoptotic molecules in human lung adenocarcinoma A549 cells. European Journal of Pharmacology 2008, 600, 37-44, 10.1016/j.ejphar.2008.10.024.
- Justin Kale; Elizabeth J Osterlund; David Andrews; BCL-2 family proteins: changing partners in the dance towards death. Cell Death & Differentiation 2017, 25, 65-80, 10.1038/cdd.2017.186.
- Susan Elmore; Apoptosis: A Review of Programmed Cell Death. Toxicologic Pathology 2007, 35, 495-516, 10.1080/01926230701320337.
- Daniel Costa; Balázs Halmos; Amit Kumar; Susan T Schumer; Mark S Huberman; Titus J Boggon; Daniel Tenen; Susumu Kobayashi; BIM Mediates EGFR Tyrosine Kinase Inhibitor-Induced Apoptosis in Lung Cancers with Oncogenic EGFR Mutations. PLoS Medicine 2007, 4, e315, 10.1371/journal.pmed.0040315.
- Kuicheon Choi; Chad J. Creighton; David Stivers; Nobukazu Fujimoto; Jonathan M. Kurie; Transcriptional Profiling of Non-Small Cell Lung Cancer Cells with Activating EGFR Somatic Mutations. PLOS ONE 2007, 2, e1226, 10.1371/journal.pone.0001226.
- Sara Simonetti; Miguel Angel Molina; Cristina Queralt; Itziar de Aguirre; Clara Mayo; Jordi Bertran-Alamillo; José Javier Sanchez; Jose Luis Gonzalez-Larriba; Ulpiano Jimenez; Dolores Isla; et al.Teresa MoranSantiago ViteriCarlos CampsRosario Garcia-CampeloBartomeu MassutiSusana BenllochSantiago Ramon Y CajalMiquel TaronRafael Rosell Detection of EGFR mutations with mutation-specific antibodies in stage IV non-small-cell lung cancer. Journal of Translational Medicine 2010, 8, 135-135, 10.1186/1479-5876-8-135.
- Kunio Okamoto; Isamu Okamoto; Wataru Okamoto; Kaoru Tanaka; Ken Takezawa; Kiyoko Kuwata; Haruka Yamaguchi; Kazuto Nishio; Kazuhiko Nakagawa; Role of Survivin in EGFR Inhibitor–Induced Apoptosis in Non–Small Cell Lung Cancers Positive for EGFR Mutations. Cancer Research 2010, 70, 10402-10410, 10.1158/0008-5472.can-10-2438.
- Dana Westphal; Ruth Kluck; Grant Dewson; Building blocks of the apoptotic pore: how Bax and Bak are activated and oligomerize during apoptosis. Cell Death & Differentiation 2013, 21, 196-205, 10.1038/cdd.2013.139.
- Halime Kalkavan; Douglas Green; MOMP, cell suicide as a BCL-2 family business. Cell Death & Differentiation 2017, 25, 46-55, 10.1038/cdd.2017.179.
- Margaret Maes; Cassandra L. Schlamp; Robert W. Nickells; Live-cell imaging to measure BAX recruitment kinetics to mitochondria during apoptosis. PLOS ONE 2017, 12, e0184434, 10.1371/journal.pone.0184434.
- E Lomonosova; G Chinnadurai; BH3-only proteins in apoptosis and beyond: an overview. Oncogene 2008, 27, S2-S19, 10.1038/onc.2009.39.
- Xuejun Jiang; Xiaodong Wang; Cytochrome c Promotes Caspase-9 Activation by Inducing Nucleotide Binding to Apaf-1. Journal of Biological Chemistry 2000, 275, 31199-31203, 10.1074/jbc.c000405200.
- Elizabeth A. Slee; Colin Adrain; Seamus Martin; Executioner Caspase-3, -6, and -7 Perform Distinct, Non-redundant Roles during the Demolition Phase of Apoptosis. Journal of Biological Chemistry 2001, 276, 7320-7326, 10.1074/jbc.m008363200.
- Yuxin Lin; Xian Wang; Hongchuan Jin; EGFR-TKI resistance in NSCLC patients: mechanisms and strategies.. American journal of cancer research 2014, 4, 411-35.
- Cai-Hong Yun; Kristen E. Mengwasser; Angela V. Toms; Michele S. Woo; Heidi Greulich; Kwok Kin Wong; Matthew Meyerson; Michael J. Eck; The T790M mutation in EGFR kinase causes drug resistance by increasing the affinity for ATP. Proceedings of the National Academy of Sciences 2008, 105, 2070-2075, 10.1073/pnas.0709662105.
- Riyaz Shah; Jason F. Lester; Tyrosine Kinase Inhibitors for the Treatment of EGFR Mutation-Positive Non–Small-Cell Lung Cancer: A Clash of the Generations. Clinical Lung Cancer 2019, 21, e216-e228, 10.1016/j.cllc.2019.12.003.
- Jacqulyne P. Robichaux; Xiuning Le; R. S. K. Vijayan; J. Kevin Hicks; Simon Heeke; Yasir Y. Elamin; Heather Y. Lin; Hibiki Udagawa; Ferdinandos Skoulidis; Hai Tran; et al.Susan VargheseJunqin HeFahao ZhangMonique B. NilssonLemei HuAlissa PoteeteWaree RinsurongkawongXiaoshan ZhangChenghui RenXiaoke LiuLingzhi HongJianjun ZhangLixia DiaoRussell MadisonAlexa B. SchrockJennifer SaamVictoria RaymondBingliang FangJing WangMin Jin HaJason B. CrossJhanelle E. GrayJohn V. Heymach Structure-based classification predicts drug response in EGFR-mutant NSCLC. Nature 2021, 597, 732-737, 10.1038/s41586-021-03898-1.
- Elza C. de Bruin; Nicholas McGranahan; Richard Mitter; Max Salm; David C. Wedge; Lucy Yates; Mariam Jamal-Hanjani; Seema Shafi; Nirupa Murugaesu; Andrew J. Rowan; et al.Eva GrönroosMadiha A. MuhammadStuart HorswellMarco GerlingerIgnacio VarelaDavid JonesJohn MarshallThierry VoetPeter Van LooDoris M. RasslRobert C. RintoulSam M. JanesSiow-Ming LeeMartin ForsterTanya AhmadDavid LawrenceMary FalzonArrigo CapitanioTimothy T. HarkinsClarence C. LeeWarren TomEnock TeefeShann-Ching ChenSharmin BegumAdam RabinowitzBenjamin PhillimoreBradley Spencer-DeneGordon StampZoltan SzallasiNik MatthewsAengus StewartPeter CampbellCharles Swanton Spatial and temporal diversity in genomic instability processes defines lung cancer evolution. Science 2014, 346, 251-256, 10.1126/science.1253462.
- Peijie Wu; Wei Gao; Miao Su; Edouard C. Nice; Wenhui Zhang; Jie Lin; Na Xie; Adaptive Mechanisms of Tumor Therapy Resistance Driven by Tumor Microenvironment. Frontiers in Cell and Developmental Biology 2021, 9, 641469, 10.3389/fcell.2021.641469.
- K. J. Coker; J. V. Staros; C. A. Guyer; A kinase-negative epidermal growth factor receptor that retains the capacity to stimulate DNA synthesis.. Proceedings of the National Academy of Sciences 1994, 91, 6967-6971, 10.1073/pnas.91.15.6967.
- E R Eldredge; G M Korf; T A Christensen; D C Connolly; M J Getz; N J Maihle; Activation of c-fos gene expression by a kinase-deficient epidermal growth factor receptor. Molecular and Cellular Biology 1994, 14, 7527-7534, 10.1128/mcb.14.11.7527-7534.1994.
- Lorenzo Galluzzi; Federico Pietrocola; Jose Manuel Bravo-San Pedro; Ravi K Amaravadi; Eric H Baehrecke; Francesco Cecconi; Patrice Codogno; Jayanta Debnath; David A Gewirtz; Vassiliki Karantza; et al.Alec KimmelmanSharad KumarBeth LevineMaria Chiara MaiuriSeamus MartinJosef PenningerMauro PiacentiniDavid C RubinszteinHans-Uwe SimonAnne SimonsenAndrew M ThorburnGuillermo VelascoKevin M. RyanGuido Kroemer Autophagy in malignant transformation and cancer progression. The EMBO Journal 2015, 34, 856-880, 10.15252/embj.201490784.
More
Information
Subjects:
Pathology
Contributor
MDPI registered users' name will be linked to their SciProfiles pages. To register with us, please refer to https://encyclopedia.pub/register
:
View Times:
1.4K
Revisions:
6 times
(View History)
Update Date:
28 Feb 2022
Table of Contents


Notice
You are not a member of the advisory board for this topic. If you want to update advisory board member profile, please contact office@encyclopedia.pub.
OK
Confirm
Only members of the Encyclopedia advisory board for this topic are allowed to note entries. Would you like to become an advisory board member of the Encyclopedia?
Yes
No
${ textCharacter }/${ maxCharacter }
Submit
Cancel
Back
Comments
${ item }
|
${ item.createdUser.fullName }
${ item.createdAt }
${ item.vote }
${ item.reply }
Delete
${ reply.createdUser.fullName }
${ reply.createdAt }
${ reply.vote }
Delete
There is no reply to this comment~
${ item.replyTextCharacter }/${ item.replyMaxCharacter }
Submit
Cancel
More
No more~
There is no comment~
${ textCharacter }/${ maxCharacter }
Submit
Cancel
${ selectedItem.replyTextCharacter }/${ selectedItem.replyMaxCharacter }
Submit
Cancel
Confirm
Are you sure to Delete?
Yes
No