This entry focused on the impact of the treatment with the hypomethylating agent 5-azacitidine on the redox status and inflammation in 24 MDS patients. Globally, MDS patients showed less redox status in terms of a reduction in the GSSG/GSH ratio and in the LPO levels, as well as increased CAT activity compared with healthy subjects, with no changes in SOD, GPx, and GRd activities, or AOPP levels. When analyzing the evolution from early to advanced stages of the disease, we found that the GPx activity, GSSG/GSH ratio, LPO, and AOPP increased, with a reduction in CAT. GPx changes were related to the presence of risk factors such as high-risk IPSS-R or mutational score. Moreover, there was an increase in IL-2, IL-6, IL-8, and TNF-α plasma levels, with a further increase of IL-2 and IL-10 from early to advanced stages of the disease. However, we did not observe any association between inflammation and oxidative stress.
1. Introduction
Myelodysplastic syndromes (MDS) are a heterogeneous group of clonal hematological disorders clinically characterized by the presence of peripheral blood cytopenias, dysplasia in myeloid lineages, and ineffective hematopoiesis, with a high rate of conversion to acute myeloid leukemia (AML). The annual incidence of the disease is 4–5 cases per 100,000, with an increase of the incidence in individuals age 70 years (30 per 100,000)
[1][2].
Currently, factors that determining MDS etiology and its progression to AML are not clarified; however, several authors suggest tumor genetic alterations in genes that regulate cellular proliferation, survival, and differentiation on hematopoietic stem cell
[3]. In this line, complex karyotypes and somatic mutations associated with molecular risk are important risk factors related to advances stages of the disease and progression to AML
[4][5]. On the other hand, there is considerable evidence that immunity has also be implicated in the pathogenesis of MDS. Recent investigations have identified immunological factors that impair immune surveillance and contribute to clonal immune escape. Related to this, changes affecting the immunogenicity of the CD34+ cell, and a dysregulation of the cellular immune response in the tumor microenvironment, have been observed
[6][7].
On the basis of this heterogeneity of factors, clinical course and survival rate of MDS patients is highly variable. Several valuable markers define risk groups and candidates for targeted treatment approaches. The current score system, the Revised International Prognostic Scoring System (R-IPSS), divides patients into several risk prognostic categories
[8]. In this line, therapies in low-risk patients consist in blood product transfusions and growth factor treatments while higher-risk patients are treated with hypomethylating agents such us 5-azacitidine (5-AZA)
[9].
The evidence that oxidative stress participates in the development and progression of a wide variety of hematological neoplasms is increasing. Leukemic cells are known to live under oxidative stress conditions and they acquire multiple mechanisms to protect themselves from stress, including the induction of antioxidant and detoxifying enzymes
[10]. It has been observed that reactive oxygen species (ROS) suppress self-renewal hematopoietic stem cells, which was related to myelodysplasia and ineffective hematopoiesis
[11][12]. With regard to MDS, these findings suggested that the excess of ROS could participate not only in the DNA, protein, and lipid oxidative damage, but also in the pathogenesis and drug resistance. In addition, ROS excess induces cytokine imbalance in favor of pro-inflammatory cytokines through NF-κB activation pathway
[13], which may support genomic instability and dysplasia of bone marrow precursors, as has been observed in a murine model of MDS
[14]. Although several authors have reported the presence of oxidative stress with an upregulation of ROS levels, they have not evaluated the global endogenous antioxidant defense system, and they only have focused on isolated measurement of some biomarkers related to the cellular redox metabolism
[15][16][17]. For this reason, in the present study, we carried out a complete evaluation of the entire endogenous antioxidant system by the evaluation of antioxidant defense molecules (disulfide glutathione, GSSG, and glutathione, GSH), the enzymes involved in this defense (superoxide dismutase, SOD; catalase, CAT; glutathione reductase, GRd; and glutathione peroxidase, GPx), and markers of oxidative damage (lipid peroxidation, LPO, and advanced oxidation protein products, AOPP). Additionally, we also evaluated the inflammatory profile expression through the determination of pro-inflammatory cytokines, metabolites of nitric oxide (nitrite plus nitrate), and coenzyme Q10 (CoQ10) plasma levels. In addition, we evaluated for the first time the possible impact of the hypomethylating agent 5-AZA treatment on oxidative stress in MDS patients. Simultaneously, high-risk molecular factors (karyotyes and/or genetic mutations) were analyzed in order to find a possible interplay between them.
2. An Improvement of Oxidative Status Was Observed in Untreated MDS Patients
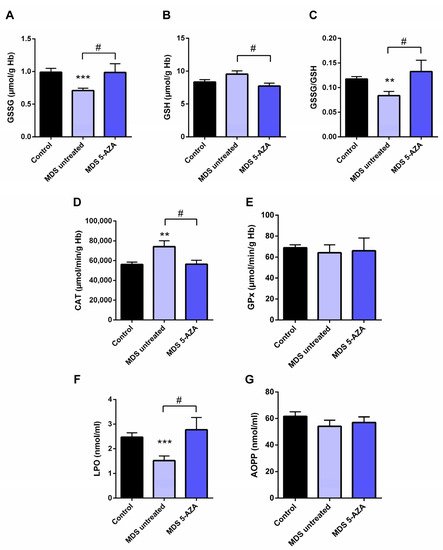
The characterization of intracellular oxidative level from untreated MDS patients (n = 19) was carried out in the erythrocyte fraction by the evaluation of the antioxidant glutathion and antioxidant enzymes. Firstly, a significant lower of GSSG levels (p < 0.001) and GSSG·GSH−1 ratio (p < 0.01) were observed in untreated MDS patients compared to healthy controls (Figure 1A,C). The reduced GSSG·GSH−1 ratio was mostly attributable to changes in the GSSG fraction, while intracellular GSH levels were slightly greater (Figure 1B). However, total intracellular glutathione content (GSH + GSSG) did not differ in MDS patients with respect to the control group.
Figure 1. Analysis of erythrocyte and plasmatic oxidative stress parameters in myelodysplastic syndrome (MDS) patients and controls. MDS patients were divided at diagnosis or only with supportive care (untreated MDS) or MDS patients treated with 5-azacitidine (5-AZA MDS). The following oxidative stress levels are represented: (A) erythrocyte levels of oxidized glutathione (GSSG); (B) reduced glutathione (GSH); (C) GSSG·GSH−1 ratio; (D) catalase (CAT) and (E) glutathione peroxidase (GPx) activity; (F) lipid peroxidation (LPO) and (G) advanced oxidation protein products (AOPP) plasma levels. Data are presented as mean ± SEM. ** p < 0.01, *** p < 0.001 vs. control; # p < 0.05 vs. 5-AZA MDS group.
In relation to the antioxidant enzymes, we observed a markedly increase CAT activity compared to controls (p < 0.01) (Figure 1D). The rest of the enzymatic activities, GPx (Figure 1E), GRd, and SOD (data not shown), were similar in MDS patients and in controls
Moreover, we evaluated the extracellular oxidative status by the analysis of LPO and AOPP plasma levels. Compared to the control group, MDS patients had a significant decreased of LPO levels (p < 0.001) (Figure 1F); however, AOPP levels did not differ between both groups (Figure 1G).
3. Azacitidine Increased Oxidative Stress in MDS Patients
Firstly, we studied whether 5-AZA treatment might affect the oxidative status in MDS patients. Compared to the untreated MDS group, we observed that the 5-AZA group (n = 8)increased the erythrocyte GSSG·GSH−1 ratio that was mainly dependent of the levels of GSSG, reaching similar values to the control group (Figure 1A,C), and a reduction in the GSH levels (Figure 1B) in these group of patients (p < 0.05). However, we did not observe significant differences in the enzyme activities of the glutathione redox cycle GPx (Figure 1E) and GRd (data not shown) between the 5-AZA and MDS groups. On the other hand, there was a markedly reduced activity of CAT in the 5-AZA group compared to untreated MDS patients (Figure 1D) (p < 0.05), showing similar values to the controls. Regarding oxidative markers, LPO values increased twice in the 5-AZA group compared to untreated MDS patients (p < 0.05), reaching similar LPO values to controls (Figure 1F). AOPP levels, however, were similar in both untreated and 5 AZA treated groups (Figure 1G).
4. An Inflammatory Cytokine Microenvironment Was Observed in MDS Patients
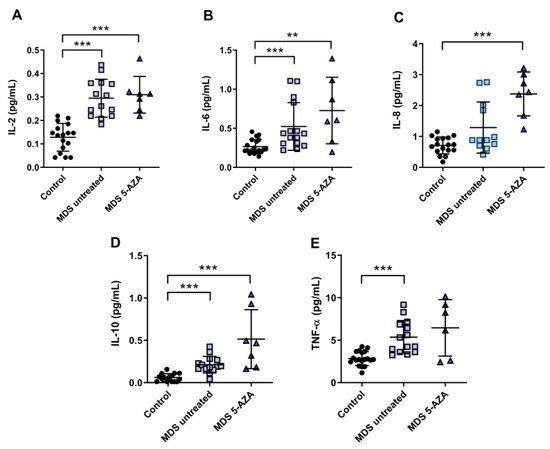
It is known that MDS etiology is somewhat related to the interaction between hematopoietic stem cell and their microenvironment. Inflammation is thought to promote tumor development and progression through cytokines, chemokines, and growth factors. In this line, we evaluated the inflammatory microenvironment in 22 peripheral blood samples from MDS patients (untreated MDS (n = 15); 5-AZA group (n = 7)) through the analysis of pro-inflammatory cytokines, metabolites of NO, and CoQ10 plasma levels. The levels of IL-2, IL-6, and TNF-α were significantly increased in untreated MSD compared to the control group (p < 0.001) (Figure 2A,B,E). No significant differences, however, were observed in IL-1β, IL-8, and INF-ɣ levels between untreated MDS group and controls. The anti-inflammatory IL-10 levels increased in untreated MDS patients compared to the control group (p < 0.001) (Figure 2D).
Figure 2. Concentration of pro- and anti-inflammatory cytokines in plasma samples from myelodysplastic syndrome (MDS) patients. (A) IL-2, (B) IL-6, (C) IL-8, (D) IL-10 and (E) TNF-α plasma concentration of MDS patients at diagnosis or with supportive care (untreated MDS) and MDS patients treated with 5-azacitidine (5-AZA MDS). Data are presented as mean ± SEM. ** p < 0.01, *** p < 0.001 vs. control.
Because 5-AZA treatment increases oxidative stress in MSD patients, we asked whether 5-AZA could also induce a pro-inflammatory response. Our results, however, show that although IL-8 levels increased in the 5-AZA group compared to untreated MSD patients (Figure 2C), most of the cytokine levels studied were similar in untreated MDS patients and 5-AZA-treated ones, discarding this hypothesis (Figure 2A,B,D,E). Finally, IL-4 and GM-CSF levels, which were also measured in plasma, were undetectable in MSD patients.
Regarding NOx, we found a significant decrease in plasma of untreated MDS patients and 5-AZA group compared to controls (p < 0.05). However, we did not find significant differences between untreated and 5-AZA patients. On the other hand, plasma CoQ10 concentration decreased in untreated MDS group compared to controls (p < 0.05), but no differences were detected in CoQ10 levels in untreated MDS and 5 AZA groups.
5. Redox Balance in MDS Patients during Disease Progression
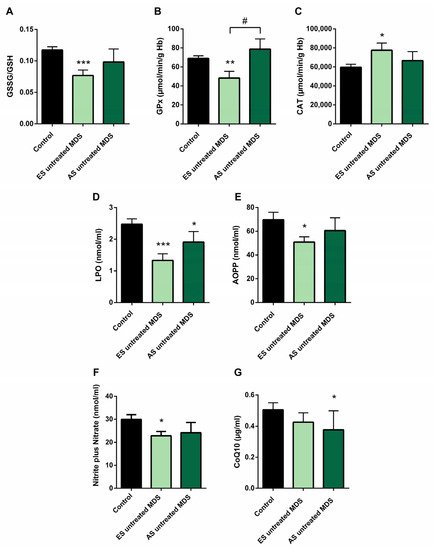
In order to explore if the changes observed in the redox balance and oxidative status from untreated MDS patients are conserved during the disease progression, we categorized the MDS patient group according to the recent WHO classification, as early stage (ES) (n = 13) or advanced stage (AS) (n = 6) of the disease. We observed that changes observed in balance redox and antioxidant system defense described above in the MDS group took place from the ES of the disease. In the ES MDS phase, we observed a marked decrease in GSSG levels (p < 0.01) with an inversion of the GSSG·GSH−1 ratio (p < 0.001) compared to controls (Figure 3A), a significant increase in CAT activity (p < 0.05) (Figure 3C), and a decrease in LPO and AOPP levels (p < 0.001, p < 0.05; respectively) (Figure 3D,E). However, as the disease progressed, the GSSG·GSH−1 erythrocyte ratio did not differ between both stages of the disease but tended to increase in the advanced stage. Total glutathione levels did not differ between the different phases of the disease.
Figure 3. Oxidative stress biomarkers during myelodysplastic syndrome (MDS) progression. (A) erythrocyte GSSG·GSH−1 ratio; (B) glutathione peroxidase (GPx) and (C) catalase (CAT) activities; (D) lipid peroxidation (LPO); (E) advanced oxidation protein products (AOPP); (F) nitrite plus nitrate; and (G) CoQ10 levels in plasma in early stage (ES untreated MDS) vs. advanced stage of untreated MDS patients (AS untreated MDS). Data are presented as mean ± SEM. * p < 0.05, ** p < 0.01, *** p < 0.001 vs. control; # p < 0.05 vs. ES untreated MDS group.
On the other hand, although we did not previously observe any difference in GPx activity in untreated MDS patients with respect to the control group, we highlight the notable decrease in GPx activity in the early stages of the disease compared to controls (p < 0.01); however, this activity increased markedly in the AS with respect to the early stage (p < 0.05) (Figure 3B), obtaining values similar to the control group. By contrast, we did not observe differences in the rest of the oxidative enzymes (CAT, SOD, GRd) between both stages of MSD progression. Finally, LPO and AOPP tended to increase in AS of the disease, although they were not significant (Figure 3D,E).
6. Cytokine Profile Expression in MDS Patients Was Maintained during Disease Progression
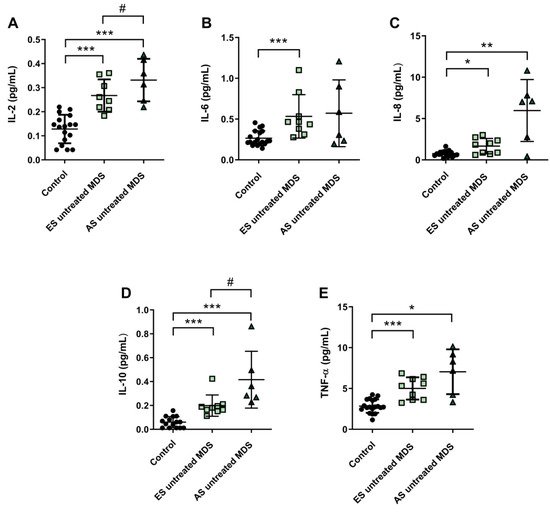
Cytokine profile was also analyzed in ES (n = 9) and AS (n = 6) groups of MSD patients. We observed that IL-2, IL-6, and IL-8 plasma concentration were increased in the ES of the disease with respect to the control group (p < 0.001, p < 0.001, p < 0.05; respectively) (Figure 4A–C); however, while plasma levels of IL-6 and IL-8 cytokines were maintained during the progression of the disease, IL-2 values increased in the AS compared to the early stage (p < 0.05) (Figure 4A). No significant differences were observed in the pro-inflammatory cytokines IL-1β and INF-ɣ between both stages of the disease. Regarding IL-10 and TNF-α levels, we observed an increase in the ES compared to controls (p < 0.001) (Figure 4D,E). Furthermore, immunosuppressive IL-10 was higher in the AS compared to the early stage (p < 0.05) (Figure 4D).
Figure 4. Concentration of pro- and anti-inflammatory cytokines during myelodysplastic syndrome (MDS) progression. (A) IL-2, (B) IL-6, (C) IL-8, (D) IL-10 and (E) TNF-α plasma concentration in early stage (ES untreated MDS) vs. advanced stage (AS untreated MDS) from untreated MDS patients. * p < 0.05, ** p < 0.01, *** p < 0.001 vs. control; # p < 0.05 vs. ES untreated MDS group.
We found decreased in plasma levels of NOx in the ES of untreated MDS compared to controls (p < 0.05) (Figure 3F). However, we did not find significant differences between both stages of the disease. In relation to CoQ10, we did not observe differences in its plasma levels between the early and advanced stages of MSD (Figure 3G). Finally, in order to evaluate if it could exit a possible interplay between inflammation and oxidative stress in MDS patients, we analyzed all these factors in untreated MDS group, and we did not observe any association between them.
7. Oxidative Stress and Risk Prognostic Factors in MDS Patients
We also studied if there was any relationship between the oxidative stress parameters studied and some clinical biological characteristics of MDS patients, including IPSS-R score, karyotype, and mutational profile. For this evaluation, untreated MDS patients were divided into two groups according different categories: high (n = 9) vs. low (n = 10) IPSS-R risk; cytogenetic risk (favorable (good karyotypes) (n = 13) vs. unfavorable (intermediate, poor, and very poor karyotypes) (n = 6); molecular risk: high risk (presence of at least one mutation in any of high molecular risk (HMR) genes) (n = 11) vs. low risk (absence of mutations in HMR genes) (n = 8), and mutational score (number of total mutations present in the dysplastic clone (≤2 (n = 13) vs. >3 (n = 5) total mutations)).
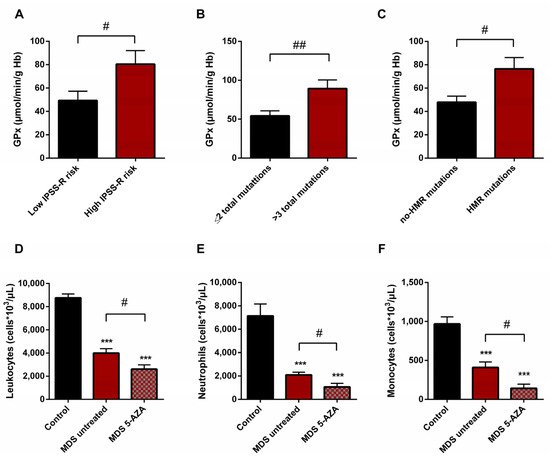
On the basis of the IPSS-R prognostic stratification, we observed that MDS patients with a high risk of progression to AML presented higher values of GPx activity (p < 0.05) (Figure 5A) with a significant decrease in CAT activity (p < 0.05) compared to low-risk MDS categories. Similarly, we observed the increase in GPx activity when MDS patients were divided in relation to the score mutational, observing an increase in GPx activity in patients with a high number of total mutations (>3 total mutations) (p < 0.01) (Figure 5B) and with an increase in LPO values (p < 0.05) with respect to those with low mutational score (≤2 total mutations). In addition, we observed a positive correlation between LPO and number of total mutations (r = 0.594) (p < 0.01). Next, when we categorized MDS patients in relation to molecular risk, we also found an increase in GPx activity in the group of patients that presented high risk compared to those who did not present HMR mutations (p < 0.05) (Figure 5C). However, when we analyzed oxidative parameters on the basis of cytogenetic risk, we did not find significant differences between both established groups.
Figure 5. Risk prognostic factors and leucocyte populations in MDS patients. GPx activity in untreated MDS patients according to (A) IPSS-R score, (B) mutational score and (C) molecular risk. (D) Leucocyte populations, (E) neutrophils and (F) monocytes in untreated MDS patients and 5-AZA group. # p < 0.05, ## p < 0.01; *** p < 0.001 vs. control.
8. Leukocyte Populations in Peripheral Blood of MDS Patients
A significantly lower absolute leukocyte count was observed in untreated MDS patients than in healthy controls (p < 0.001) (Figure 5D). In relation to leukocyte populations, neutrophil, monocyte, and lymphocyte counts were also decreased (p < 0.001) (Figure 5E,F). On the other hand, relating to 5-AZA group, we observed a significantly lower level of absolute leukocyte count in peripheral blood samples compared to untreated MDS patients (p < 0.05) (Figure 5D). The myeloid lineage was altered, with a significantly lower level of absolute neutrophils and monocyte counts (p < 0.05) (Figure 5E,F); however, lymphoid lineage cells (absolute lymphocyte count) did not differ significantly between untreated MDS and 5-AZA group.
 +1 credit