 +1 credit
| Version | Summary | Created by | Modification | Content Size | Created at | Operation |
|---|---|---|---|---|---|---|
| 1 | René Parra | + 3183 word(s) | 3183 | 2020-08-20 05:37:33 | | | |
| 2 | Rita Xu | -815 word(s) | 2368 | 2020-08-21 03:39:05 | | |
Video Upload Options
Since April of 2015, the ash dispersion and ash fallout due to Vulcanian eruptions at Tungurahua, one of the most active volcanoes in Ecuador, have been forecasted daily. For this purpose, our forecasting system uses the meteorological Weather Research and Forecasting (WRF) and the FALL3D models. Previously, and based on field data, laboratory, and numerical studies, corresponding eruption source parameters (ESP) have been defined. We analyzed the historically forecasted results of the ash fallout quantities over four years (April 2015 to March 2019), in order to obtain the average isomass and probability maps for three-month periods: February–March–April (FMA), May–June–July (MJJ), August–September–October (ASO), and November–December–January (NDJ). Our results indicate similar ash fallout shapes during MJJ and ASO, with a clear and defined tendency toward the west of the volcano; this tendency is less defined during NDJ and FMA. The proximal region west of the volcano (about 100 km to the west) has the highest probability (>70%) of being affected by ash fallout. The distant region to the west (more than 100 km west) presented low to medium probabilities (10%–70%) of ash fallout. The cities of Guaranda (W, 60% to 90%), Riobamba (SW, 70%), and Ambato (NW, 50% to 60%) have the highest probabilities of being affected by ash fallout. Among the large Ecuadorian cities, Guayaquil (SW, 10% to 30%) has low probability, and Quito (N, ≤5%) and Cuenca (SSE, <5%) have very low probabilities of being affected by ash fallout. High ash clouds can move in different directions, compared to wind transport near the surface. Therefore, it is possible to detect ash clouds by remote sensing which, in Ecuador, is limited to the layers over the meteorological clouds, which move in a different direction than low wind; the latter produces ash fallout over regions in different directions compared to the detected ash clouds. In addition to the isomass/probability maps and detected ash clouds, forecasting is permanently required in Ecuador.
1. Introduction
Due to the impact of volcanic activity on air pollution, damage to buildings and crops, and air traffic closures [1][2][3], potentially affected regions require information on ash dispersion trajectories and ground deposition patterns [4][5]. Although ashfall rarely endangers human life directly, disruptions can lead to substantial impacts and costs, even at deposit thicknesses of only a few millimeters [6].
Ecuador hosts about 85 volcanoes, about 25 of which are currently erupting, active, or potentially active. Over the last 20 years, five volcanoes have produced small to large explosive eruptions with significant ash plumes (Pichincha, Sangay, Tungurahua, El Reventador, and Cotopaxi). Therefore, research into the dispersion and forecasting of volcanic ash is a priority in Ecuador.
Since April of 2015, the ash dispersion and ash fallout due to Vulcanian eruptions at Tungurahua (Lon. 78.446° W, Lat. 1.468° S, 5023 m a.s.l., Figure 1), a large stratovolcano located in the Real Cordillera of the Ecuadorian Andes, have been forecasted daily. Since the beginning of its current activity in October 1999, ash fallout has been the most frequent and widespread volcanic hazard [7][8]. Emissions have been discontinuous, being Strombolian and Vulcanian explosions [9] with volcano explosivity index (VEI) levels of <1 to 3 [10].
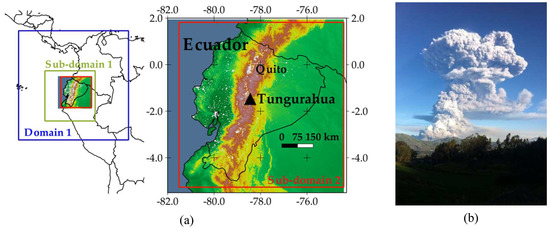
Figure 1. (a) Location of Ecuador and of Tungurahua volcano. Domains for modeling: Domain 1 (80 × 80 cells, 36 km), Sub-domain 1 (109 × 109 cells, 12 km), and Sub-domain 2 (199 × 199 cells, 4 km); (b) Vulcanian eruption at Tungurahua volcano on 01 February 2014 (Credit to: D. Mantilla).
1.1. Eruption Source Parameters and Forecasting System for Vulcanian Eruptions at Tungurahua Volcano
The geometry of ash fallout deposits reflects the combination of eruptive style, intensity, and meteorology [11]. Therefore, based on field data and laboratory analyses of ash fallout deposits, complemented with numerical studies, the eruption source parameters (ESP) for Tungurahua have been previously proposed (Table 1) [12]. These ESP correspond to the eruption on 14 July 2013. On that day, an explosion at 6:47 LT (LT = UTC − 5 h) produced short-term columns rising to 9 km above the vent. Based on its characteristics, this eruption was classified as Vulcanian and is a well-studied event; it was considered representative for similar current eruptions at Tungurahua volcano.
Table 1. Eruption source parameters for forecasting ash dispersion from Vulcanian eruptions at Tungurahua volcano [12].
| Parameter | Eruption Date | ||
|---|---|---|---|
| 14 July 2013 | 16 December 2012 | 01 February 2014 | |
| R2 | 0.72 | 0.99 | 0.87 |
| Parameter a (perfect fitting = 1) | 0.67 | 1.61 | 0.33 |
| Parameter b (perfect fitting = 0) | 0.30 | 0.07 | 0.08 |
These ESP suggest a high (8.80 km over the vent) and short (3 min) column, followed by a second medium height (4.85 km) and longer (22 min) pulse. The mass flow rate was estimated by the model of Mastin et al. [13], which uses the column height as input. The source type distributes the emitted mass along the vertical axis. The total grain size distribution (bi-Gaussian) was established by laboratory analysis of ash fallout collected from the eruption on 14 July 2013.
These predefined ESP were validated through the simulation of two historical Vulcanian eruptions, which occurred on 16 December 2012 (6:02 LT) and 01 February 2014 (17:13 LT; Figure 1). These simulations were carried out assuming that, except for the eruption starting time, no other inputs were available. During the eruption in December 2012, wind traveled in the NNE–N–NNW direction, causing fallout in the provinces of Tungurahua and Cotopaxi. During the eruption in February 2014, the wind direction was mainly towards the south and ash fallout affected the provinces of Chimborazo, Cañar, Bolivar, and Azuay, reaching the city of Cuenca [12].
Table 2 indicates the modeling performance for the eruptions on 14 July 2013, 16 December 2012, and 01 February 2014. The correlation coefficient (R2) and parameters “a” and “b” correspond to linear interpolations (y = ax + b; perfect fitting implies R2 = 1, a = 1, and b = 0) after comparison between ground ash load measurements with the corresponding modeled values at four stations. More details can be found in [12].
Table 2. Modeling performance of historical Vulcanian eruptions at Tungurahua volcano [12].
| Parameter | Eruption Date | ||
|---|---|---|---|
| 14 July 2013 | 16 December 2012 | 01 February 2014 | |
| R2 | 0.72 | 0.99 | 0.87 |
| Parameter a (perfect fitting = 1) | 0.67 | 1.61 | 0.33 |
| Parameter b (perfect fitting = 0) | 0.30 | 0.07 | 0.08 |
Our forecasting provides information about the dispersion and dynamics of volcanic ash at different Flight Levels (FLs; 200, 300, and 400), and of the area affected by ash fallout, under the assumption that an explosive eruption similar to that on 14 July 2013 takes place each day. FLs are delivered in 100 feet units, measured above mean sea level when the pressure at sea level is 1013.2 mb (e.g., FL300 = 30,000 feet ≈ 9.1 km).
Our forecasting system uses the meteorological Weather Research and Forecasting (WRF) [14] and the FALL3D [15] models, which are both Eulerian models. WRF is a last-generation non-hydrostatic model used for forecasting and weather research, with applicability to global, mesoscale, regional, and local scales. FALL3D is a 3D time-dependent model for the dispersion of volcanic ash, which solves the advection–diffusion–sedimentation equation on a terrain-following grid.
A master domain of 80 × 80 cells (36 km per side) and two nested sub-domains (see Figure 1) were used for modeling. Sub-domain 2 covers Ecuador with 199 × 199 cells (4 km) and 35 vertical levels. The resolution of 4 km is a good compromise for forecasting volcanic ash dispersion in Ecuador, with proper modeling performance. The use of coarser meteorological data, as a direct result from global forecasting datasets, led to lower modeling performance and provided larger areas affected by ash clouds, compared to results when modeling with higher resolutions [16].
The forecasting system works with the following approach:
-
First, the system downloads the forecasted global meteorology from the GFS dataset [17], in order to set the initial and boundary conditions for the nested sub-domains (Figure 1).
-
Then, WRF generates the meteorology over Ecuador. Table 3 indicates the physical parameterization used for this component.
-
Next, the meteorological output from the second sub-domain is input into FALL3D, which also uses the predefined ESP of Table 1. FALL3D writes the results into a NetCDF file. Hence, the forecasting system is based on an offline approach, without interactions between meteorology and volcanic ash in the atmosphere.
-
Finally, the system generates animated (.gif) files, which are uploaded to the web page of the Grupo de Investigación sobre la Ceniza Volcánica en el Ecuador (GICVE, due to its nomenclature in Spanish; 2020) [18]. GICVE is a group of researchers interested in the study of the dispersion of volcanic ash in Ecuador.
Table 3. Weather Research and Forecasting physics parameterization for modeling the meteorology over Ecuador [19].
| Component | Option | Scheme/Model |
|---|---|---|
| Microphysics | 16 | Double moment 6-class scheme |
| Planetary Boundary Layer | 1 | Yonsei University (YSU) |
| Cumulus Parameterization | 5 | Grell 3D ensemble |
| Shortwave | 1 | Dudhia scheme |
| Longwave | 1 | Rapid Radiative Transfer Model (RRTM) |
| Land Surface | 1 | 5-layer thermal diffusion scheme |
| Surface Layer | 2 | Eta similarity scheme |
Parra (2018) [20] described the components of this forecasting system in more detail, whose historical results are available at the web link of GICVE.
2. Isomass and Probability Maps of Ash Fallout
Although west was the main direction of ash fallout during FMA (Figure 3), it reached regions to the north, south, and even east of the volcano. Westward, probability contours of 10%, 50%, and 70%, appeared at 250, 90, and 67 km, respectively, from the crater (Table 4). Contours of 10% toward north, south, and east reached 90, 100, and 57 km, respectively.
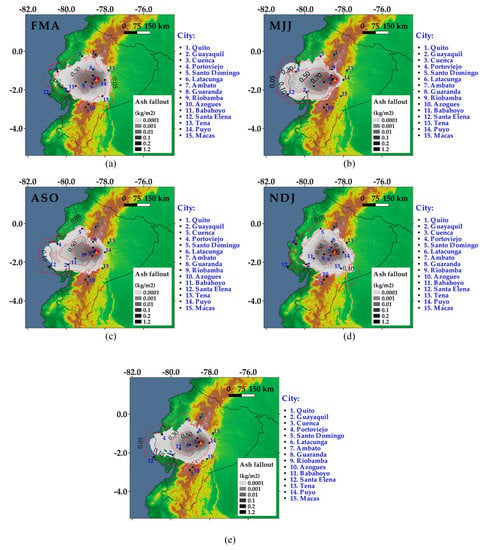
Figure 3. Isomass and probability maps of ash fallout due to Vulcanian eruptions at Tungurahua volcano. Period: (a) February–March–April (FMA), (b) May–June–July (MJJ), (c) August–September–October (ASO), (d) November–December–January (NDJ), and (e) Yearly. Red dashed lines indicate probability (0.05, 0.10, 0.30, 0.50, 0.70, and 0.90).
Table 4. Distance from the vent to contours of 10, 50, and 70 percent of probability per cardinal direction.
| Direction | Trimester | |||||||||||
|---|---|---|---|---|---|---|---|---|---|---|---|---|
| FMA | MJJ | ASO | NDJ | |||||||||
| 10% | 50% | 70% | 10% | 50% | 70% | 10% | 50% | 70% | 10% | 50% | 70% | |
| W | 250 km | 90 km | 67 km | 330 km | 175 km | 100 km | 327 km | 132 km | 90 km | 198 km | 77 km | 57 km |
| N | 90 km | 22 km | 17 km | 30 km | 18 km | 15 km | 33 km | 18 km | 14 km | 105 km | 22 km | 17 km |
| E | 57 km | 15 km | 13 km | 21 km | 13 km | 12 km | 24 km | 14 km | 13 km | 65 km | 18 km | 14 km |
| S | 100 km | 20 km | 15 km | 35 km | 18 km | 14 km | 56 km | 19 km | 15 km | 123 km | 23 km | 16 km |
During MJJ, there was a clear tendency of ash fallout toward the west (Figure 3). The 10% contour was displaced up to 330 km from the vent, even reaching the sea. Compared to FMA, the 10% contours toward north, south, and east were closer to the crater, at distances of 30, 35, and 21 km, respectively.
Maps from ASO were similar to those of MJJ, showing a clear tendency of ash fallout toward the west. Maps from NDJ, although similar to FMA, showed a slight tendency toward west.
The proximal region west of the volcano (about 100 km to the left) had the highest probability (>70%) to be affected by ash fallout (mean values between 0.01 to 1.2 kg m−2; Figure 3). The distant region to the west (100 km, up the coast border) presented low–medium probabilities (10% to 70%) of ash fallout. Most of the Ecuadorian regions to the north, south, and east of the volcano had very low probability (<10%) of being affected by ash fallout.
Considering the capitals of provinces, Guaranda (a city located to the west of the vent) had the highest probability (60%–90%) of being affected by ash fallout due to Vulcanian eruptions at Tungurahua volcano (Table 5). Riobamba, a city to the SW of the vent, had a probability of 70%. To the NW, Ambato also had a high probability (50%–60%) of being affected by ash fallout.
Table 5. Probability of ash fallout in selected cities due to Vulcanian eruptions at Tungurahua volcano.
| Code | City | Trimester | |||
|---|---|---|---|---|---|
| FMA | MJJ | ASO | NDJ | ||
| 1 | Quito | 5% | <5% | <5% | 5% |
| 2 | Guayaquil | 10% | 30% | 20% | 10% |
| 3 | Cuenca | <5% | <5% | <5% | <5% |
| 5 | Santo Domingo | 10% | 10% | 10% | 10% |
| 7 | Ambato | 50% | 60% | 50% | 50% |
| 8 | Guaranda | 70% | 90% | 80% | 60% |
| 9 | Riobamba | 70% | 70% | 70% | 70% |
| 11 | Babahoyo | 30% | 60% | 40% | 25% |
| 14 | Puyo | 10% | <5% | <5% | 20% |
| 15 | Macas | 10% | <5% | <5% | 15% |
Among the biggest cities, Guayaquil (SW of the vent) had a low probability (10%–30%) of ash fallout. Quito (≤5%) and Cuenca (<5%), located to the north and SSE, respectively, had very low probabilities of being affected.
Table 6 summarizes the number of days and percentages with ash fallout reported in the cities of Table 5, due to the seven real Vulcanian eruptions at Tungurahua volcano, which we identified, since 2010 [9][10][12]. These percentages were generated based on the corresponding daily reports by IG-EPN [9]. Although corresponding to only seven real eruptions, the percentages of Table 6 were consistent with the probabilities of Table 5. Both of them indicate that Ambato, Guaranda, and Riobamba are the cities with the highest probabilities and percentages of volcanic ash arriving.
Table 6. Number of days and percentages with ash fallout reported in selected cities due to real Vulcanian eruptions at Tungurahua volcano since 2010 [9][10][12]: 0 indicates no reported ash fallout; 1 indicates reported ash fallout.
| Code | City | Dates (dd mm yy) | Total | % | |||||||
|---|---|---|---|---|---|---|---|---|---|---|---|
| 28 05 10 | 23 11 10 | 21 08 12 | 16 12 12 | 14 07 13 | 18 10 13 | 01 02 14 | 26 02 16 | ||||
| 1 | Quito | 0 | 0 | 0 | 0 | 0 | 0 | 0 | 0 | 0 | 0 |
| 2 | Guayaquil | 1 | 0 | 0 | 0 | 0 | 0 | 0 | 0 | 1 | 13 |
| 3 | Cuenca | 0 | 0 | 0 | 0 | 0 | 0 | 1 | 0 | 1 | 13 |
| 5 | Santo Domingo | 0 | 0 | 0 | 0 | 0 | 0 | 0 | 0 | 0 | 0 |
| 7 | Ambato | 1 | 0 | 0 | 1 | 1 | 0 | 0 | 0 | 3 | 38 |
| 8 | Guaranda | 1 | 0 | 0 | 0 | 1 | 0 | 0 | 0 | 2 | 25 |
| 9 | Riobamba | 1 | 0 | 0 | 0 | 1 | 0 | 1 | 0 | 3 | 38 |
| 11 | Babahoyo | 1 | 0 | 0 | 0 | 0 | 0 | 0 | 0 | 1 | 13 |
| 14 | Puyo | 0 | 0 | 0 | 0 | 0 | 0 | 0 | 0 | 0 | 0 |
| 15 | Macas | 0 | 0 | 0 | 0 | 0 | 0 | 0 | 0 | 0 | 0 |
3. Wind Direction at Tungurahua Volcano
From 2013 to 2016, the Washington VAAC (Figure 4) detected 300 volcanic ash clouds at Tungurahua. About 38% and 33% of these clouds were detected during ASO and FMA, respectively.
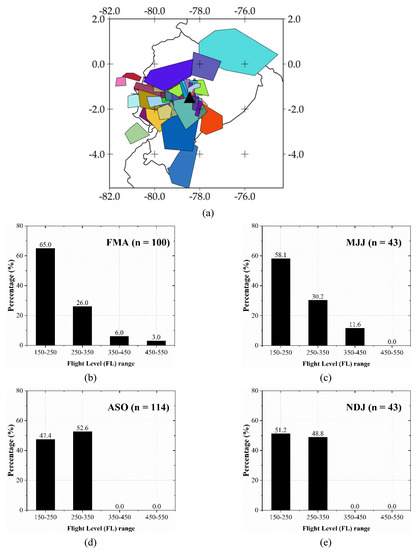
Figure 4. (a) Ash clouds detected at Tungurahua volcano by the Washington VAAC from 2013 to 2016 [21]. Percentages of clouds per Flight Level (maximum vertical height) range: (b) February–March–April (FMA), (c) May–June–July (MJJ), (d) August–September–October (ASO), (e) November–December–January. In each trimester, n is the number of detected volcanic ash clouds.
About 55% of these clouds reached maximum vertical heights between FL150 to FL250 (i.e., 4.6 to 7.6 km). These clouds dispersed mainly to the west during MJJ (52%) and ASO (50%; Figure 4). During FMA (25%) and NDJ (23%), the frequency toward the west was lower than that in MJJ and ASO.
About 40% of the detected clouds reached maximum vertical heights between FL250 to FL350 (i.e., 7.6 to 10.7 km). The highest frequency towards the west took place during ASO (45%), followed by NDJ (38%). Other directions with significant frequencies of these clouds were WNW (38%) during NDJ, NW (30%), and WSW (30% during MJJ). During FMA, these clouds showed frequencies of about 10% toward SE, S, SW, west, and WNW. Only 4% of detected clouds reached maximum vertical heights between FL350 to FL450 (10.7 to 13.7 km). These clouds moved in different directions (Figure 5) without a defined tendency.
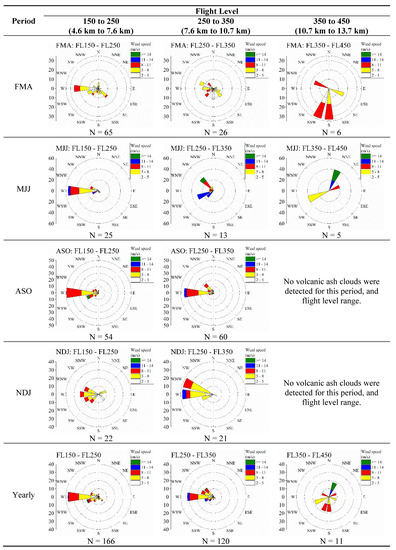
Figure 5. Wind roses deduced from detected volcanic ash clouds at Tungurahua volcano from 2013 to 2016 [21]. Flows indicate the direction the wind is flowing to. N indicates the number of detected volcanic ash clouds. The axis indicates frequency (%).
Wind roses at 500 mb (≈FL200) deduced from the ERA5 mean monthly dataset indicated frequencies higher than 90% towards west during MJJ and ASO, with speeds up to 14 m s−1 (Figure 6). During NDJ and FMA, frequencies to the west decreased to 36% and 60%, respectively, with wind speeds up to 8 m s−1.
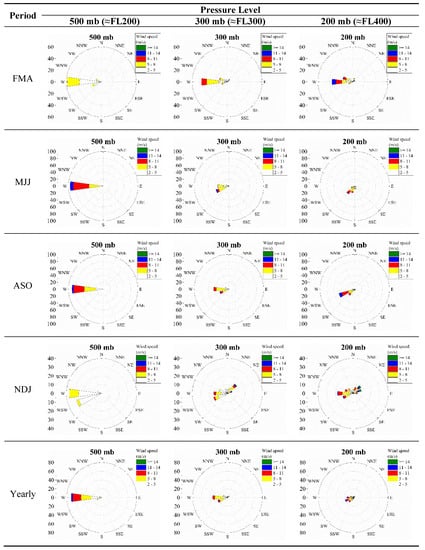
Figure 6. Wind roses deduced from horizontal wind components from ERA5 monthly average data on pressure levels at Tungurahua volcano (Period: 1979–2019) [22]. Flows indicate the direction the wind is flowing to. The axis indicates frequency (%).
At 300 mb (≈FL300), wind direction towards west was more frequent during FMA (45%) and ASO (40%). WSW was the most frequent direction during MJJ (40%) and NDJ (15%). During NDJ, west (≈15%) and NNE (≈15%) directions were frequent.
At 200 mb (≈FL400), wind directions showed diversity, especially during NDJ, west (18%), WSW (12%), WNW (10%), NE (10%), and ENE (10%) being the most frequent.
References
- Horwell, C.J.; Baxter P.J. The respiratory health hazards of volcanic ash: A review for volcanic risk mitigation. B. Volcanol. 2006, 69(1), 1–24.
- Ayris, P.M.; Delmelle, P. The immediate environmental effects of tephra emission. B. Volcanol. 2012, 74, 1905–1936.
- Wilson, T.M.; Stewart, C. Volcanic Ash. In Encyclopedia of Natural Hazards; Bobrowsky, P., Ed.; Springer: New York, USA, 2013; p. 1135.
- Macedonio, G.; Costa, A.; Longo A. A computer model for volcanic ash fallout and assessment of subsequent hazard. Comput. Geosci. 2005, 31, 837–845.
- Bonasia, R.; Scaini, C.; Capra, L.; Nathenson, M.; Siebe, C.; Arana-Salinas, L.; Folch, A. Long-range hazard assessment of volcanic ash dispersal for a Plinian eruptive scenario at Popocatépetl volcano (Mexico): Implications for civil aviation safety. B. Volcanol. 2014, 76, 1–16.
- Stewart, C.; Wilson, T.; Sword-Daniels, V.; Wallace, K.; Magill, C.; Horwell, C.; Leonard, G.; Baxter, P. Communication Demands of Volcanic Ashfall Events. Adv. Volcanol. 2016, 23–49.
- Le Pennec, J.L.; Ruiz, G.A.; Ramón, P.; Palacios, E.; Mothes, P.; Yepes, H. Impact of tephra falls on the Andean communities: The influences of eruption size and weather conditions during the 1999–2001 activity of Tungurahua volcano, Ecuador. J. Volcanol. Geoth. Res., 2012, 217–218, 91–103.
- Bernard, B.; Bustillos, J.; Wade, B.; Hidalgo, S. Influence of the wind direction variability on the quantification of tephra fallouts: December 2012 and March 2013 Tungurahua eruptions. Av. Cienc. Ing. 2013, 5–1, A14–A21.
- IG. Instituto Geofísico – Escuela Politécnica Nacional. Available online: https://www.igepn.edu.ec. (accessed on 05 August 2020).
- Mothes, P.; Yepes, H.; Hall, M.; Ramón, P.; Steele, A.; Ruiz, M. The scientific–community interface over the fifteen-year eruptive episode of Tungurahua Volcano, Ecuador. J. Appl. Volcanol. 2015, 4, 1–15.
- Biass, S.; Bonadonna, C.; Houghton, B. A step-by-step evaluation of empirical methods to quantify eruption source parameters from tephra-fall deposits. J. App. Volcanol. 2019, 8, 1–16.
- Parra, R.; Bernard, B.; Narváez, D.; Le Pennec, J.L.; Hasselle, N.; Folch, A. Eruption Source Parameters for forecasting ash dispersion and deposition from vulcanian eruptions at Tungurahua volcano: Insights from field data from the July 2013 eruption. J. Volcanol. Geoth. Res. 2016, 309, 1–13.
- Mastin, L.G.; Guffani, M.; Servranckx, R.; Webley, P.; Barsotti, S.; Dean, K.; Durant, A.; Ewert, J.W.; Neri, A.; Rose, W.I.; et al. A multidisciplinary effort to assign realistic source parameters to models of volcanic ash-cloud transport and dispersion during eruptions. J. Volcanol. Geoth. Res. 2009, 186, 10–21.
- WRF. Weather Research and Forecasting Model. Available online: https://www.mmm.ucar.edu/weather-research-and-forecasting-model. (accessed on 07 July 2020).
- Folch, A., Costa, A., Macedonio, G. FALL3D: A computational model for transport and deposition of volcanic ash. Comput. Geosci. 2009, 35, 6, 1334–1342.
- Parra, R. Influence of Spatial Resolution in Modeling the Dispersion of Volcanic Ash in Ecuador. Wit Trans. Ecol. Enviro. 2019, 236, 67–68.
- GFS. Global forecast system. Available online: https://www.ncdc.noaa.gov/data-access/model-data/model-datasets/global-forcast-system-gfs. (accessed on 06 August 2020).
- GICVE. Grupo de Investigación sobre la Ceniza Volcánica en el Ecuador. Available online: https://www.usfq.edu.ec/programas_academicos/colegios/politecnico/institutos/gicve/Paginas/default.aspx?Paged=TRUE&p_SortBehavior=0&p_FileLeafRef=20180529_04h00_Cot.gif&p_ID=491&PageFirstRow=61&&View=%7B8D270371-492C-417B-AE65-D2AE6C01E7DF%7D. (accessed on 06 July 2020).
- Skamarock, W.; Klemp, J.; Dudhia, J.; Barker, D.; Duda, M.; Huang, X.; Wang, W.; Powers, J. A Description of the Advanced Research WRF Version 3. NCAR/TN-475+STR. NCAR Technical Note. Mesoscale and Microscale Meteorology Division. National Center for Atmospheric Research Boulder, USA. 2008.
- Parra, R. In Numerical system for forecasting volcanic ash dispersion in Ecuador. 2018 IEEE Third Ecuador Chapter Meeting (ETCM), Cuenca, Ecuador, 15-19 October 2018; pp. 1–5.
- Washington VAAC. Washington DC Volcanic Ash Advisory Center. Available online: https://www.ssd.noaa/VAAC/washington html. (accessed on 06 July 2020).
- CDS. ERA5 monthly averaged data on pressure levels from 1979 to present. Available online: https://cds.climate.copernicus.eu/cdsapp#!/dataset/reanalysis-era5-pressure-levels-monthly-means?tab=overview. (accessed on 22 July 2020).


