An individual’s gene expression profile changes throughout their life. This change in gene expression is shaped by differences in physiological needs and functions between the younger and older organism. Despite intensive studies, the aging process is not fully understood, and several genes involved in this process may remain to be identified. In this study authors compared the expression profiles of two-day-old female adult Drosophila flies with 45-day-old flies. They identified 1184 genes with pronounced differences in expression level between young and old age groups, including 232 genes with unknown functions. Authors characterized the subcellular localization of twelve of them and discovered that knockdown of some of them affects the lifespan of flies.
1. Introduction
Aging of an organism progresses with cascades of molecular changes, some of which are universal across all eukaryotes, while others are specific to taxonomic units
[1][2][3][4][5][6][7][8][9]. In a living cell, these molecular changes regulate the transcriptional activation of age-related genes, the capacity for DNA repair, and programmed cell death, thereby mediating rates of cellular proliferation and differentiation. Coupled with environmental stress and damage accumulation, such changes lead to an exponential increase in frailty and morbidity over time, ultimately determining the lifespan of an organism.
With an increasing proportion of older individuals in industrialized human populations, understanding the underlying mechanisms of aging- and senescence-associated diseases has gained tremendous clinical importance. Aging-related morbidity involves an increase in the risk for certain cancers
[1][2], heart disease
[3], macular degeneration
[4], Alzheimer’s disease
[5], osteoporosis
[6], and a plethora of other conditions.
2. Comparison of the Expression Profile between Young and Old Age Groups
To compare the expression profiles of young and old age fruit flies, we collected y(1), w67c23(2) female flies at day three and day 45 post-pupation (hereinafter termed as young and old age groups, respectively). Flies were mated with males for two days after pupation and then cultured at 20 °C for the duration of the experiment. We selected 45-day-old flies as the old age group because fly survivorship remains high until this time point and decreases sharply after it
[10]. This survivorship decrease is linked with the accumulation of necrotic and apoptotic tissues, which might cause changes in the transcriptomic profile, masking partly the changes that occur due to developmental changes. The expression profile was determined using a microarray chip and was realized in three biological replicates to control for random fluctuations. The fluorescence intensity of each probe is presented in our raw data as a log
2 value. Differentially expressed genes (DEGs) have been identified based on a the following criteria: (1) fold difference higher than two, (2) two-tailed
t-test based on change of expression between young and old age groups relative to the standard deviation of all measurements with a resulting
p-value lower than 0.05, and (3) false discovery rate (FDR) lower than 15%.
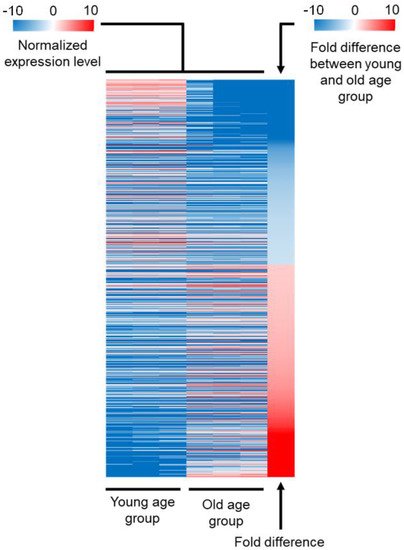
Authors analysis identified 1225 probes that presented differential fluorescence intensity between young and old age groups. We identified 1147 genes targeted by a unique probe and 37 genes targeted by more than one probe, leading to 1184 genes differentially expressed between young and old age groups. In total, 550 of these genes were downregulated in old age flies (hereinafter termed as “downregulated DEGs”), whereas the remaining 634 were upregulated (hereinafter termed as “upregulated DEGs”). Probes targeting the same gene were all upregulated or downregulated in old age flies. The three biological replicates produced similar results for each gene, suggesting that the expression level is stable in an age-constrained group (Figure 1). The absolute range of expression level was extremely broad between young and old age groups, from negative 559-fold for the cuticle protein coding gene Acp65Aa to 591-fold for the NPC2-like gene Npc2e. However, the fold difference of 88% of these 1184 genes ranged between −25 and 75 only. To determine which cellular functions were more affected by aging than others, we next carried out a functional analysis of DEGs.
Figure 1. Overview of the transcriptomic analysis. Heatmap representing the expression level of DEGs between old and young age groups that followed our three criteria: (1) fold difference higher than 2, (2) p-value of t-test based on three biological replicates lower than 0.05, and (3) false discovery rate (FDR) lower than 15%. The three biological replicates are shown separately. The expression level of each gene is normalized by subtracting the average level of expression for all genes. A negative value corresponds to a gene that is downregulated in old age flies (downregulated DEGs) (blue), while a positive value corresponds to a gene that is upregulated in old age flies (upregulated DEGs) (red). The last column represents the fold difference between old and young age groups. The value is negative when the expression is higher in the young age group (blue), and the value is positive when the expression is higher in the old age group (red).
3. Cellular Functions of DEGs
To identify the functions of DEGs, we tested the list with 1184 genes using the PANTHER classification system
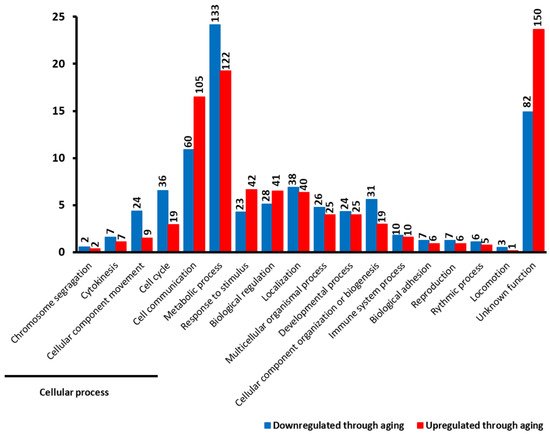
[11]. Among the 1184 DEGs, 952 possess a known cellular function, whereas the function of the other 232 genes is unknown. These genes with unknown function correspond to 82 out of 550 (14.9%) of the downregulated DEGs and 150 out of 634 (23.7%) of the upregulated DEGs (
Figure 2). The 952 genes with known functions are involved in a range of cellular functions. We identified five categories represented in different proportions among upregulated and downregulated DEGs. The “cellular process” category is the most represented in that 22.4% of the upregulated DEGs and 25% of the downregulated DEGs fall into this category. Among upregulated DEGs involved in the “cellular process”, 73.8% of them play a role in “cell-cell communication”, compared to 45.5% for downregulated DEGs. Other upregulated DEGs that play a role in the“cellular process” are involved in the cell cycle (13.1%) and “cellular component movement” (6.6%), compared to downregulated DEGs (27.3% and 18.2%, respectively).
Figure 2. Overview of main cellular functions of 1184 differentially expressed genes between young and old age groups. The first five processes are subcategories of the “cellular process”. The height of each bar corresponds to the percentage of genes belonging to each specific process. Genes downregulated in the old age group are represented in blue, whereas genes upregulated in the old age group are represented in red. The black number at the top of each bar corresponds to the number of DEGs belonging to each specific process.
Authors identified other categories of cellular function represented in different proportions between upregulated and downregulated DEGs, including “response to stimulus” (6.6% and 4.3% for upregulated and downregulated DEGs, respectively), which are genes that respond to stress or genes involved in cellular and immune defense, and “biological regulation” (6.5% and 5.1%), including genes that regulate catalytic activity or play a role in the regulation of nucleobase-containing compound metabolism.
In addition, they found several categories represented in similar proportions among upregulated and downregulated DEGs, including “localization” (6.3% and 6.9 for upregulated and downregulated DEGS, respectively), “multicellular organismal process” (4% and 4.8%), “developmental process” (4% and 4.3%), “immune system process” (1.6% and 1.8%), and other categories (Figure 2). Taken together, these results suggest that some cellular functions are differentially regulated between young and old age groups. The genes important for the processes involved in defense response and biological regulation seem to be upregulated in the old age group, whereas genes important for cellular component organization or biogenesis are downregulated. However, this method does not tell us if a particular category is significantly overrepresented among the DEGs.
4. Distribution of DEG Types between Young and Old Age Groups
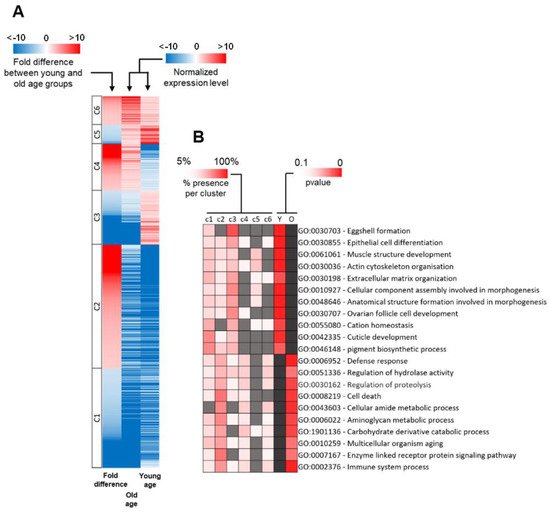
To establish how differences in the expression of these 1184 genes determine the progression of aging, we first normalized the expression level of every DEG to the average expression level of all DEGs. We then divided all DEGs into six gene classes based on the difference of their expression level between young and old age groups (Figure 3A, Table 1). This process sorts DEGs according to their expression profile in the two age groups. The first class (c1) consisted of 328 genes that had a normalized expression lower than average in both age groups and that were upregulated in the young age group. The second class (c2) included 408 genes with lower than average normalized expression in both populations and that were upregulated in the old age group. The third class (c3) was composed of 178 genes with a lower normalized expression than average in the old age group, but higher than average in the young age group. The fourth class (c4) consisted of 154 genes that had a higher expression than average in the old age population and lower than average in the young age population. The fifth class (c5) included 63 genes that had a higher expression than average in both groups and were upregulated in the young age group. The sixth class (c6) comprised the remaining 94 genes that had a higher expression level than average in both age groups and were upregulated in the old age group.
Figure 3. Functional classification of differentially expressed genes between young and old age groups. (A) Heatmap of differentially expressed genes. Expression values for the old and young age groups are shown as normalized to the mean of the expression of all genes. Blue color indicates that the expression level of a gene is lower than the mean, whereas a red color indicates a higher expression level. The fold difference column corresponds to the difference of expression of a gene between old and young age groups. The blue color corresponds to a downregulated gene in the old age group, whereas the red color corresponds to an upregulated gene in the old age group. The six gene classes are shown. (B) GO-term function enrichment analysis of old and young age groups and the prevalence of each GO-term in each gene class. The first six columns correspond to the six classes represented in Figure 3A (c1 to c6). The significance of the most represented GO-term in the old and young age groups is indicated by the p-value in the last two columns (Y for the young age group and O for the old age group). The heatmap below each gene class corresponds to the percentage of genes belonging to each GO-term that are present in this gene class. A grey tile means that less than 5% of the DEGs that belong to this GO-term are members of this gene class. A dark grey tile means that this GO-term is not overrepresented in this category.
Table 1. Summary of differentially expressed genes (DEGs) by class. Gene class 1 and 2 correspond to DEGs with low expression compared to other genes in both young and old age groups. Gene class 3 and 4 correspond to DEGs with low expression compared to other genes in one group and a high expression in another group. Gene class 5 and 6 correspond to DEGs with high expression compared to other genes in both young and old age groups.
| Gene Class |
Number of Genes Included |
Expression in the Young Age Group Compared
to Average |
Expression in the Old Age Group Compared
to Average |
Down- or Upregulated
during Aging |
| 1 |
328 |
Lower |
Lower |
Downregulated |
| 2 |
408 |
Lower |
Lower |
Upregulated |
| 3 |
178 |
Higher |
Lower |
Downregulated |
| 4 |
154 |
Lower |
Higher |
Upregulated |
| 5 |
63 |
Higher |
Higher |
Downregulated |
| 6 |
94 |
Higher |
Higher |
Upregulated |
We identified that 1040 out of 1184 DEGs (87.7%) had lower than average normalized expression in at least one of the age groups; 722 out of 1184 (60.9%) had lower than average expression in both groups. Most DEGs in c1 and c2 had low expression in both age groups. As it is mathematically easier to attain a large fold difference when the initial level of expression is low, fluctuation levels in the expression of these DEGs may not necessarily be biologically relevant to the aging process. Life-course changes in the expression levels of DEGs belonging to c3 and c4 may be more biologically relevant to aging because they present a higher expression than average in one of the age groups, but a lower expression than average in the other group. Genes in c5 and c6 are similar to those belonging to c3 and c4 in that they present a higher-than-average expression in both groups, making it mathematically harder to attain a significant fold difference between them. Sorting DEGs based on their relative expression allows us to identify DEGs that might be more biologically relevant
[12] and that may be worth investigating first.
5. Functional Classification of DEGs
To determine the cellular functions that are significantly overrepresented among DEGs, we performed a gene set enrichment analysis using GSEA software. We selected the most significant Gene Ontology (GO)-term and showed the proportion of the different gene classes for all of them (Figure 3B). First, we focused on GO-terms that mainly include downregulated DEGs. Many genes involved in the GO-term ‘GO:0030703 Eggshell formation’ were downregulated in the old age group with 22 out of 29 DEGs (75.9%) that belonged to c3. Gene class 3 (c3) contains DEGs with lower-than-average expression in the old age group and higher-than-average expression in the young age group. Genes involved in ‘GO:0030855 Epithelial cell differentiation’ were also overrepresented among DEGs with 25 out of 52 DEGs (48.1%) belonging to c3 or c5. Genes involved in ‘GO:0061061 Muscle structure development’ and ‘GO:0030036 Actin cytoskeleton organization’ were also overrepresented among downregulated DEGs with 12 out of 27 DEGs (51.8%) and 15 out of 28 DEGs (53.6%), respectively, that belonged to c3 or c5. We also noticed the overrepresentation of genes belonging to the GO-term ‘GO:0030198 Extracellular matrix organization’ among the downregulated DEGs with 7 out of 15 DEGs (46.7%) that belonged to c3 or c5. Genes involved in two GO-terms linked to morphogenesis were also overrepresented among downregulated DEGs: ‘GO:0010927 Cellular component assembly involved in morphogenesis’ with 26 out of 36 DEGs (72.2%) that belonged to c3 or c5 and ‘GO:0048646 Anatomical structure formation involved in morphogenesis’ with 37 out of 70 DEGs (52.9%) that belonged to c3 or c5. We also observed the overrepresentation of DEGs involved in the development of ovarian follicle cells (GO term ‘GO:0030707 Ovarian follicle cell development’) with 25 out of 43 DEGs (58.1%) that belonged to c3 or c5. Many genes involved in the GO-term ‘GO:0055080 Cation homeostasis’ were downregulated in the old age group with 6 out of 11 DEGs (54.6%) belonging to c3 or c5. Interestingly, a majority of the c1 genes overrepresented among downregulated DEGs belonged to only two GO-terms: ‘GO:0042335 Cuticle development’ with 13 out of 25 DEGs (52%) and ‘GO:0046148 pigment biosynthetic process’ with 5 out of 10 DEGs (50%).
Next, authors focused on GO-terms, which mainly include upregulated DEGs. Interestingly, only three GO-terms presented a majority of DEGs belonging to c4 or c6. Class 4 contains DEGs with higher-than-average expression in the old age group and lower-than-average expression in the young age group, while class 6 contains DEGS presenting higher-than-average expression in both age groups and are upregulated. Genes involved in the GO term ‘GO:0006952 Defense response’ were overrepresented among upregulated DEGs with 23 out of 58 DEGs (39.6%) that belonged to c4 or c6. The genes involved in the GO-term ‘GO:0051336 Regulation of hydrolase activity’ were also overrepresented among upregulated DEGs with 4 out of 10 DEGs (40%) belonging to c4 or c6. Genes important for the GO-term ‘GO:0030162 Regulation of proteolysis’ were overrepresented among upregulated DEGs with 5 out of 13 DEGs (38.5%), and these genes belonged to c4 or c6. A majority of c2 genes overrepresented among upregulated DEGs belonged to eight GO-terms, including ‘GO:0020037 Heme binding’ with 12 out of 27 DEGs (44.4%) and ‘GO:0008219 Cell death’ with 12 out of 20 DEGs (60%), as well as genes important for metabolic or catabolic processes, such as ‘GO:0043603 Cellular amide metabolic process’, ‘GO:0006022 Aminoglycan metabolic process’ and ‘GO:1901136 Carbohydrate derivative catabolic process’ with 10 out of 20 DEGs (50%), 13 out of 25 DEGs (52%) and 8 out of 19 DEGs (42.1%), respectively. Other c2 genes associated with ‘GO:0010259 Multicellular organism aging’, GO:0007167 Enzyme-linked receptor protein signaling pathway’, and ‘GO:0002376 Immune system process’ were also overrepresented among upregulated DEGs with 8 out of 18 DEGs (44.4%), 13 out of 21 DEGs (23.8%), and 24 out of 51 DEGs (47.1%), respectively.
Taken together, these results show that several processes are differentially regulated between the age groups. Genes involved in development or morphogenesis were mainly downregulated in the old age group, whereas genes involved in immune response, proteolysis, and cell death were mainly upregulated in the old age group. The downregulation of the genes involved in ‘GO:0030703 Eggshell formation’ and, more globally, in egg development were expected since several studies reported it
[13][14][15]. The downregulation of genes involved in ‘GO:0030855 Epithelial cell differentiation’ is consistent with the expected epithelial regeneration decrease during aging
[16]. The global downregulation of genes involved in ‘GO:0061061 Muscle structure development’ was also expected since it has already been reported several times
[17][18]. The upregulation of genes involved in ‘GO:0006952 Defense response’ and the immune system, in general, was also expected and has been extensively studied over the last decade
[14][15][19]. We also expected to find genes involved in the apoptotic process to be upregulated during aging since several studies have reported the phenomenon in
Drosophila [13][20]. Therefore, author results are consistent with the
Drosophila aging transcriptomic literature.
 +1 credit