Your browser does not fully support modern features. Please upgrade for a smoother experience.
Submitted Successfully!
 +1 credit
Thank you for your contribution! You can also upload a video entry or images related to this topic.
For video creation, please contact our Academic Video Service.
| Version | Summary | Created by | Modification | Content Size | Created at | Operation |
|---|---|---|---|---|---|---|
| 1 | Liping Wang | + 1669 word(s) | 1669 | 2021-12-13 08:35:47 | | | |
| 2 | Rita Xu | + 362 word(s) | 2031 | 2021-12-14 03:55:38 | | |
Video Upload Options
We provide professional Academic Video Service to translate complex research into visually appealing presentations. Would you like to try it?
Cite
If you have any further questions, please contact Encyclopedia Editorial Office.
Wang, L. Cell Penetrating Peptides. Encyclopedia. Available online: https://encyclopedia.pub/entry/17075 (accessed on 24 July 2026).
Wang L. Cell Penetrating Peptides. Encyclopedia. Available at: https://encyclopedia.pub/entry/17075. Accessed July 24, 2026.
Wang, Liping. "Cell Penetrating Peptides" Encyclopedia, https://encyclopedia.pub/entry/17075 (accessed July 24, 2026).
Wang, L. (2021, December 14). Cell Penetrating Peptides. In Encyclopedia. https://encyclopedia.pub/entry/17075
Wang, Liping. "Cell Penetrating Peptides." Encyclopedia. Web. 14 December, 2021.
Copy Citation
Cell-penetrating peptides (CPPs) are peptides that can directly adapt to cell membranes and then permeate into cells. They are usually cationic for the electronic interactions between CPPs and anionic cell membrane. Meanwhile, some of them can target a specific protein at the same time. In nanomedicine, as an element, CPPs are usually covalently linked to the surface of nanocarriers to endow their permeability to the whole system.
cell-penetrating peptide
gene therapy
nanomedicine
1. Introduction
In gene delivery systems, nonviral systems have gained wide attention because of the activation of oncogenes and excessive immunogenicity of viral vectors [1]. To absorb genes first and then penetrate the cell membrane, cationic polymers such as polyethyleneimine (PEI) [2][3][4][5] and poly-(l-lysine) (PLL) [6] have been proposed. However, significant toxicity can be observed in cells or animals after the administration of PEI. PEI was reported to activate Fasl-mediated antigen-induced cell death in the spleen [7]. Systemic administration of PEI caused liver necrosis and death, as well as the increase of small aggregates of both platelets and CD11-b-positive cells in the lung [8]. PLL also shows its very toxicity, which increases with the increment of its molecular weight [9]. Polyamidoamine (PAMAM) dendrimer, whose synthesis is complicated and costly [10], has potential cytotoxicity [11]. Thus, cationic nanocarriers with better biocompatibility such as peptide-based vehicles are wiser choices. Peptide-based self-assembly has been proposed to deliver cargos such as cyclic peptides [12][13], linear short peptides [14], and amphiphilic peptides [15]. Among them, di-phenylalanine (FF) is extracted from the Alzheimer’s β-amyloid polypeptides and can self-assemble in aqueous conditions. It is reported to have easy production, functional versatility, biodegradability, biocompatibility, and non-immunogenicity [16][17][18]. FF has been decorated with other subunits from amino acids such as Cys [19], to polymers such as PCL [20]. It can boost the self-assembly of those systems.
More than 1700 CPPs have been reported, and the most common are TAT and PLL [21][22]. However, through only electronic interactions, off-targeting effects are downsides in types of cationic CPPs [23]. Thus, some targeted CPPs are proposed, such as octarginine (R8) targeting neuropilin-1 receptors [24]. RTMIWY(d-P) GAWYKRI is a continuous sequence of 14 amino acids designed by our lab to blockade the PD-1/PD-L1 process [25], which can be more facile to synthesize through solid-phase peptide synthesis technology. Meanwhile, its net charge is above 3 from pH 7.4 to 6.0, which means it is likely to absorb anionic nucleic acids and penetrate the cell membrane.
To increase the flexibility, we add two phenylalanines (FF) with two Alanines as the linker to boost its flexibility, to be 18 amino acids (FFAARTMIWY(d-P)GAWYKRI). Furthermore, we explore its capacity to load hydrophobic drug doxorubicin (Figure 1).
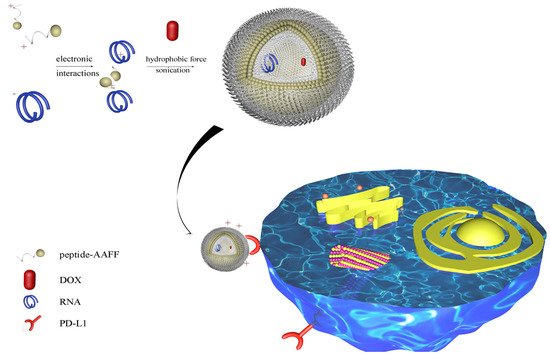
Figure 1. Schematic illustration of peptide-RNA-DOX for tumor regression. A PD-L1 targeted amino acids sequence was linked to Phe-Phe-Ala-Ala to form nanospheres. SiRNA and DOX were loaded through electronic interactions and hydrophobic force. This nano-system can target PD-L1 protein for tumor regression.
2. Characterization of Peptide and Peptide-RNA/DOX
FF was reported to form nanotubes in the aqueous solution [26]. However, when connecting it to other peptides, the assembly may be influenced by other amino acids, such as Arg, Pro, etc. [15]. Thus, we first used SEM to observe if it can form nanostructures in an aqueous solution after sonication, and what types of structures they will be. As illustrated in Figure 2A,B, the peptide formed some nanospheres at the concentration of 0.5 mg/mL.
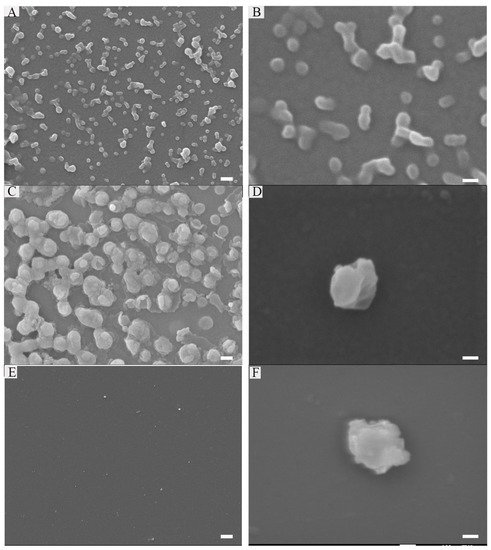
Figure 2. Characterization of peptide: 0.25 mg/mL peptide (A,B), Peptide (0.25 mg/mL)-RNA (5 μM) (C,D), peptide (0.25 mg/mL)-RNA (5 μM)-DOX (20 μg/mL) (E,F). Scale bars in the left array are 200 nm; scale bars in the right array are 100 nm.
Gene therapy is a method with great expectations to treat various diseases. This is due to its great potential to realize some affections that small-molecular inhibitors and antibodies will never possess, which were known as undruggable targets [27]. Knocking down gene expression, altering mRNA splicing, targeting trinucleotide repeat disorders, upregulating target genes, expressing genes, and editing the genome are examples of its peculiar functions [28]. Practically, some siRNA-based therapeutic products have been proved by the Food and Drug Administration (FDA), such as Patisiran, Givosiran, Lumasiran, and Inclisiran. However, the main obstacle of gene therapy is the billion-year-old lipid barrier [29], which prevents large, charged molecules such as RNA. Thus, many kinds of nano-systems are constructed to deliver RNA into cells.
Encouraged by the results above, we wonder if it could absorb anionic nucleic acids and package them into their cores. The gel retardation assays showed that peptide (0.25 mg/mL) can completely package RNA (10 μM). In addition, it is stable in FBS after 24 h. Figure 2C,D showed the nanostructure of peptide-RNA, which was similar to the former. Furthermore, as the cores are hydrophobic [30], we wonder if this peptide could also package hydrophobic drugs. Thus, DOX was desalinated by triethylamine and then mixed with the peptide in DMSO. Finally, the solution was diluted by ddH2O to assist the formation of the peptide, followed by dialysis. However, when it came to a higher DLC (30%), only about 70% of DOX can be encased. Figure 2E,F showed there were no dramatic changes after loading with DOX. Therefore, all the following experiments were carried at 20% of DOX. Notably, the addition of RNA and DOX slightly changed the sizes of its nanostructure. However, some amino acids in the sequence such as A, I, and M provided hydrophobic force, and Y and W were also involved in π-π stacking. Additionally, R and K referred to electronic reactions [31].
3. Internalization of Peptide-RNA/DOX and Its Mechanism
To confirm the cell toxicity first, MTT assays were carried out. The concentration lower than 40 μM did not affect the viability of MDA-MB-231 cells, while the concentration lower than 20 μM did not affect HUVEC cells. Thus, the following assays were carried out at the concentration that was lower than 15 μM of peptide.
To explore whether peptides can carry RNA into cells, flow cytometry assays were carried out. As illustrated in Figure 3A,B, only RNA-FAM cannot enter cells while peptides can carry it together with being internalized. Thus, the fluorescence of RNA in the cell increased with time. Notably, the fluorescence diminished at 6 h, which may be due to the endogenous degradation in cells. Meanwhile, to further evaluate the toxicity, peptides were compared with commercialized cationic peptide-based (PLL 2kDa) and polymer-based (PEI) vehicles. MTT assays indicated the high toxicity of PEI and similar non-toxicity of PLL (2 kDa–3 kDa). Though there were no significant differences between PLL and peptides at low concentrations, the toxicity of PLL increases with the molecular weight. Notably, Figure 3C,D illustrated the highest transduction efficiency of peptides among them after being incubated for only 30 min. To determine by what mechanism the peptide was internalized, inhibitors were used. Figure 3E,F showed β-cyclodextrin (disrupts the formation of the cholesterol domains) and heparin (combined with heparan sulfate proteoglycan) were the most important factors, which means the caveolae-mediated endocytosis and electrostatic interactions were the main factors separately. Additionally, the competition of PD-L1 protein significantly influenced the internalization, while wortmannin (blocks the formation of clathrin-coated vesicles) did not.
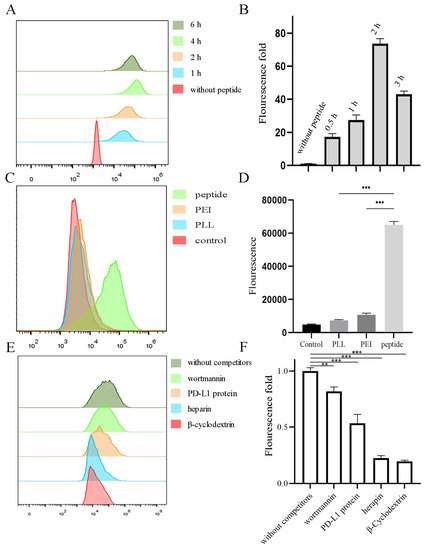
Figure 3. Cell internalization of peptide-RNA-FAM in MDA-MB-231 cells. (A,B) Peptide-RNA were incubated with cells, and the fluorescence was detected by flow cytometry after 1, 2, 4, and 6 h and quantified. (C,D) PLL, PEI, and peptide loaded with RNA. They were then incubated with cells for 0.5 h, followed by flow cytometry and quantified. (E,F) Cells were first incubated with inhibitors for 2 h followed by the addition of peptide-RNA. They were then detected and quantified. ** p < 0.01, *** p < 0.001, n = 3.
Programmed cell death-1 (PD-1)/PD-L1 ligand 1 (PD-L1) (CD279) is an inhibitory checkpoint, which can inhibit the activation of T and B cells in the tumor microenvironment [32]. Antibody drugs such as Nivolumab, Pembrolizumab, etc., are approved by the FDA. However, their drawbacks are obvious, such as high costs and poor tissue permeability. To determine whether it can still blockade PD-1/PD-L1 after assembly, exhausted T cell models were used. T cells were incubated with excessive tumor cells (incubated with IFN-γ to overexpress PD-L1) for 24 h to induce exhaustion, and the nanovesicles were added to blockade the process. Finally, the exhaustion degree was evaluated by the expression level of IL-2 after the stimulation of PMA/PHA.
As the peptides were designed to co-load with RNA and DOX, CLSM and flow cytometry were used to observe the internalization of both cargos. Figure 4 showed the fluorescence of RNA-FAM (green) and DOX (red) in cells. The yellow indicated the co-localization of RNA and DOX. The intensity increased with time. Furthermore, PD-L1 competed with peptides, and thus the fluorescence decreased. Meanwhile, flow cytometry (Figure 5A,B) supported the results. Cells aggregated in the Q4 quadrant represented those for which neither RNA nor DOX was internalized. Q1 and Q3 quadrants represented those for which only DOX and RNA were internalized separately. Q2 quadrant represented those for which both RNA and DOX were internalized.
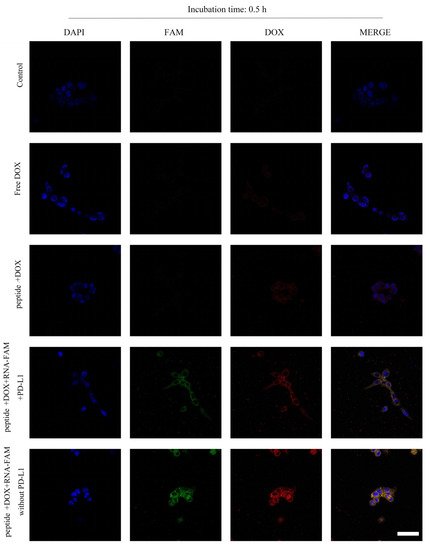
Figure 4. Cell internalization of peptide-RNA-DOX in MDA-MB-231 cells. CLSM images of cells after the incubation with PBS (the first line), free DOX (the second line), peptide-DOX (the third line), peptide-RNA-DOX with PD-L1 proteins (the fourth line), and peptide-RNA-DOX (the fifth line) for 0.5 h. Scale bar 50 μm.
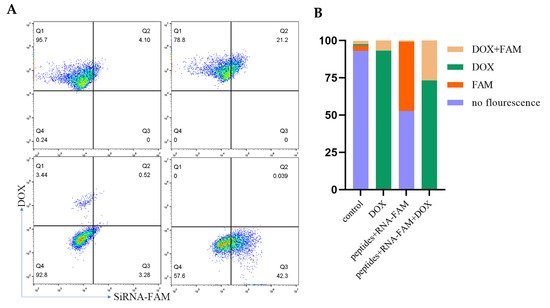
Figure 5. MDA-MB-231 cells were incubated with peptide-RNA-DOX for 0.5 h and then were detected by flow cytometry (A) and quantified (B).
4. Anti-Tumor Effects In Vitro
Gene therapy is a method that has great expectations to treat various diseases. This is due to its great potential to realize some affections that small-molecular inhibitors and antibodies will never possess, which was known as undruggable targets [27]. Knocking down gene expression, altering mRNA splicing, targeting trinucleotide repeat disorders, upregulating target genes, expressing genes, and editing the genome are examples of its functions [28]. Practically, some siRNA-based therapeutic products have been proved by the Food and Drug Administration (FDA), such as Patisiran, Givosiran, Lumasiran, and Inclisiran. However, the main obstacle of gene therapy is the billion-year-old lipid barrier [29], which prevents large, charged molecules such as RNA. Thus, many types of nanosystems are constructed to deliver RNA into cells.
Since SURVIVIN is an inhibitor of apoptosis protein (IAP) that is overexpressed in nearly every type of cancer [33] and DOX is widely used in treating breast cancer, we used flow cytometry to detect the apoptosis of cells after administrations. Figure 6A,B showed peptide-RNA, peptide-DOX, and peptide-RNA-DOX caused cell apoptosis. The most apoptosis happened when RNA and DOX were both administrated. Real-time qPCR (Figure 6C) indicated the significant decrease in the expression of SURVIVIN, which was consistent with Western blot results (Figure 6D). These results suggested that peptide-RNA-DOX was a good system to treat breast cancer.
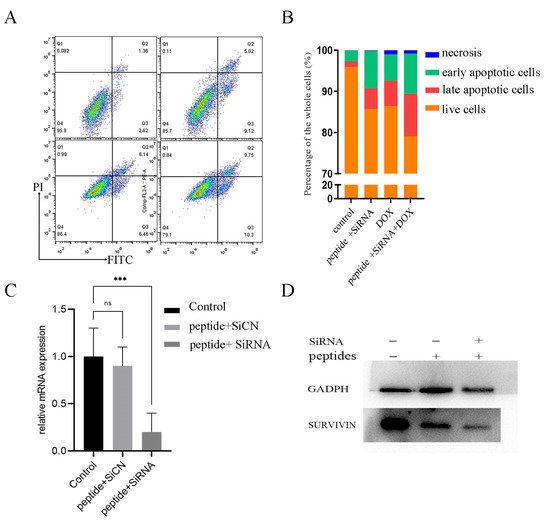
Figure 6. Cell apoptosis. (A) flow cytometry of cells after incubation with PBS (left top), peptide-RNA (5 μM) (right top), peptide-DOX (2 μg/mL) (left bottom), and peptide-RNA (5 μM)-DOX (2 μg/mL) (right bottom). Except for PBS, other groups caused apoptosis, and the last group was the most severe and the qualification (B). (C) q-rtPCR of cDNA reversed from mRNA extracted from cells after the administration of peptide-SiCN or peptide-SiRNA. (D) Western blot assays indicated that peptide did not decrease the expression of SURVIVIN while peptide-RNA did. *** p < 0.001, n = 3.
5. Anti-Tumor Effects In Vivo
After gaining the results above, we wondered if this medication effect would be consistent when curing tumors in vivo. Thus, we injected MDA-MB-231 cells into BALB/c nude mice and then we used our drug systems to treat them. Figure 7A illustrated that there were no significant changes in body weight, which suggested the good biocompatibility of our nano vehicles. Figure 7B–D showed that both peptide-RNA and DOX can significantly restrain the growth of tumors. Notably, peptide-RNA-DOX can further inhibit tumor cells. However, some injuries can be observed on the heart when DOX was injected. These results supported the anti-tumor effects of our vehicles.
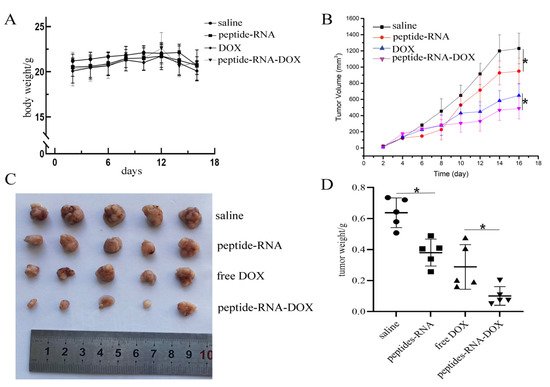
Figure 7. In vivo experiments. (A) Body weights of mice in four groups including PBS, peptide-RNA, free DOX, and peptide-RNA-DOX, which illustrated that there were no significant changes in different groups. (B) The tumor volumes of four groups during the therapy period. The chart illustrated that there were significant changes when using PBS and peptide-RNA. Additionally, peptide-RNA-DOX significantly decreased tumor volumes than DOX. (C) The photograph of tumors extracted from mice after tumors were fixed, which indicated the same trend as above. (D) Each weight of the fixed tumor. * p < 0.05, n = 5.
References
- Ganju, A.; Khan, S.; Hafeez, B.B.; Behrman, S.W.; Yallapu, M.M.; Chauhan, S.C.; Jaggi, M. miRNA nanotherapeutics for cancer. Drug Discov. Today 2016, 22, 424–432.
- Jia, F.; Li, Y.; Deng, X.; Wang, X.; Cui, X.; Lu, J.; Pan, Z.; Wu, Y. Self-assembled fluorescent hybrid nanoparticles-mediated collaborative lncRNA CCAT1 silencing and curcumin delivery for synchronous colorectal cancer theranostics. J. Nanobiotechnol. 2021, 19, 238.
- Li, Y.; Chen, G.; He, Y.; Yi, C.; Zhang, X.; Zeng, B.; Huang, Z.; Deng, F.; Yu, D. Selenomethionine-Modified Polyethylenimine-Based Nanoparticles Loaded with miR-132-3p Inhibitor-Biofunctionalized Titanium Implants for Improved Osteointegration. ACS Biomater. Sci. Eng. 2021, 7, 4933–4945.
- Zhang, H.; Cao, Y.; Xu, D.; Goh, N.S.; Demirer, G.S.; Cestellos-Blanco, S.; Chen, Y.; Landry, M.P.; Yang, P. Gold-Nanocluster-Mediated Delivery of siRNA to Intact Plant Cells for Efficient Gene Knockdown. Nano Lett. 2021, 21, 5859–5866.
- Delyanee, M.; Akbari, S.; Solouk, A. Amine-terminated dendritic polymers as promising nanoplatform for diagnostic and therapeutic agents’ modification: A review. Eur. J. Med. Chem. 2021, 221, 113572.
- Shi, M.; Wang, Y.; Zhao, X.; Zhang, J.; Hu, H.; Qiao, M.; Zhao, X.; Chen, D. Stimuli-Responsive and Highly Penetrable Nanoparticles as a Multifunctional Nanoplatform for Boosting Nonsmall Cell Lung Cancer siRNA Therapy. ACS Biomater. Sci. Eng. 2021, 7, 3141–3155.
- Regnstrom, K.; Ragnarsson, E.G.; Koping-Hoggard, M.; Torstensson, E.; Nyblom, H.; Artursson, P. PEI—A potent, but not harmless, mucosal immuno-stimulator of mixed T-helper cell response and FasL-mediated cell death in mice. Gene Ther. 2003, 10, 1575–1583.
- Chollet, P.; Favrot, M.C.; Hurbin, A.; Coll, J.L. Side-effects of a systemic injection of linear polyethylenimine-DNA complexes. J. Gene Med. 2002, 4, 84–91.
- Ferruti, P.; Knobloch, S.; Ranucci, E.; Duncan, R.; Gianasi, E. A novel modification of poly(L-lysine) leading to a soluble cationic polymer with reduced toxicity and with potential as a transfection agent. Macromol. Chem. Phys. 1998, 199, 2565–2575.
- Tomalia, D.A.; Fréchet, J.M.J. Discovery of dendrimers and dendritic polymers: A brief historical perspective. J. Polym. Sci. Part A Polym. Chem. 2002, 40, 2719–2728.
- Sun, Y.; Jiao, Y.; Wang, Y.; Lu, D.; Yang, W. The strategy to improve gene transfection efficiency and biocompatibility of hyperbranched PAMAM with the cooperation of PEGylated hyperbranched PAMAM. Int. J. Pharm. 2014, 465, 112–119.
- Yang, M.; Yuan, C.; Shen, G.; Chang, R.; Xing, R.; Yan, X. Cyclic dipeptide nanoribbons formed by dye-mediated hydrophobic self-assembly for cancer chemotherapy. J. Colloid Interface Sci. 2019, 557, 458–464.
- Yang, J.; Song, J.I.; Song, Q.; Rho, J.Y.; Mansfield, E.D.H.; Hall, S.C.L.; Sambrook, M.; Huang, F.; Perrier, S. Hierarchical Self-Assembled Photo-Responsive Tubisomes from a Cyclic Peptide-Bridged Amphiphilic Block Copolymer. Angew. Chem. Int. Ed. 2020, 59, 8860–8863.
- Schnaider, L.; Brahmachari, S.; Schmidt, N.W.; Mensa, B.; Shaham-Niv, S.; Bychenko, D.; Adler-Abramovich, L.; Shimon, L.J.W.; Kolusheva, S.; DeGrado, W.F.; et al. Self-assembling dipeptide antibacterial nanostructures with membrane disrupting activity. Nat. Commun. 2017, 8, 1365.
- Hamley, I.W. Self-assembly of amphiphilic peptides. Soft Matter. 2011, 7, 4122–4138.
- Reches, M.; Gazit, E. Casting Metal Nanowires within Discrete Self-Assembled Peptide Nanotubes. Science 2003, 300, 625–627.
- Li, Q.; Jia, Y.; Dai, L.; Yang, Y.; Li, J. Controlled Rod Nanostructured Assembly of Diphenylalanine and Their Optical Waveguide Properties. ACS Nano 2015, 9, 2689–2695.
- Ariga, K.; Li, J.; Fei, J.; Ji, Q.; Hill, J.P. Nanoarchitectonics for Dynamic Functional Materials from Atomic-/Molecular-Level Manipulation to Macroscopic Action. Adv. Mater. 2016, 28, 1251–1286.
- Reches, M.; Gazit, E. Formation of Closed-Cage Nanostructures by Self-Assembly of Aromatic Dipeptides. Nano Lett. 2004, 4, 581–585.
- Liberato, M.S.; Kogikoski, S.; da Silva, E.R.; de Araujo, D.R.; Guha, S.; Alves, W.A. Polycaprolactone fibers with self-assembled peptide micro/nanotubes: A practical route towards enhanced mechanical strength and drug delivery applications. J. Mater. Chem. B 2016, 4, 1405–1413.
- Agrawal, P.; Bhalla, S.; Usmani, S.S.; Singh, S.; Chaudhary, K.; Raghava, G.P.; Gautam, A. CPPsite 2.0: A repository of experimentally validated cell-penetrating peptides. Nucleic Acids Res. 2016, 44, D1098–D1103.
- Pujals, S.; Fernandez-Carneado, J.; Lopez-Iglesias, C.; Kogan, M.J.; Giralt, E. Mechanistic aspects of CPP-mediated intracellular drug delivery: Relevance of CPP self-assembly. Biochim. Biophys. Acta Biomembr. 2006, 1758, 264–279.
- Taylor, R.E.; Zahid, M. Cell Penetrating Peptides, Novel Vectors for Gene Therapy. Pharmaceutics 2020, 12, 225.
- Liu, Y.; Mei, L.; Xu, C.; Yu, Q.; Shi, K.; Zhang, L.; Wang, Y.; Zhang, Q.; Gao, H.; Zhang, Z.; et al. Dual Receptor Recognizing Cell Penetrating Peptide for Selective Targeting, Efficient Intratumoral Diffusion and Synthesized Anti-Glioma Therapy. Theranostics 2016, 6, 177–191.
- Wang, K.; Song, Y.; Su, Y.; Liang, Y.; Wang, L. Effect of the hairpin structure of peptide inhibitors on the blockade of PD-1/PD-L1 axis. Biochem. Biophys. Res. Commun. 2020, 527, 453–457.
- Silva, R.F.; Araujo, D.R.; Silva, E.R.; Ando, R.A.; Alves, W.A. L-diphenylalanine microtubes as a potential drug-delivery system: Characterization, release kinetics, and cytotoxicity. Langmuir 2013, 29, 10205–10212.
- Lin, Y.X.; Wang, Y.; Blake, S.; Yu, M.; Mei, L.; Wang, H.; Shi, J. RNA Nanotechnology-Mediated Cancer Immunotherapy. Theranostics 2020, 10, 281–299.
- Dowdy, S.F. Overcoming cellular barriers for RNA therapeutics. Nat. Biotechnol. 2017, 35, 222–229.
- Abe, K.; Fujiyoshi, Y. Cryo-electron microscopy for structure analyses of membrane proteins in the lipid bilayer. Curr. Opin. Struct. Biol. 2016, 39, 71–78.
- Yonenuma, R.; Ishizuki, A.; Nakabayashi, K.; Mori, H. Synthesis and Hierarchical Self-Assembly of Diphenylalanine-Based Homopolymer and Copolymers by RAFT Polymerization. J. Polym. Sci. Part A Polym. Chem. 2019, 57, 2562–2574.
- Ulijn, R.V.; Smith, A.M. Designing peptide-based nanomaterials. Chem. Soc. Rev. 2008, 37, 664–675.
- Khan, O.; Giles, J.R.; McDonald, S.; Manne, S.; Ngiow, S.F.; Patel, K.P.; Werner, M.T.; Huang, A.C.; Alexander, K.A.; Wu, J.E.; et al. TOX transcriptionally and epigenetically programs CD8+ T cell exhaustion. Nature 2019, 571, 211–218.
- Groner, B.; Weiss, A. Targeting survivin in cancer: Novel drug development approaches. BioDrugs 2014, 28, 27–39.
More
Information
Subjects:
Materials Science, Biomaterials
Contributor
MDPI registered users' name will be linked to their SciProfiles pages. To register with us, please refer to https://encyclopedia.pub/register
:
View Times:
1.3K
Entry Collection:
Biopharmaceuticals Technology
Revisions:
2 times
(View History)
Update Date:
14 Dec 2021
Table of Contents


Notice
You are not a member of the advisory board for this topic. If you want to update advisory board member profile, please contact office@encyclopedia.pub.
OK
Confirm
Only members of the Encyclopedia advisory board for this topic are allowed to note entries. Would you like to become an advisory board member of the Encyclopedia?
Yes
No
${ textCharacter }/${ maxCharacter }
Submit
Cancel
Back
Comments
${ item }
|
${ item.createdUser.fullName }
${ item.createdAt }
${ item.vote }
${ item.reply }
Delete
${ reply.createdUser.fullName }
${ reply.createdAt }
${ reply.vote }
Delete
There is no reply to this comment~
${ item.replyTextCharacter }/${ item.replyMaxCharacter }
Submit
Cancel
More
No more~
There is no comment~
${ textCharacter }/${ maxCharacter }
Submit
Cancel
${ selectedItem.replyTextCharacter }/${ selectedItem.replyMaxCharacter }
Submit
Cancel
Confirm
Are you sure to Delete?
Yes
No