Based on the results of the first experiment, in the second experiment the effects of light intensity were tested in plants grown under 16 h/8 h light/dark period, and leaf and root samples were collected after 4 h of illumination. Plants were grown either at elevated (L1: 500 µmol m−2 s−1), medium (L2: 250 µmol m−2 s−1) or low (L3: 50 µmol m−2 s−1) light intensities.
Different light intensities caused pronounced differences in the PA contents in the leaves but not in the roots. In the leaves, in parallel with the decrease of the light intensity, the level of PUT and SPD decreased, the amount of SPM did not change, while the DAP content increased. In the roots, no remarkable alteration could be detected in the PA contents of plants without any PA treatment under the different light intensity conditions.
In general, the PA treatments increased the endogenous PA contents both in the leaves and roots, interestingly especially under L2 condition in the leaves and under L3 condition in the roots.
Under the highest light condition, exogenous PAs did not influence the endogenous PA content in the leaves, but under lower light intensities (L2 and L3) the initially lower PUT contents showed increments (Figure 4A). Although the initial SPD content was also lower under L2 than it was found under L1, SPD and SPM treatments could double its level, while under L3 the further decreased initial SPD level could not be influenced by the PA treatments (Figure 4B). None of the treatments could influence the SPM level (Figure 4C). The leaf DAP content was slightly increased after PUT application under L1 and after SPM treatment under L2, but as its level was already high under L3 light intensity without PA application, exogenous PAs could hardly affect it (Figure 4D). In parallel with these, in the roots the changes of PUT, SPM and DAP contents showed almost the same pattern (Figure 5A–D). Namely, the light conditions alone did not influence them, but the PA treatments induced their accumulation especially under the lowest light intensity (L3). The SPD content showed only slight and similar but statistically not significant increase after PA treatments under different light conditions (Figure 5B).
Figure 4. Effect of different light intensities on the polyamine pattern (A: PUT: putrescine, B: SPD: spermidine, C: SPM: spermine, D: DAP: 1,3-diaminopropane) in the leaves of plants grown under 16 h/8 h day/night light period with different light intensity conditions: 500 (elevated light: L1), 250 (medium light: L2) and 50 (low light: L3) µmol m2 s−1 LED light after 7 days of 0.3 mM exogenous putrescine (PUT), spermidine (SPD) or spermine (SPM) treatments or without any treatment (C). Data represent mean values ± SD. Different letters indicate significant differences at p ≤ 0.05 level, among all the values of the given compounds.
Figure 5. Effect of different light intensities on the polyamine pattern (A: PUT: putrescine, B: SPD: spermidine, C: SPM: spermine, D: DAP: 1,3-diaminopropane) in the roots of plants grown under 16 h/8 h day/night light period with different light intensity conditions: 500 (elevated light: L1), 250 (medium light: L2) and 50 (low light: L3) µmol m2 s−1 LED light after 7 days of 0.3 mM exogenous putrescine (PUT), spermidine (SPD) or spermine (SPM) treatments or without any treatment (C). PUT: putrescine, SPD: spermidine, SPM: spermine, DAP: 1,3-diaminopropane. Data represent mean values ± SD. Different letters indicate significant differences at p ≤ 0.05 level, among all the values of the given compounds.
Overall, a positive correlation was found between the light intensity and total PA contents of the leaves. In addition, it appears that the highest accumulation inducing effect of the PA treatments could be detected under L2 in the leaves, while in the roots it could be found under L3 conditions, compared to the relevant control. Nevertheless, the highest PUT/(SPD + SPM) ratio was found after PA treatments under L3 conditions in both the leaves and roots (Figure 6).
Figure 6. Effect of light intensity on the total polyamine (PA) content in the leaves (A) and roots (B) of plants grown under 16 h/8 h day/night light period with different light intensity conditions: 500 (elevated light: L1), 250 (medium light: L2) and 50 (low light: L3) µmol m2 s−1 LED light after 7 days of 0.3 mM exogenous putrescine (PUT), spermidine (SPD) or spermine (SPM) treatments or without any treatment (C). Numbers indicate the ratio of PUT/(SPD + SPM).
The two main pathways responsible for PUT synthesis are the arginine and the ornithine pathways, catalyzed by arginine decarboxylase (ADC) and ornithine decarboxylase (ODC), respectively. The light intensity alone did not influence the ADC or ODC expression. Despite the pronounced PA treatment-induced increases of leaf PUT levels, especially in the case of higher PAs under L2 or L3 light conditions, the gene expression level of ADC in the leaves did not change remarkably, except for a slight but statistically significant decrease of it in PA-treated plants under L2 (Figure 7A). At the same time, the transcript level of ODC showed a slight, not always statistically significant, increase after SPM treatment under all light conditions (Figure 7B). From PUT the higher PAs (SPD and SPM) are synthesized with the involvement of spermidine synthase (SPDS) and S-adenosylmethionine decarboxylase (SAMDC) and their gene expressions were not modified by the light quantity. However, the gene expression pattern of SPDS and SAMDC in the leaves showed slight decreasing tendencies after PA treatments under all light conditions, with the lowest expression found after SPM application (Figure 7C,D). Nevertheless, the initial SPDS transcript levels and changes in them did not correlate with the differences in the SPD or SPM contents measured after the different treatments. The expression of perPAO, which encodes the peroxisomal PAO responsible for the back-conversion of higher PAs to PUT, was only induced under L1 light after PA treatments in the leaves; but at lower light intensities, it was inhibited by the exogenous PAs (Figure 7E). At the same time, the expression level of polyamine oxidase (PAO), which is responsible for the terminal catabolism of PAs, was induced under L3 conditions after all PA treatments, especially SPM (Figure 7F).
Figure 7. Effect of different light intensities on the gene expression patterns of arginine decarboxylase (A: ADC), ornithine decarboxylase (B) (ODC), spermidine synthase (C) (SPDS), S-adenosylmethionine decarboxylase (D) (SAMDC), peroxisomal polyamine oxidase (E) (perPAO) and polyamine oxidase (F) (PAO) in the leaves of plants grown under 16 h/8 h day/night light period with different light intensity conditions: 500 (elevated light: L1), 250 (medium light: L2) and 50 (low light: L3) µmol m2 s−1 LED light after 7 days of 0.3 mM exogenous putrescine (PUT), spermidine (SPD) or spermine (SPM) treatments or without any treatment (C). Data represent mean values ± SD. Different letters indicate significant differences at p ≤ 0.05 level, among all the values of the given compounds.
In contrast to the leaves, in the roots the PA-induced level of ADC transcript under L2 and L3 lights and that of ODC under L1 and L2 was in parallel with the higher PUT levels, which means that exogenous PAs induced in vivo PUT synthesis (Figure 8A,B). In the case of ODC, the expression level showed a dramatic increase after PUT treatment at L1 and L2 (Figure 8B). However, both ADC and ODC expressions were inhibited by PUT treatment under the lowest light condition, possibly due to the negative feedback mechanism induced by the taken up PUT. The gene expression pattern of SPDS in the roots was similar to the one observed for the leaves, and although especially the SPM treatment increased the endogenous SPD and SPM contents under all the applied light conditions, the SPDS expression could not have been responsible for these alterations (Figure 8C). The same can be claimed for SAMDC (Figure 8D). In addition, none of the genes involved in PA synthesis (ADC, ODC, SPDS and SAMDC) were influenced by the light intensity alone. Like in the case of the leaves, the highest level of DAP was observed in SPD- and SPM-treated plants under L3 light, where lower perPAO transcript levels were measured in the roots (Figure 8E). The gene encoding the investigated polyamine oxidase (PAO) isoform was not expressed in the roots.
Figure 8. Effect of different light intensities on the gene expression patterns of arginine decarboxylase (A) (ADC), ornithine decarboxylase (B) (ODC), spermidine synthase (C) (SPDS), S-adenosylmethionine decarboxylase (D) (SAMDC), peroxisomal and polyamine oxidase (E) (perPAO) in the roots of plants grown under 16 h/8 h day/night light period with different light intensity conditions: 500 (elevated light: L1), 250 (medium light: L2) and 50 (low light: L3) µmol m2 s−1 LED light after 7 days of 0.3 mM exogenous putrescine (PUT), spermidine (SPD) or spermine (SPM) treatments or without any treatment (C). Data represent mean values ± SD. Different letters indicate significant differences at p ≤ 0.05 level, among all the values of the given compounds.
In relation to the terminal catabolism of PAs, the contents of two important compounds—β-alanine and γ-aminobutyric acid (GABA), which are both involved in stress responses—were determined. β-alanine is synthetized from DAP, while GABA is synthesized during the terminal catabolism of PUT via Δ1-pyrroline in the reactions both catalyzed by NAD+-dependent 4-aminoaldehyde dehydrogenase (AMADH). Thus, changes in the levels of these compounds may also reflect the intensity of the catabolite side of PA metabolism. Despite the observed differences in the leaf DAP content, the amount of β-alanine in the leaves did not change remarkably during none of the treatments (Figure 9A). Interestingly, although DAP content in the roots increased by exogenous PAs especially at L3, the level of β-alanine increased after PA treatments only under L1 and L3 light conditions with the highest level in the SPM-treated plants at L1 (Figure 9B). The changes in GABA content also showed partly different patterns compared to its precursor, PUT. Although in the leaves GABA level decreased under the lowest light intensity as it was found for leaf PUT content, its levels decreased after PA treatments, especially under L1 and L2 light condition (Figure 9C) in contrast to the amount of PUT. In the roots GABA content also decreased under L3 compared to L1 like the level of PUT, but increased after SPM treatment in plants grown only at L1 and L2 (Figure 9D).
Figure 9. Effect of different light intensities on the levels of β-alanine (A,B) and γ-aminobutyric acid (GABA) (C,D) in the leaves (A,C) and roots (B,D) of plants grown under 16 h/8 h day/night light period with different light intensity conditions: 500 (elevated light: L1), 250 (medium light: L2) and 50 (low light: L3) µmol m2 s−1 LED light after 7 days of 0.3 mM exogenous putrescine (PUT), spermidine (SPD) or spermine (SPM) treatments or without any treatment (C). PUT: putrescine, SPD: spermidine, SPM: spermine, GABA: γ-aminobutyric acid. Data represent mean values ± SD. Different letters indicate significant differences at p ≤ 0.05 level, among all the values of the given compounds.
1.2.3. Differences in the Salicylic Acid and Abscisic Acid Contents and Synthesis
As previous results revealed that PA treatments influence the synthesis of certain plant hormones, one of our special aims was to reveal the relationship between the PAs metabolism and SA and ABA contents and synthesis, under different light intensity conditions. At lower light intensities, lower SA level was detected, especially in the roots (Figure 10A,C). Among PAs, only SPM treatment could provoke significant changes, as the level of leaf SA increased under L2 but decreased under L1 and L3 (Figure 10A). In contrast, the ABA content was lower at L1 and PUT and SPD treatments increased it, while SPM decreased it (Figure 10B). Slight increase in the ABA content was observed after the PA treatments, under L2 and L3 conditions (Figure 10B).
Figure 10. Effect of different light intensities on the salicylic acid (SA) (A,C) and abscisic acid (ABA) (B,D) content in the leaves (A,B) and roots (C,D) of plants grown under 16 h/8 h day/night light period with different light intensity conditions: 500 (elevated light: L1), 250 (medium light: L2) and 50 (lower light: L3) µmol m2 s−1 LED light after 7 days of 0.3 mM exogenous putrescine (PUT), spermidine (SPD) or spermine (SPM) treatments or without any treatment (C). Data represent mean values ± SD. Different letters indicate significant differences at p ≤ 0.05 level, among all the values of the given compounds.
In the roots, besides the positive correlation between the light intensity and the SA content under control condition, the PA applications caused further changes in the SA level depending on the light intensity, as exogenous PAs under L1 decreased, under L2 they increased it, while under L3 only SPD could increase it slightly (Figure 10C). In contrast, the initial ABA content was similar under all light conditions, while exogenous PA influenced it in a similar way, namely it increased it in all cases (Figure 10D).
The gene expression levels of the key enzymes involved in SA and ABA synthesis were also determined under the different light conditions and PA treatments. In the leaves, the phenylalanine-ammonia-lyase (PAL) expression level did not show relation to the changes in the leaf SA content, as under L1 and L2 conditions slight inhibition, but under L3 pronounced induction of it was found after the treatments with SPD or SPM (Figure 11A). The chorismate synthase (CS) transcript level was hardly influenced by the applied treatments (Figure 11B), while the expression level of isochorismate synthase (ICS) was significantly increased by PUT treatment under L1 and L2 light conditions and decreased under L3 after SPD or SPM treatments (Figure 11C). Thus, the only direct connection between the gene expression data and SA content in the leaves is that the lowest SA content and ICS expression was measured in the SPM-treated plants under L3 light conditions. The changes in 9-cis-epoxycarotenoid di-oxygenase (NCED) expression show only a few statistically significant differences, as under L1 its transcript level decreased in all the PA treatments, and under L3 light conditions it decreased in SPM treatment (Figure 11D).
Figure 11. Effect of different light intensities on the gene expression levels of phenylalanine-ammonia-lyase (A) (PAL), chorismate synthase (B) (CS), isochorismate synthase (C) (ICS) and 9-cis-epoxycarotenoid dioxygenase (D) (NCED) in the leaves of plants grown under 16 h/8 h day/night light period with different light intensity conditions: 500 (elevated light: L1), 250 (medium light: L2) and 50 (low light: L3) µmol m2 s−1 LED light after 7 days of 0.3 mM exogenous putrescine (PUT), spermidine (SPD) or spermine (SPM) treatments or without any treatment (C). Data represent mean values ± SD. Different letters indicate significant differences at p ≤ 0.05 level, among all the values of the given compounds.
Interestingly, in the roots, the expression of PAL showed similar pattern to the changes of SA content under L1 conditions (Figure 12A), while under L2 rather the expression levels of CS and ICS showed correlation with the changes of the root SA content (Figure 12B,C). Under L3 growth conditions, no reasonable changes were observed in the gene expression levels of PAL, CS or ICS. The PA treatment-induced changes in the expression level of NCED compared to the relevant control in the roots showed correlation with the root ABA content only under L1 conditions, as both the ABA and the NCED transcript levels increased after all PA treatments (Figure 12D).
Figure 12. Effect of different light intensities on the gene expression levels of phenylalanine-ammonia-lyase (A) (PAL), chorismate synthase (B) (CS), isochorismate synthase (C) (ICS) and 9-cis-epoxycarotenoid dioxygenase (D) (NCED) in the roots of plants grown under 16 h/8 h day/night light period with different light intensity conditions: 500 (elevated light: L1), 250 (medium light: L2) and 50 (low light: L3) µmol m2 s−1 LED light after 7 days of 0.3 mM exogenous putrescine (PUT), spermidine (SPD) or spermine (SPM) treatments or without any treatment (C). Data represent mean values ± SD. Different letters indicate significant differences at p ≤ 0.05 level, among all the values of the given compounds.
2. Conclusions
Although the protective and roborative effects of exogenous PAs are demonstrated under several conditions in various plant species including their photoprotective role, the light-related influence on the metabolism of PAs is less understood. According to these, the main hypothesis of this experiment was that different light periods or light intensities (i.e., different light quantities) influence the PA pool and metabolism in different ways and modify the effect of exogenous PAs.
Based on the two experiments, light induced the accumulation of polyamines in the leaves mainly via the induction of PUT, in parallel with a decrease in DAP content (Figure 13).
Figure 14 summarizes the significant changes in the PA metabolism induced by light intensity with PA treatments in both the leaves and roots. The results show that although light intensity alone has remarkable effect on the PA pool, under the relevant light conditions (elevated, medium, or low light), a steady state condition is established, and thus the gene expression levels are not influenced. However, when exogenous PA treatments were applied, the excess of PA induced different steps of the PA metabolism depending on the light conditions. Leaves and roots responded differently, obviously since light has greater effect in the leaves, while PA treatments in the roots. In addition, the effect of light in the leaves was dominant at elevated, while the most pronounced influence of PAs, especially that of SPM, was found under low light conditions.
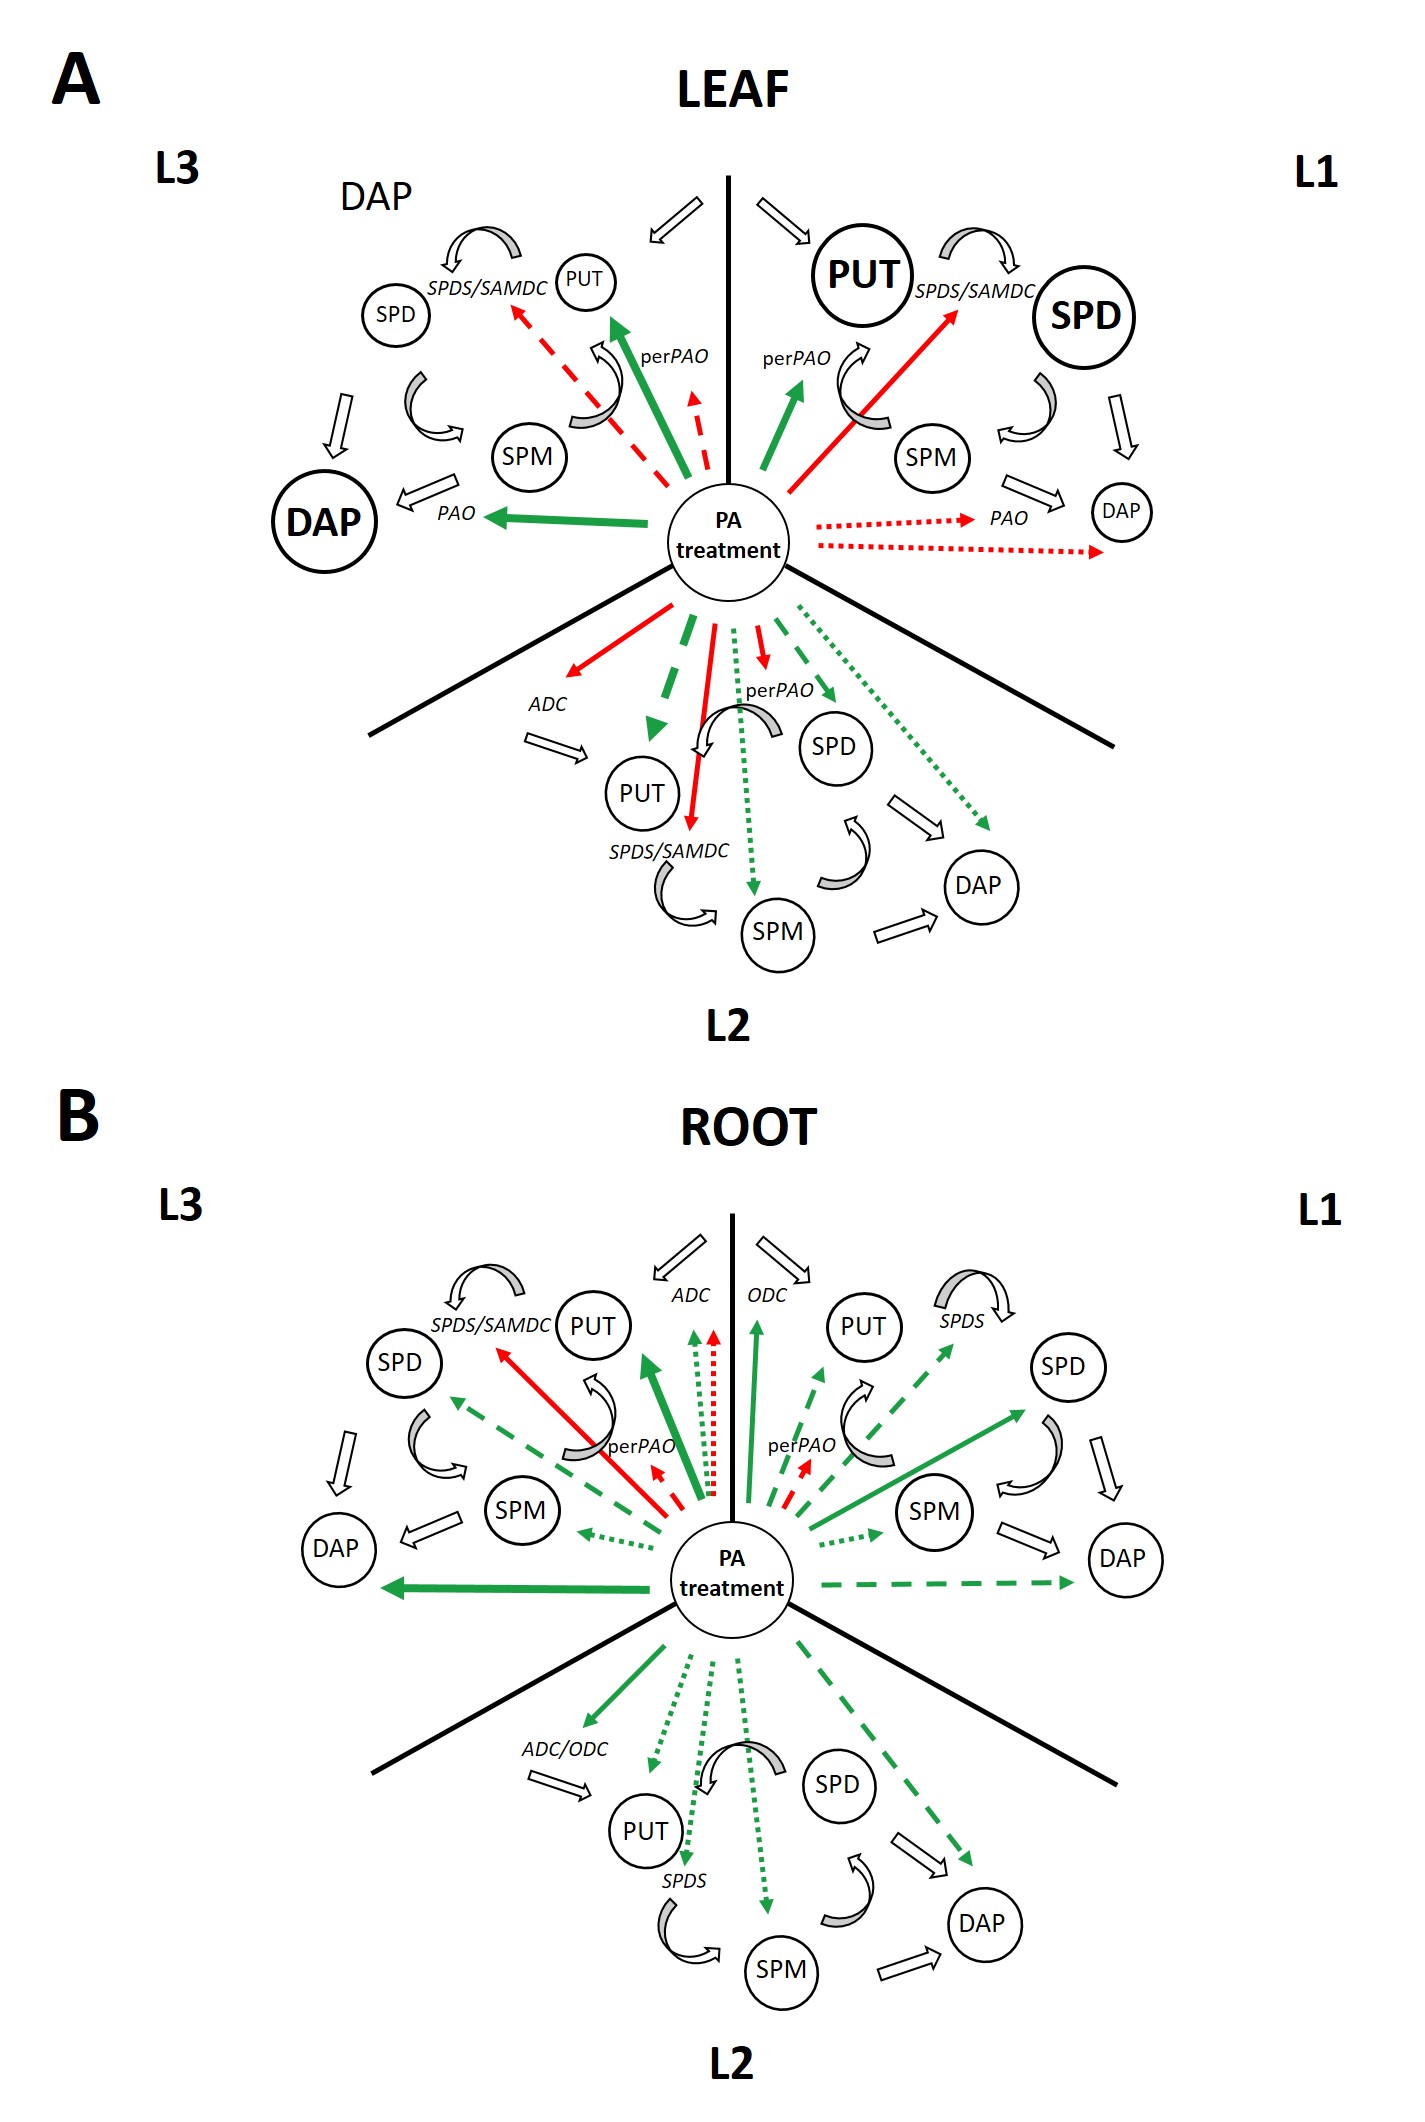
In the leaves, under elevated light conditions, due to the initially higher PUT and SPD content, PA treatments inhibited the synthesis of higher PAs but induced their back-conversion. Under medium light conditions, the gene expression of most enzymes involved in PA biosynthesis was inhibited. Furthermore, the perPAO expression also decreased, as no back-conversion is needed besides the increased PUT content. Under low light, PA treatments increased only the PUT content, leading to the inhibition of the PA synthesis and back conversion but induction of terminal catabolism.
In the roots, under higher light intensity, the PA treatments induced the in vivo PA synthesis, and instead of the back conversion, PAs canalized towards the terminal catabolism. Although the gene expression of the PA metabolite enzymes did not change under medium light conditions, the PA pool and DAP content were still increased by the PA treatments. Nevertheless, under low light, PA treatments exert the highest influence on PA metabolism, as especially after SPM treatment—due to the increased PA and DAP levels—further activation of the terminal catabolism was found.
The sufficiently modulated PA metabolism together with the induction of SA and ABA signaling could be responsible for the observed positive effect of exogenous PAs under lower light conditions; however, depending on the light intensity, different PA metabolism-modulating strategies can be successful. It should also be taken into consideration that other PA metabolism-related processes can also be involved. For example, the role of polyamine transporters in plants has only been recognized recently. Besides the different effect of the individual PAs on PA uptake transporters, light conditions can also influence their expression or activity, which in turn modulate the accumulation and metabolism of PAs in PA-treated plants.
 +1 credit


