Transcranial magnetic stimulation (TMS) neurophysiology has been widely applied worldwide, but it is often contaminated by confounders other than cortical stimulus-evoked activities. Although advanced sham coils that elaborately mimic active stimulation have recently been developed, their performance is not examined in detail. Developing such sham coils is crucial to improve the accuracy of TMS neurophysiology. Herein, we examined the specifications of the sham coil by comparison with the active coil. The magnetic flux and click sound pressure changes were measured when the stimulus intensity was varied from 10% to 100% maximum stimulator output (MSO), and the changes in coil surface temperature over time with continuous stimulation at 50% MSO for each coil. The magnetic flux change at the center of the coil showed a peak of 12.51 (kT/s) for the active coil, whereas it was 0.41 (kT/s) for the sham coil. Although both coils showed a linear change in magnetic flux as the stimulus intensity increased, due to the difference in coil winding structure, the sham coil took less than half the time to overheat and had 5 dB louder coil click sounds than the active coil. The sham coil showed a sufficiently small flux change at the center of the coil, but the flux change from the periphery of the coil was comparable to that of the active coil. Future use of high-quality sham coil will extend our understanding of the TMS neurophysiology of the cortex at the stimulation site.
1. Introduction
The ideal sham stimulation condition is one that adds scalp stimulation and sound stimulation sensations which are as identical as possible to the stimulation of the active coil, generating comparable magnetic field changes around the stimulation target as well. One sham stimulation condition that has been widely used in TMS research so far is to tilt the coil 45–90 degrees from the original stimulation position relative to the scalp and have the edge of the coil touch the scalp
[1][2]. Furthermore, one study also used a control condition by placing the stimulation coil on a body part away from the target site, such as the left scapula
[3]. Such methods make it possible to reduce the magnetic field to the target site; however, they cannot mimic somatic stimulus sensations, including pain sensation and muscle contraction over the stimulated site, and there are clear differences in psychological and physical responses for subjects due to the obvious gap in the stimulation site.
2. Analysis on Results
2.1. Monophasic Waveforms of the Active and Sham Coils
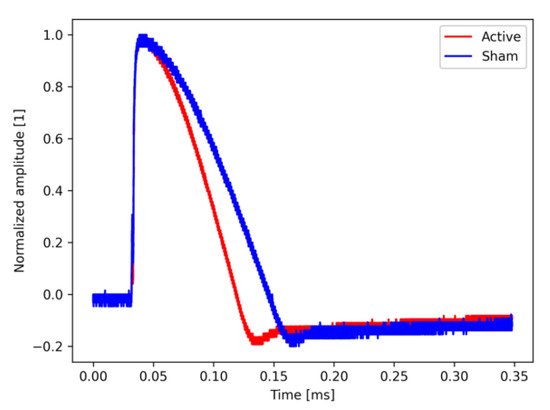
The amplitude of the waveform has been normalized so that the maximum value is 1. The pulse width of the monophasic waveform by the active coil was approximately 0.10 ms, whereas that of the monophasic waveform by the sham coil was approximately 0.13 ms (Figure 1). The pulse width of the sham stimulation was set wider than that of the active stimulation, which was adjusted so that the stimulation sensation during head stimulation was as equivalent as possible between the active and sham stimulation.
Figure 1. Monophasic waveform with active and sham coils. The horizontal axis shows the time and the vertical axis shows the amplitude normalized to 1 at the maximum value. The red line represents the active coil and the blue line indicates the sham coil.
2.2. Comparison of Magnetic Flux Changes in Each Coil
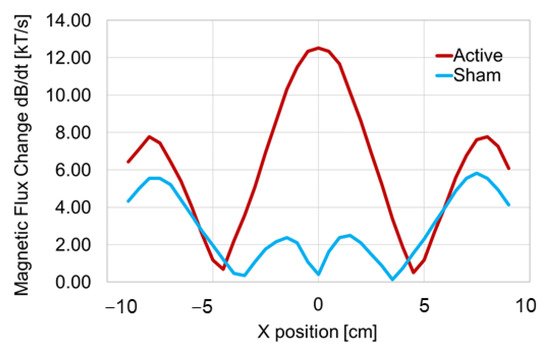
The magnetic flux changes for each coil position using the search coil are shown in Figure 2. In the active coil, three peaks of magnetic flux change were observed. The left and right peaks of magnetic flux change were located approximately 8 cm away from the center of the coil, and the left and right peaks of magnetic flux change were approximately 7.78 (kT/s). The peak with the largest magnetic flux change occurred at the center of the coil, with 12.51 (kT/s). On the other hand, four peaks were generated from the sham coil. The left and right peaks appeared at a distance of approximately 8 cm from the coil center, as in the active coil, and the magnetic flux changes were 5.55 (kT/s) (left) and 5.82 (kT/s) (right), respectively. The two peaks close to the coil center showed magnetic flux changes of 2.37 (kT/s) at −1.5 cm and 2.50 (kT/s) at 1.5 cm, respectively. For the sham coil, the magnetic flux change at the center of the coil was 0.41 (kT/s).
Figure 2. Schematic diagrams of the magnetic fields generated by the active and sham coils. The horizontal axis shows the position of the search coil in the coil to be measured and the vertical axis shows the magnetic flux change. The position of the search coil in the coil to be measured is shown on the horizontal axis, and the vertical axis shows the magnetic flux change. The center of the coil to be measured was set at X = 0 cm, and measurements were taken up to a position of 9 cm on either side. The red line represents the results of the active coil and the blue line shows the results of the sham coil. In the active coil, three peaks of magnetic flux change were observed, while in the sham coil, four peaks of magnetic flux change were observed.
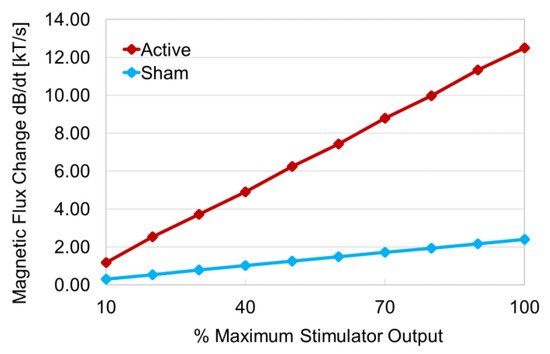
The magnetic flux changes in response to the stimulus intensity (MSO) of TMS were linear for each coil (Figure 3). For the active coil, the magnetic flux increased by approximately 1.26 (kT/s) for every 10% increase in MSO. On the other hand, for the sham coil, it increased by approximately 0.24 (kT/s) for every 10% increase in MSO. The magnetic flux changes at the minimum (10% MSO) and maximum (100% MSO) stimulus intensity of TMS in the experiment were 1.18 (kT/s) and 12.51 (kT/s) for the active coil, and 0.30 (kT/s) and 2.40 (kT/s) for the sham coil, respectively. The results for the periphery of the coils were as follows: left wing (−9~−5 cm): t16 = 1.27, p = 0.11; right wing (5~9 cm): t16 = 1.11, p = 0.14. On the other hand, the results for the center of the coils (−5~5 cm) were as follows: t36 = 5.79, p = 0.0000007. Thus, there was no significant difference in the flux change between the two coils at the periphery of both coils, but there was a significant difference in the flux change between the two coils at the center of the coil.
Figure 3. Relationship between magnetic flux and MSO strength. The horizontal axis shows the machine stimulator output (MSO) and the vertical axis indicates the magnetic flux change. MSO, which indicates the stimulus intensity of the TMS device, was increased from 10% to 100% in 10% intervals, and the magnetic flux change corresponding to each MSO for each coil was measured. The red line represents the measurement results of the active coil and the blue line shows the measurement results of the sham coil. In both coils, the magnetic flux change increased linearly with increasing stimulus intensity.
2.3. Coil Temperature Changes with Continuous Use of TMS
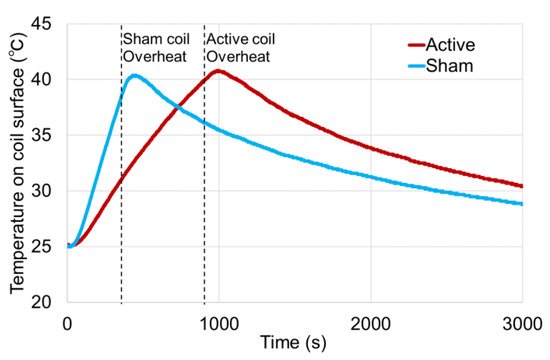
The change in coil surface temperature with continuous TMS use at 0.5 Hz at a stimulation intensity of 50% MSO is shown in Figure 4. In the active coil, the coil temperature reached 40.2 °C at 923 s from the start of stimulation and overheated. On the other hand, in the sham coil, the coil temperature reached 38.4 °C at 353 s after the start of stimulation and overheated. Even after overheating, the surface temperature of each coil increased to nearly 40.3 °C. As a safety margin, this TMS coil is set to automatically stop the output from the stimulator so the surface temperature will reach a maximum of approximately 41.0 °C.
Figure 4. Relationship between coil surface temperature and time course of 0.5 Hz continuous stimulation in the active and sham coils. The horizontal axis indicates the time of measurement from the start of stimulation and the vertical axis shows the surface temperature of the coil. The stimulation was performed with 50% MSO, continuous single-pulse stimulation. The red line shows the temperature change of the active coil while the blue line indicates the temperature change of the sham coil. The dashed line shows the timing when each coil automatically stopped stimulation as a safety measure due to temperature increase.
The increase in the coil surface temperature after the start of stimulation was almost linear in both active and sham coils, but the slope of the temperature increase in the sham coil was steeper than that in the active coil.
2.4. Comparison of the Click Sound Pressure Generated by the Active and Sham Coils during Stimulation
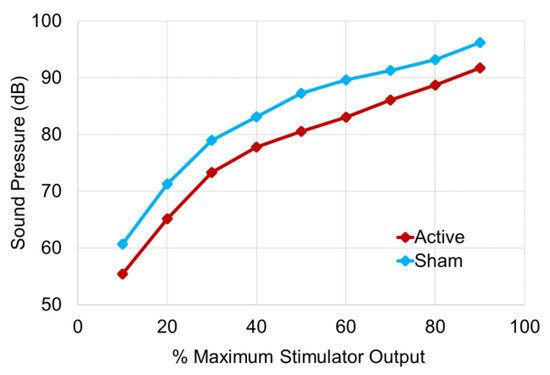
The sound pressure values of the coil click sound generated from each coil when the MSO was varied from 10% to 90% are shown in Figure 5. For the active coil, the sound pressure ranged from 55.4 dB to 91.7 dB, while for the sham coil, the sound pressure ranged from 60.7 dB to 96.2 dB. At all stimulus intensities, the click sound of the sham coil was approximately 5 dB higher than that of the active coil. The changes in sound pressure against stimulus intensity for both coils were parallel and showed a similar pattern of sound pressure change. The results of the statistical analysis on the difference in sound pressure of the click sound generated from both coils were as follows: 10% MSO: t18 = −19.5, p = 7.14 × 10⁻¹⁴; 20% MSO: t18 = −110.4, p = 3.05 × 10⁻²⁷; 30% MSO: t18 = −17.4, p = 5.23 × 10⁻¹³; 40% MSO: t18 = −105.1, p = 7.39 × 10⁻²⁷; 50% MSO: t18 = −92.0, p = 8.08 × 10⁻²⁶; 60% MSO: t18 = −24.0, p = 2.02 × 10⁻¹⁵; 70% MSO: t18 = −55.1, p = 8.04 × 10⁻²²; 80% MSO: t18 = −29.9, p = 4.35 × 10⁻¹⁷; 90% MSO: t18 = −33.9, p = 4.66 × 10⁻¹⁸, indicating a significant difference in sound pressure between the active and sham coils at all measurement points.
Figure 5. TMS click sound pressure during stimulation in the active and sham coils. The horizontal axis shows the stimulus intensity (MSO) and the vertical axis indicates the sound pressure. MSO was increased from 10% to 90% at 10% intervals, and the sound pressure corresponding to each stimulus intensity was measured for each coil. The red line shows the sound pressure of the click sound in the active coil while the blue line indicates the sound pressure in the sham coil. Each plot shows the average value of five measurements of the maximum value of five single stimulations.
3. Current Insights
3.1. Characteristics of Sham Coil
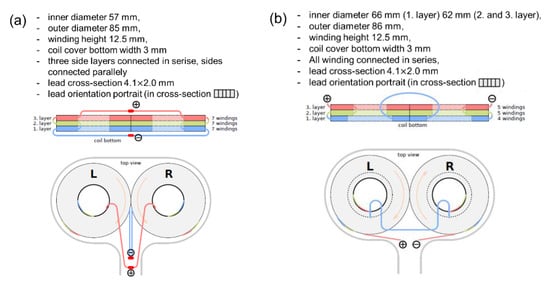
With regard to the coil design (Figure 6), the active coil was designed to have the current flow clockwise in the left coil and counterclockwise in the right coil, while the sham coil was designed to have the current flow clockwise in both coils. By such a coil design, the active coil shows the maximum magnetic flux at the point where the left and right coils intersect, while the sham coil generates magnetic flux in the opposite direction from each coil at the intersection point of the left and right coils, and these magnetic fluxes cancel each other out. Therefore, in the sham coil, magnetic stimulation from the center of the coil does not fire the cerebral cortex directly under the same area, but only provides stimulation sensation similar to the active stimulation. For the monophasic waveform, the pulse width of the sham stimulation was about 0.03 ms longer than that of the active stimulation (Figure 1). This was attributable to the result of adjusting the waveform pulse width so that the intensity and sensation of the stimulation subjectively perceived by human subjects were identical when both coils were placed on the head under the same conditions and stimulated with the same stimulation intensity.
Figure 6. Structure of active and sham coils and their parameters. (a) represents an active coil (DuoMAG 70BF) and (b) shows a special sham coil (DuoMAG 70BFP). The top row is a cross-sectional view of the coil from the side, while the bottom row is a plain view from the top. The red, green, and blue colored areas and lines in the cross-sectional view indicate the coil windings and their layers. The doughnut-shaped white area inside of the coil indicates the inner empty core of the coil winding. The plus and minus in the figure represent the direction of the current flow in the coil along with the orange arrows drawn inside the left and right coils on the top view.
The magnetic flux change of the sham coil at X = 0 cm, which is the intersection point of the left and right coils, was limited to approximately one-twelfth that of the active coil. The relationship between the stimulus intensity and the magnetic flux change shown in Figure 2 demonstrated that for the sham coil, the magnetic flux change was 1.25 (kT/s) at 50% MSO and 2.40 (kT/s) at 100% MSO, which was approximately 1.9 times higher. Since the relationship between the stimulus intensity and the magnetic flux change was almost linear, the flux change in the X-axis also changed linearly, and the flux change at 100% MSO was 0.41 × 1.9 = 0.779 (kT/s). In the case of the sham coil, the flux change was sufficiently small even at 100% MSO. The magnetic flux change from 10% to 90% MSO in the sham coil was lower than the flux change at 10% MSO in the active coil, and the flux change at 100% MSO in the sham coil was also less than the flux change at 20% MSO in the active coil. On the other hand, in the sham coil, the peak of the magnetic flux was observed at X = −2 cm and 2 cm. Furthermore, at X = −8 cm and 8 cm, the second height peaks of the magnetic flux change were generated for both the active and sham coils, and the scalp stimulation around the target area was biophysically designed to give almost the same stimulation sensation regardless of a sham coil or an active coil. The temperature increase in the coil up to overheating by the same stimulus intensity was about 2.5 times faster in the sham coil than in the active coil (Figure 4). This is considered to be due to the difference in the structure of the coils. Note that the coil used in this study was not equipped with a cooling system.
Regarding the click sound pressures from the TMS coils during stimulation, the sham coil was approximately 5 dB louder than the active coil at all intensities. This was probably due to the difference in monophasic pulse width as well as the winding structure of the coils. In both coils, the slope of the increase in sound pressure from 10% to 30% MSO was steep, while the slope of the increase in sound pressure from 30% to 90% MSO was mild, indicating a non-linear change. However, the slope of the tangent line was almost the same for both coils.
3.2. TMS-EEG Study Using Sham Condition
The method of tilting the active coil by 90 degrees does not provide any stimulating sensation to the scalp, thus it remains unclear whether it truly meets the sham condition. The method in which active stimulation is performed away from the scalp at the target site may cause unexpected responses originating from non-target sites (whether it be brain or shoulder stimulation), and the gap in the setting between the active and sham conditions is too large because the coil for the sham condition is not touching the target site in the first place. There is a method to induce an auditory stimulus response by generating a sound that mimics a coil click sound in the target area of the head, but subjects are likely to suspect that the stimulation would be fake because the actual mimicking sound and the stimulus sensation on the scalp are somehow different from those during active stimulation.
In the method of applying electrical stimulation with a pair of surface electrodes attached directly under the center of the TMS coil to mimic the pain sensation caused by scalp muscle contraction with TMS, the current flows through the scalp, muscles, and cerebrospinal fluid to produce some form of electric field (E-field) in the brain, but the nature of this E-field is originally different from that of the E-field formed by TMS pulses
[4]. In other words, in this sham stimulation condition, not only are the E-fields generated different between conditions, but also the electromagnetism effects of those E-fields on the brain would be different.
 +1 credit