 +1 credit
| Version | Summary | Created by | Modification | Content Size | Created at | Operation |
|---|---|---|---|---|---|---|
| 1 | Le Yu | + 2409 word(s) | 2409 | 2021-10-09 16:16:46 |
Video Upload Options
Released in 2005 by Google, Google Earth (GE) has become the most popular and successful virtual globe tool. GE has demonstrated its capacity for 3D global representation and visualization of geospatial data from local to global scales.
1. Introduction
Released in 2005 by Google, GE has become the most popular and successful virtual globe tool and can effectively address the first challenge mentioned above [1]. Later, similar products, such as NASA World Wind (released in 2004), Microsoft Virtual Earth (released in 2005, now Bing Maps Platform), ESRI ArcGIS Explorer (released in 2006), and Cesium (released in 2012), emerged [1][2]. The concept of Digital Earth (Virtual Earth) was initially proposed by former U.S. vice president Al Gore in 1998 and was described as a computer-generated three-dimensional virtual globe with visualization functions that were easy to use, were interoperable, and could be used for modeling and simulation [3]. Among the virtual globe tools described above, GE has proved to be the most popular and has advantages in terms of visualization, ease of access to a wide range of geospatial data, and a unified coordinate system; however, it still lacks extendibility [1]. In recent years, GE was used for research on geomorphology [4][5][6][7], ecology [8][9][10][11], geology [12][13][14], the atmosphere [15][16], disasters [17][18][19][20][21][22], social science [23], and urban studies [24][25][26][27], and has served as an essential tool in studies of global environmental change. In addition, GE was also widely used in education, especially in the teaching of geography, because of its great ability to provide virtual visualizations of the Earth [28][29][30]. According to the reviews by Yu and Gong [1], Goodchild [3], and Liang et al. [2], the advantages of GE can be divided into six categories related to visualization and data exploration, data collection, validation, data integration and interoperability, simulation, and ease of use. Although the use of GE as a digital globe is thriving because it provides easy-to-use visualizations, GE also has many limitations, including inconsistent image quality, a limited capability for making quantitative measurements, a lack of analytical functionality, and the inability to support precise global spatial simulations [1].
2. Scientometric Analysis
We used“Google Earth” as keywords to retrieve relevant articles and review articles from the Web of Science (WoS) (https://www.webofscience.com/) core collection, including the SCIE (Science Citation Index Expanded) and SSCI (Social Sciences Citation Index), dated up to January 2021. After screening, 1334 articles related to “Google Earth” were obtained. Then the CiteSpace, a powerful bibliometric analysis software [31] was used to analyze document co-citations, keyword co-occurrences, and cooperative maps, thus enabling the exploration of knowledge base, structural frameworks, and research frontiers in research that is based on GE.
2.1 Statistical characteristics
In the case of GE, there were three main stages: stage one (2006–2008), which was a period of slow development; stage two (2009–2015), which was a period of rapid development; and stage three (since 2016), which is a period of proliferation. In stage one – prior to 2008 – the application of GE and related research developed slowly as GE was not yet fully explored and its functions were limited. For example, many vital functions (e.g., historical imagery and support for 3D imagery) were not introduced until after 2008 (https://en.wikipedia.org/wiki/Google_Earth). Later, GE gradually became more widely used: dozens of articles were published every year, and the mean increase of citations increased to about 300 times per year. This trend of increased use continued after 2016 and, in 2020, 231 papers on GE were published and there were 5115 citations.
A total of 1334 articles describing the use of GE were published in 547 journals relating to fields such as remote sensing, computer science, the environment, and GIS (Figure 1). The top ten journals were Remote Sensing (89), The International Journal of Remote Sensing (35), Remote Sensing of Environment (30), Geomorphology (22), Computers and Geosciences (19), The IEEE Journal of Selected Topics in Applied Earth Observations and Remote Sensing (19), The Journal of Maps (19), The Journal of Applied Remote Sensing (17), PloS One (17), and Sustainability (16). The publications referencing GE spanned a broad spectrum of journals. However, more than half of all journals (376) published just one article on GE, and only 22 journals published more than ten.
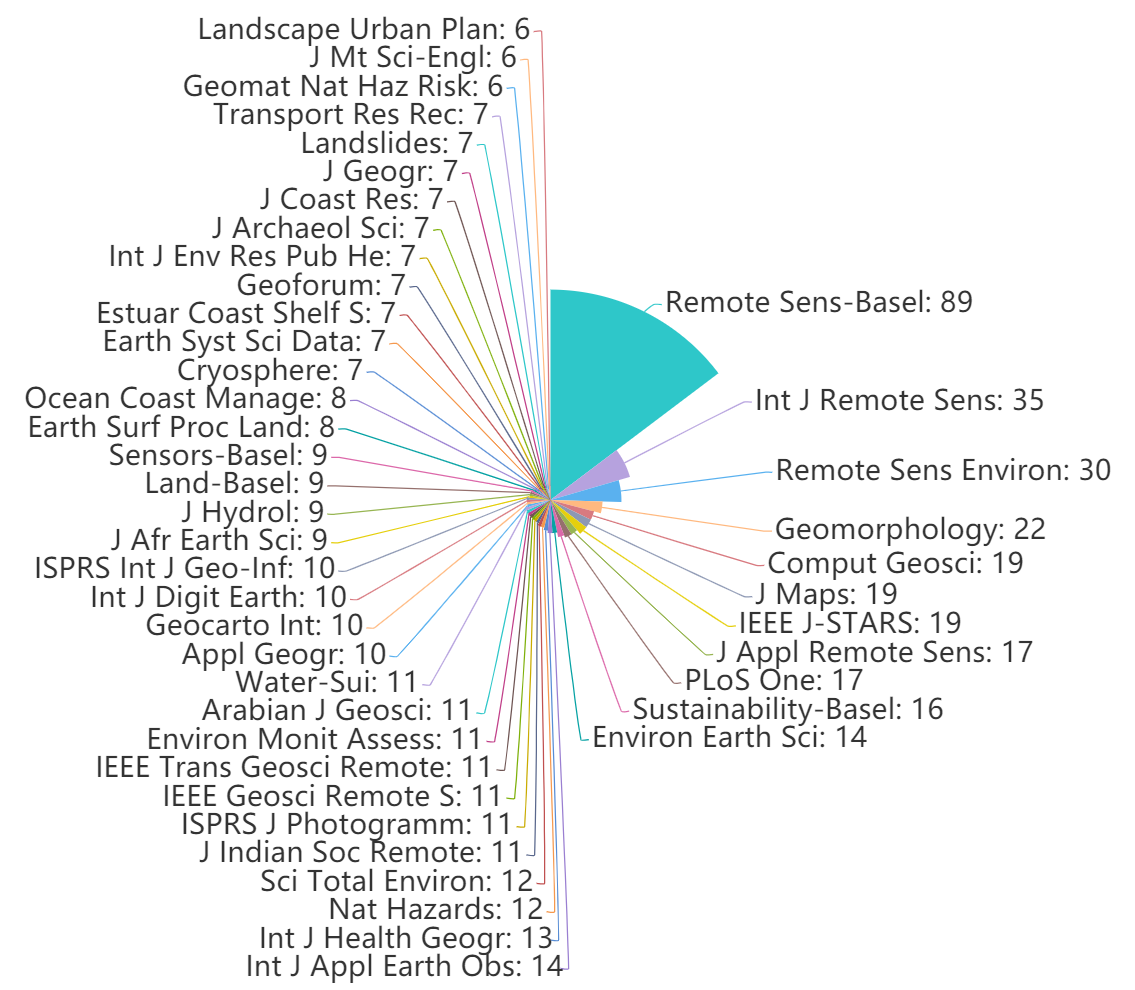 Figure 1. Journals in which papers related to GE were published
The GE publications found related to 102 different disciplines (Figure 2). The research areas with more than 100 related articles were in environmental sciences and ecology (415), remote sensing (295), geology (294), engineering (180), physical geography (162), imaging science and photographic technology (156), and water resources (108). These seven categories accounted for 62% of the total (Figure 2). In relation to the 102 disciplines, 48 research areas were found one or two times, and 66 were found fewer than ten times.
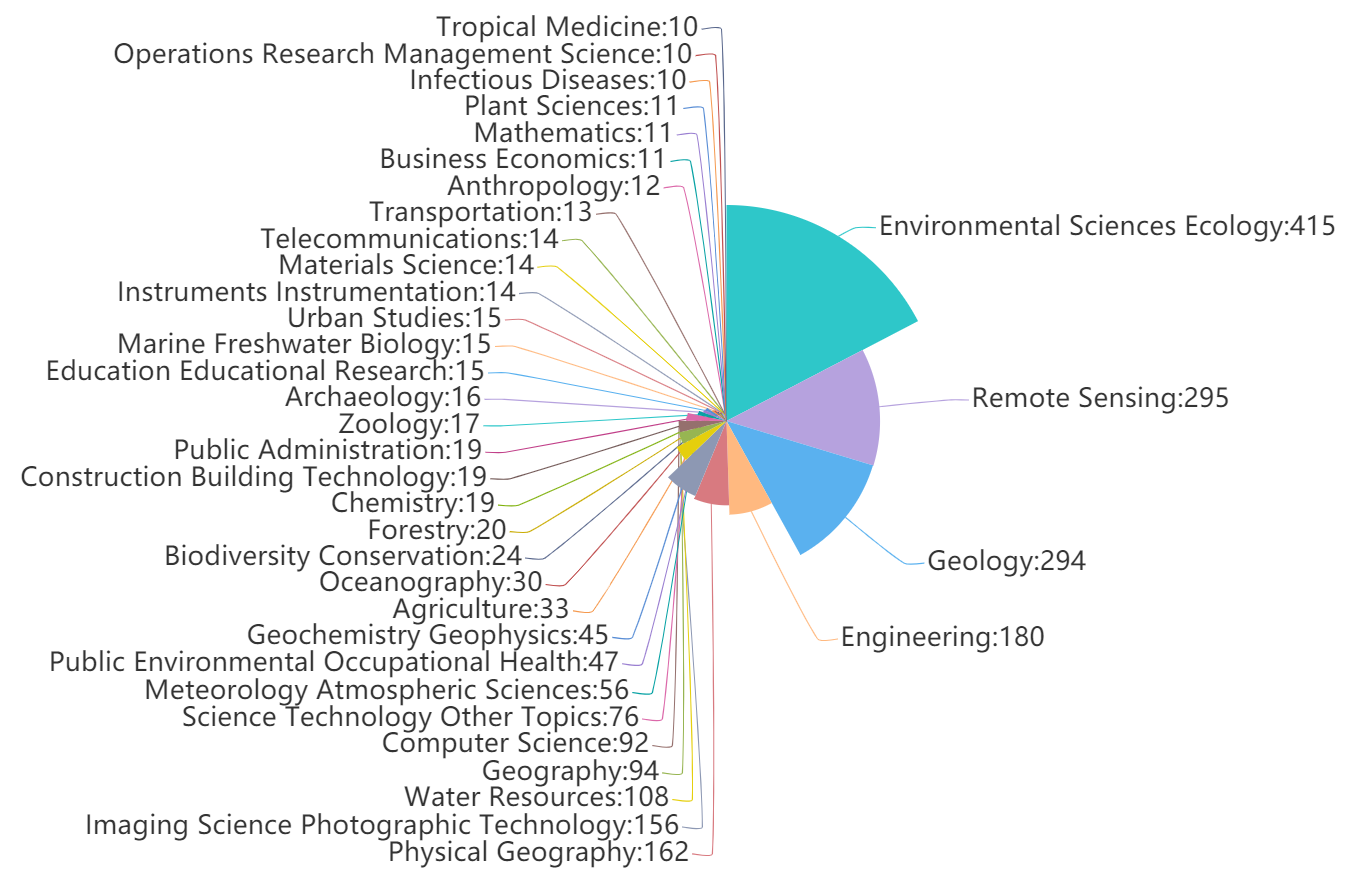 Figure 2. Research disciplines in which GE was applied
2.2 Subject structure analysis
Based on the analysis of keywords conducted on the literature related to GE (Figure 3), it was found that “high resolution” (referring to spatial resolution) had the highest frequency, with 1039 occurrences. GE provides free, easy, and stable high-spatial resolution satellite data of the whole globe. These data have good horizontal positional accuracy [32], but improvements to the consistency of the image quality are still required [1]. From Figure 3, it can be seen that the keywords with a large number of occurrences (larger areas in the figure) included “model”, “land cover”, “change detection”, “region”, “assessment”, “field”, “overall accuracy”, “estimated”, and “visualization”; these occur 743, 431, 412, 377, 356, 332, 307, 259, and 258 times, respectively. It can be observed from the keywords that 3D modeling based on the data provided by GE is one of the main ways in which GE was applied. That is, GE was the primary data provider for various land-cover observations. In addition, GE also served as a platform for displaying a wide range of geographic information, including information on water, forests, urban and other land cover types, vegetation indices, sample data, and other derived products. Sphere visualization is one of GE’s most distinctive techniques and enables GE to display heterogeneous data sets for use in academic communication. Thus, Earth system scientists can use GE as a tool to more easily conduct Earth system science research from a global perspective.
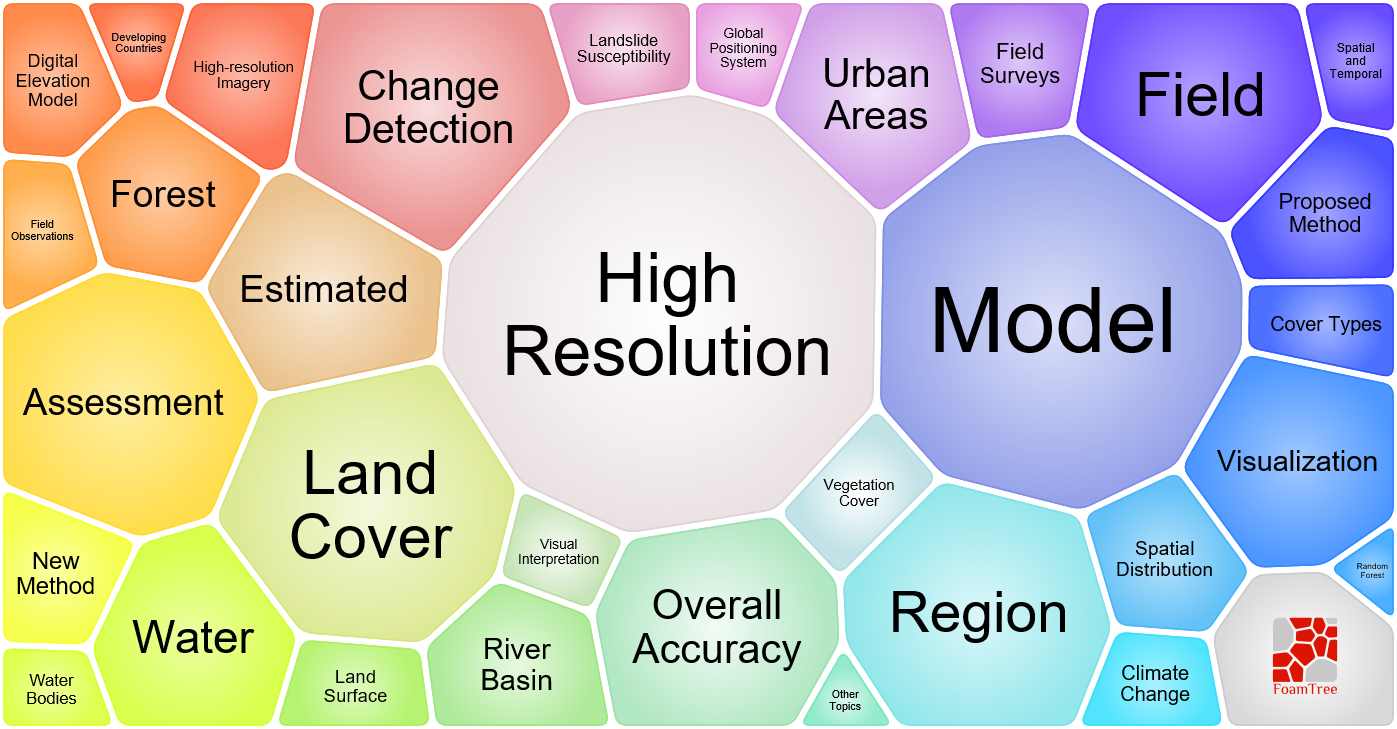 Figure 3. Keywords related to GE
As shown in Figure 4, during stage one (2006–2008), although the application of GE was then still in its infancy, many of the keywords used were consistent with future applications and included “Google Earth”, “GIS”, “model”, “Landsat”, “climate”, “China”, “time series”, and “remote sensing”. These keywords had a relatively high frequency, or betweenness centrality. In stage two (2009–2015), the application of GE entered a period of stable development. Again, many keywords that appeared during this period determined the primary research direction, and included “classification”, “land cover change”, “MODIS”, “change detection”, “accuracy”, “pattern”, “image classification”, “forest”, and “cover”. These keywords represented the main applications of GE during this period. In stage three (since 2016), the application of GE has boomed, and many new keywords were used. Among these new keywords, the ones that appeared most frequently were “CNN”, “neural network”, “soil”, “deep learning”, and “Sentinel”, which reflects the use of high-resolution images and artificial intelligence during this period.
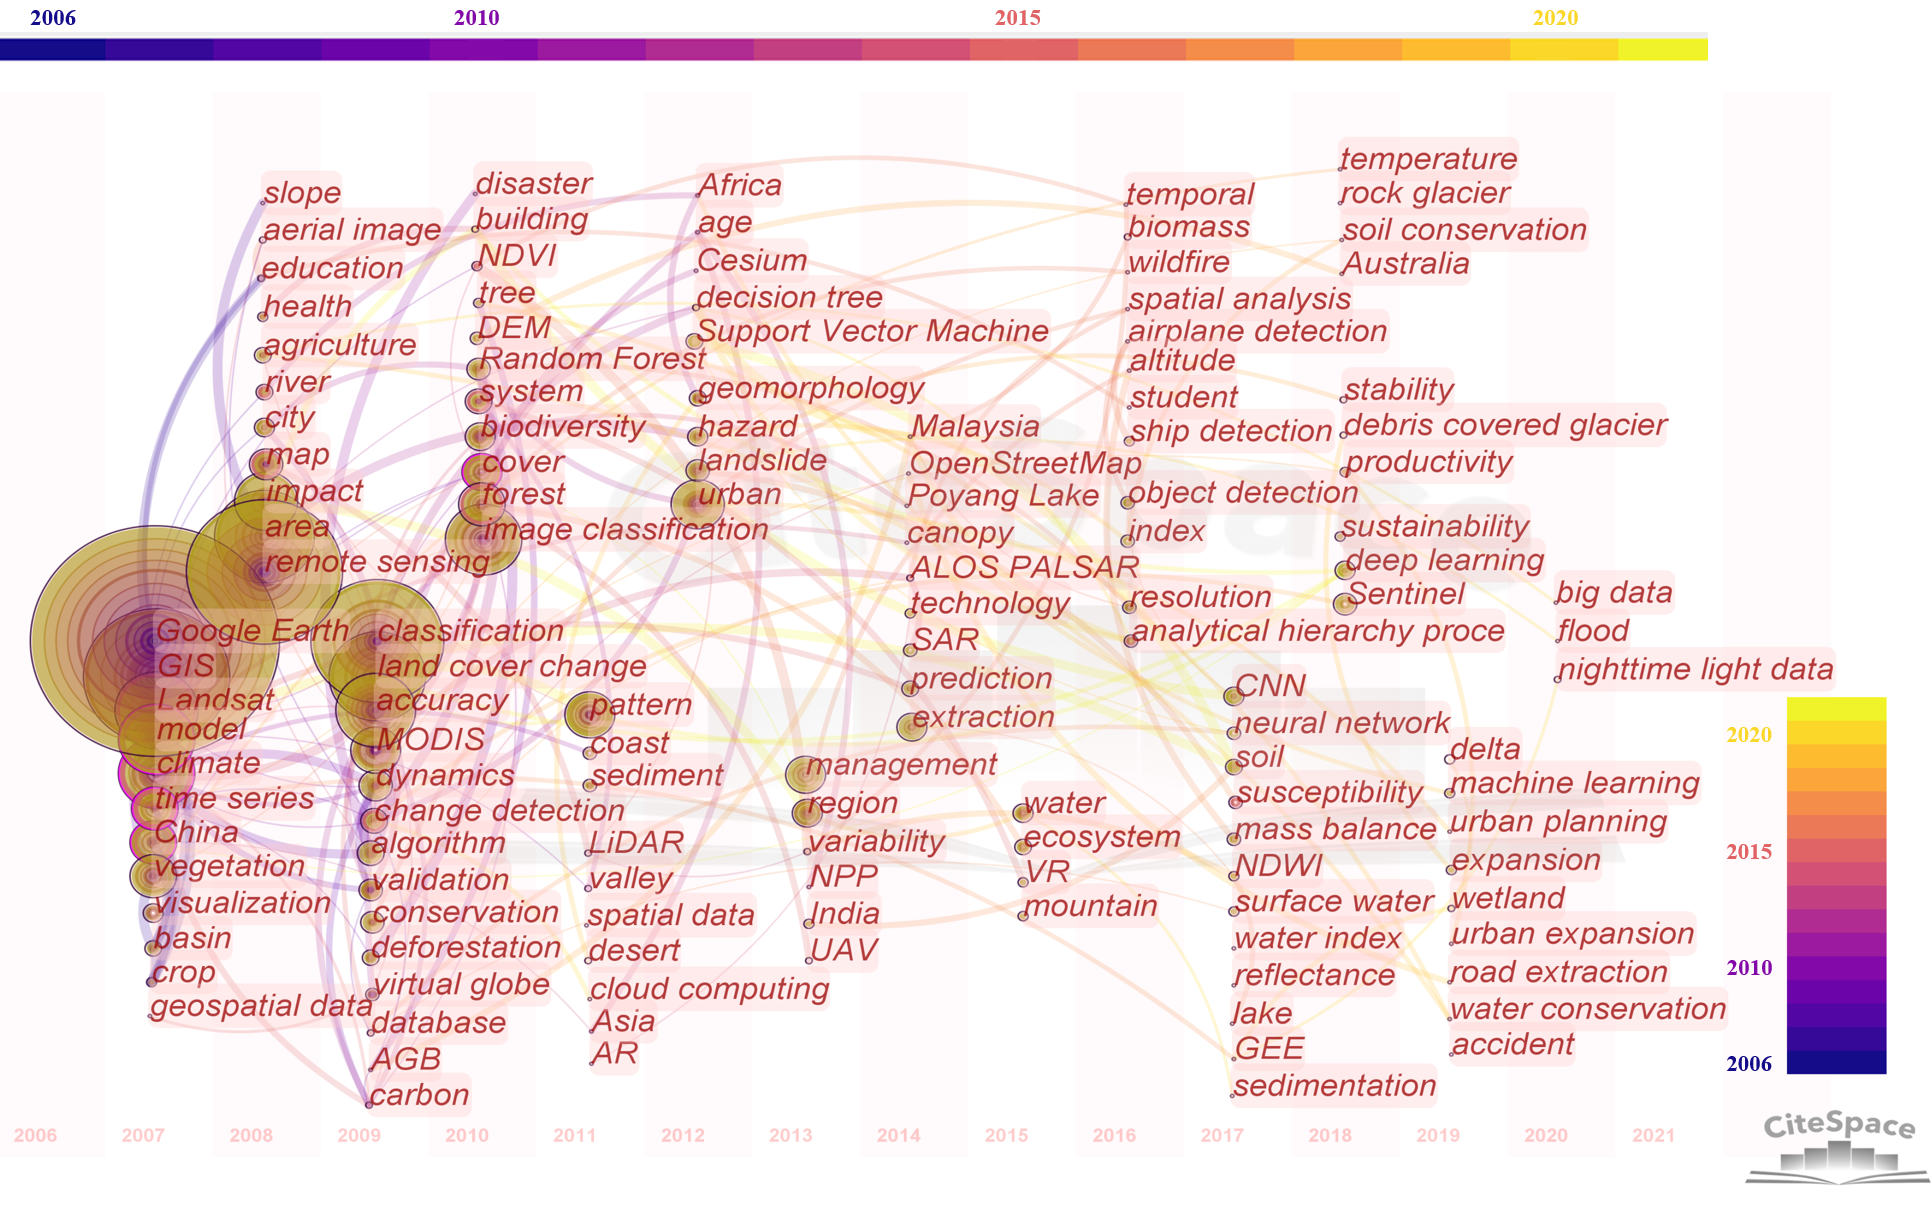
Figure 4. Co-occurrence keywords were used in relation to GE. The size of the node represents the frequency of the occurrence of the keyword, the connecting lines indicate the co-occurrence relationships for the keyword, and a purple outer circle indicates that the node is a key node (betweenness centrality > 0.1).
2.3 Research contribution analysis
Table 1 lists the cited papers that were found to correspond to the strongest citation bursts in GE articles. This list consists of papers that were important to the promotion, development and application of GE. In 2006, Butler [33] published a paper that described a systematic evaluation of the GE platform. He stated that GE was changing the world because it made the communication of spatial information between stakeholders and government agencies feasible. GE’s data-sharing capability was an essential property for global climate change studies. Potere [34] verified the horizontal positioning accuracy of high-resolution GE imagery by selecting 436 control points in 109 cities worldwide. The results obtained using GE imagery were found to be sufficiently accurate for most urban research and the reliability of this imagery for use in subsequent applications was verified. Yu and Gong [1] published the first review of GE in 2012; this review examined the progress made in using GE, prospects for its use, and identified the merits and limitations of GE when applied to Earth science. This review was instructive in terms of the consideration of future applications of GE and the development of the virtual globe platform. Other important papers discussed new types of global geographic data [35][36][37][38] and image processing or accuracy assessment algorithms that had a significant impact on the application of GE [39][40] and Earth system science. Chang et al. [41] built a dengue surveillance system that was based on GE images and geographic information related to the incidence of dengue fever. This proved to be a successful GE application.
Table 1. GE papers with the strongest citation bursts
|
Article |
Author |
Year |
Strength |
Begin |
End |
|
The web-wide world [33] |
Butler, D |
2006 |
10.13 |
2008 |
2011 |
|
Google Earth as a virtual globe tool for Earth science applications at the global scale: progress and perspectives [1] |
Yu, L |
2012 |
9.92 |
2013 |
2017 |
|
Horizontal Positional Accuracy of Google Earth’s High-Resolution Imagery Archive [32] |
Potere, D |
2008 |
6.74 |
2009 |
2013 |
|
MODIS Collection 5 global land cover: Algorithm refinements and characterization of new datasets [35] |
Friedl, MA |
2010 |
6.14 |
2012 |
2015 |
|
Finer resolution observation and monitoring of global land cover: first mapping results with Landsat TM and ETM+ data [36] |
Gong, P |
2013 |
5.94 |
2015 |
2018 |
|
Deep Residual Learning for Image Recognition [39] |
He, KM |
2016 |
5.64 |
2018 |
2021 |
|
High-Resolution Global Maps of 21st-Century Forest Cover Change [37] |
Hansen, MC |
2013 |
5.61 |
2014 |
2018 |
|
Good practices for estimating area and assessing accuracy of land change [40] |
Olofsson, P |
2014 |
5.2 |
2017 |
2019 |
|
Global land cover mapping at 30 m resolution: A POK-based operational approach [38] |
Chen, J |
2015 |
5.12 |
2017 |
2018 |
|
Combining Google Earth and GIS mapping technologies in a dengue surveillance system for developing countries [41] |
Chang, AY |
2009 |
4.8 |
2012 |
2014 |
2.4 Cooperation network analysis
At the institutional level, Chinese scientific institutions have dominated the application of GE. The top ten scientific institutions in terms of the application of GE were the Chinese Academy of Sciences (101), the University of Chinese Academy of Sciences (39), Wuhan University (28), Beijing Normal University (17), Tsinghua University (13), Ghent University (12), China University of Geosciences (11), Beihang University (11), the University of California, Berkeley (10), and the Catholic University of Leuven (10). The number of published papers from Chinese scientific institutions was far greater than that from institutions in other countries.
At the national level, the number of publications was more concentrated. The top five countries published 1022 GE papers (including duplicates), which accounted for 51.8% of the total number of published papers. The top five countries were the USA (397), China (357), the United Kingdom (115), India (82), and Germany (71). In summary, the United States and China have dominated the application of GE, and have published a considerable number of related papers, as compared to other countries.
3. Current Insights
Virtual globes were in development for a long time, and, here, we describe several of the popular virtual globes that were first mentioned above. World Wind is a completely open-source virtual globe that is different from GE in that it is a software development kit (SDK) that provides a geographic rendering engine: users can build their own geospatial applications to solve problems specific to their own domains (https://worldwind.arc.nasa.gov/). Bing Maps (https://cn.bing.com/maps) and ArcGIS Explorer (https://www.esri.com/zh-cn/arcgis/products/arcgis-explorer) are more akin to web-maps or map-browsers, and mainly provide real-time navigation and positioning rather than 3D globe visualization. Cesium and OpenWebGlobe are open-source 3D geospatial virtual globes based on JavaScript and WebGL that support multiple scene modes (3D, 2.5D, and 2D). World Wind, Cesium, and OpenWebGlobe are superior to GE in terms of multi-dimensional visualization and extensibility, but do not have GE’s ease of use and stable high-spatial resolution images. We used the same method used for GE articles to retrieve articles related to these virtual globes and found that the number of articles was far less than for GE: World Wind (18), Bing Maps (43), ArcGIS Explorer (3), Cesium (6) and OpenWebGlobe (0). The results found by Yu and Gong [1] confirmed this.
GE is a data fusion platform that has visualization as its primary function (Table 2). However, GE does not possess real-time modeling capabilities. Its use of the KML language means that there is great potential for the use of GE in geospatial studies in the future. The most significant limitation of GE is the lack of GIS analysis, which makes it difficult to improve the data preprocessing and analysis. GE can serve as a virtual world or “natural” earth; by using GE, users can observe global real-time changes or predict future conditions [1]. These functions could be improved by combining GE with cloud-computing technology. GE would then become a browser on which users would only need to initiate a request before receiving the processed results from the server [3]. Yu and Gong [1] envisioned that GE could generate artwork or statistical reports for use in scientific papers and reports. The reconstruction of historical relics and cities based on 3D/4D visualization techniques is also a trend. For some time now, studies were carried out on the application of GE as a geography teaching tool [29][42]. It is possible that GE could be made into an effective teaching tool by adding teaching content; GE would then greatly assist the development of geospatial thinking.
Table 2. Merits and limitations of GE
|
Merits |
|
|
Limitations |
|
The ideal virtual Earth that was described in Gore’s speech had the capacity to model and simulate the global environment and to dynamically display the environment in real-time as well as the future. Such a virtual Earth would display the Earth’s morphology using the advanced technologies of cloud computing, 3D and virtual reality (VR), and would have the capability to process big data. In this way, people would be able to observe global real-time (e.g., it will be very useful for Asian elephant’s migration in China very recently [44]) or simulated future environmental changes using internet-connected devices, and scientists would easily be able to obtain details of environmental conditions or other geo-information at any place and time. Such a virtual Earth would meet the challenges proposed by Yu and Gong [1] and would be an effective tool for use in Earth system science.
References
- Le Yu; Peng Gong; Google Earth as a virtual globe tool for Earth science applications at the global scale: progress and perspectives. International Journal of Remote Sensing 2011, 33, 3966-3986, 10.1080/01431161.2011.636081.
- Jianming Liang; Jianhua Gong; Wenhang Li; Applications and impacts of Google Earth: A decadal review (2006–2016). ISPRS Journal of Photogrammetry and Remote Sensing 2018, 146, 91-107, 10.1016/j.isprsjprs.2018.08.019.
- M.F. Goodchild; The use cases of digital earth. International Journal of Digital Earth 2008, 1, 31-42, 10.1080/17538940701782528.
- S. Gabrielli; Matteo Spagnolo; L. De Siena; Geomorphology and surface geology of Mount St. Helens volcano. Journal of Maps 2020, 16, 585-594, 10.1080/17445647.2020.1790048.
- Cengiz Yıldırım; Geomorphology of Horseshoe Island, Marguerite Bay, Antarctica. Journal of Maps 2019, 16, 56-67, 10.1080/17445647.2019.1692700.
- Ismail Fathy; Hany Abd-Elhamid; Martina Zelenakova; Daniela Kaposztasova; Effect of Topographic Data Accuracy on Watershed Management. International Journal of Environmental Research and Public Health 2019, 16, 4245, 10.3390/ijerph16214245.
- Junhuai Yang; Zhibao Dong; Zhengyao Liu; Weikang Shi; Guoxiang Chen; Tianjie Shao; Hanmin Zeng; Migration of barchan dunes in the western Quruq Desert, northwestern China. Earth Surface Processes and Landforms 2019, 44, 2016-2029, 10.1002/esp.4629.
- Linda Harris; Ronel Nel; Stephen Holness; Kerry Sink; David Schoeman; Setting conservation targets for sandy beach ecosystems. Estuarine, Coastal and Shelf Science 2014, 150, 45-57, 10.1016/j.ecss.2013.05.016.
- Lei Chen; A Quantitative Simulation Based Method for Reclamation Plan of Marine Ecological Constraints. Journal of Coastal Research 2020, 107, 13-16, 10.2112/jcr-si107-004.1.
- Tingting Tao; Sebastián Abades; Shuqing Teng; Zheng Y. X. Huang; Luís Reino; Bin J. W. Chen; Yong Zhang; Chi Xu; Jens-Christian Svenning; Macroecological factors shape local-scale spatial patterns in agriculturalist settlements. Proceedings of the Royal Society B: Biological Sciences 2017, 284, 20172003, 10.1098/rspb.2017.2003.
- Chase D. Mendenhall; Anna M. Wrona; Improving tree cover estimates for fine-scale landscape ecology. Landscape Ecology 2018, 33, 1691-1696, 10.1007/s10980-018-0704-2.
- K.J.W. McCaffrey; M. Feely; R. Hennessy; J. Thompson; Visualization of folding in marble outcrops, Connemara, western Ireland: An application of virtual outcrop technology. Geosphere 2008, 4, 588-599, 10.1130/ges00147.1.
- A.M. Martínez-Graña; J.L. Goy; C.A. Cimarra; A virtual tour of geological heritage: Valourising geodiversity using Google Earth and QR code. Computers & Geosciences 2013, 61, 83-93, 10.1016/j.cageo.2013.07.020.
- Renée Schicker; Vicki Moon; Comparison of bivariate and multivariate statistical approaches in landslide susceptibility mapping at a regional scale. Geomorphology 2012, 161-162, 40-57, 10.1016/j.geomorph.2012.03.036.
- T.E. Wright; Michael Burton; D.M. Pyle; T. Caltabiano; Visualising volcanic gas plumes with virtual globes. Computers & Geosciences 2009, 35, 1837-1842, 10.1016/j.cageo.2009.02.005.
- Ambrish Sharma; Jun Wang; Elizabeth M. Lennartson; Intercomparison of MODIS and VIIRS Fire Products in Khanty-Mansiysk Russia: Implications for Characterizing Gas Flaring from Space. Atmosphere 2017, 8, 95, 10.3390/atmos8060095.
- Franny Giselle Murillo-García; Irasema Alcántara-Ayala; Francesca Ardizzone; Mauro Cardinali; Federica Fiourucci; Fausto Guzzetti; Satellite stereoscopic pair images of very high resolution: a step forward for the development of landslide inventories. Landslides 2014, 12, 277-291, 10.1007/s10346-014-0473-1.
- Dominik H. Lang; Federico Vladimir Gutierrez Corea; RISe: Illustrating Georeferenced Data of Seismic Risk and Loss Assessment Studies Using Google Earth. Earthquake Spectra 2010, 26, 295-307, 10.1193/1.3283906.
- Cheng-Chien Liu; Po-Li Chen; Tomoya Matsuo; Chen-Yu Chen; Rapidly responding to landslides and debris flow events using a low-cost unmanned aerial vehicle. Journal of Applied Remote Sensing 2015, 9, 096016-096016, 10.1117/1.jrs.9.096016.
- Muhammad Akbar; Shahrouz Aliabadi; Reena Patel; Marvin Watts; A fully automated and integrated multi-scale forecasting scheme for emergency preparedness. Environmental Modelling & Software 2012, 39, 24-38, 10.1016/j.envsoft.2011.12.006.
- Qi Wen; Kaiyu Jiang; Wei Wang; Qingjie Liu; Qing Guo; Lingling Li; Ping Wang; Automatic Building Extraction from Google Earth Images under Complex Backgrounds Based on Deep Instance Segmentation Network. Sensors 2019, 19, 333, 10.3390/s19020333.
- Jianqiang Zhang; Deo Raj Gurung; Rongkun Liu; Manchiraju Sri Ramachandra Murthy; Fenghuan Su; Abe Barek landslide and landslide susceptibility assessment in Badakhshan Province, Afghanistan. Landslides 2015, 12, 597-609, 10.1007/s10346-015-0558-5.
- Philippa Clarke; Jennifer Ailshire; Robert Melendez; Michael Bader; Jeffrey Morenoff; Using Google Earth to conduct a neighborhood audit: Reliability of a virtual audit instrument. Health & Place 2010, 16, 1224-1229, 10.1016/j.healthplace.2010.08.007.
- Huayi Wu; Zhengwei He; Jianya Gong; A virtual globe-based 3D visualization and interactive framework for public participation in urban planning processes. Computers, Environment and Urban Systems 2010, 34, 291-298, 10.1016/j.compenvurbsys.2009.12.001.
- Hongyu Du; Wenbo Cai; Yanqing Xu; Zhibao Wang; Yuanyuan Wang; Yongli Cai; Quantifying the cool island effects of urban green spaces using remote sensing Data. Urban Forestry & Urban Greening 2017, 27, 24-31, 10.1016/j.ufug.2017.06.008.
- Bhartendu Pandey; P.K. Joshi; Karen C. Seto; Monitoring urbanization dynamics in India using DMSP/OLS night time lights and SPOT-VGT data. International Journal of Applied Earth Observation and Geoinformation 2013, 23, 49-61, 10.1016/j.jag.2012.11.005.
- Prafull Singh; Noyingbeni Kikon; Pradipika Verma; Impact of land use change and urbanization on urban heat island in Lucknow city, Central India. A remote sensing based estimate. Sustainable Cities and Society 2017, 32, 100-114, 10.1016/j.scs.2017.02.018.
- X. Xiang; Yan Liu; Understanding ‘change’ through spatial thinking using Google Earth in secondary geography. Journal of Computer Assisted Learning 2016, 33, 65-78, 10.1111/jcal.12166.
- Todd C. Patterson; Google Earth as a (Not Just) Geography Education Tool. Journal of Geography 2007, 106, 145-152, 10.1080/00221340701678032.
- Antonio Miguel Martínez-Graña; José González-Delgado; Silvia Pallarés; José Luis Goy; Jorge Civis Llovera; 3D Virtual Itinerary for Education Using Google Earth as a Tool for the Recovery of the Geological Heritage of Natural Areas: Application in the “Las Batuecas Valley” Nature Park (Salamanca, Spain). Sustainability 2014, 6, 8567-8591, 10.3390/su6128567.
- Chaomei Chen; Fidelia Ibekwe-SanJuan; Jianhua Hou; The structure and dynamics of cocitation clusters: A multiple-perspective cocitation analysis. Journal of the American Society for Information Science and Technology 2010, 61, 1386-1409, 10.1002/asi.21309.
- David Potere; Horizontal Positional Accuracy of Google Earth’s High-Resolution Imagery Archive. Sensors 2008, 8, 7973-7981, 10.3390/s8127973.
- Butler, D; The web-wide world. Nature 2006, 439, 776–778, https://doi.org/10.1038/439776a.
- Liangfeng Zhu; Wensheng Kan; Yu Zhang; Jianzhong Sun; Visualizing the Structure of the Earth’s Lithosphere on the Google Earth Virtual-Globe Platform. ISPRS International Journal of Geo-Information 2016, 5, 26, 10.3390/ijgi5030026.
- Mark A. Friedl; Damien Sulla-Menashe; Bin Tan; Annemarie Schneider; Navin Ramankutty; Adam Sibley; Xiaoman Huang; MODIS Collection 5 global land cover: Algorithm refinements and characterization of new datasets. Remote Sensing of Environment 2010, 114, 168-182, 10.1016/j.rse.2009.08.016.
- Peng Gong; Jie Wang; Le Yu; Yongchao Zhao; Yuanyuan Zhao; Lu Liang; Zhenguo Niu; Xiaomeng Huang; Haohuan Fu; Shuang Liu; et al.Congcong LiXueyan LiWei FuCaixia LiuYue XuXiaoyi WangQu ChengLuanyun HuWenbo YaoHan ZhangPeng ZhuZiying ZhaoHaiying ZhangYaomin ZhengLuyan JiYawen ZhangHan ChenAn YanJianhong GuoLiang YuLei WangXiaojun LiuTingting ShiMenghua ZhuYanlei ChenGuangwen YangPing TangBing XuChandra GiriNicholas ClintonZhiliang ZhuJin ChenJun Chen Finer resolution observation and monitoring of global land cover: first mapping results with Landsat TM and ETM+ data. International Journal of Remote Sensing 2012, 34, 2607-2654, 10.1080/01431161.2012.748992.
- M. C. Hansen; P. V. Potapov; R. Moore; M. Hancher; S. A. Turubanova; A. Tyukavina; D. Thau; S. V. Stehman; S. J. Goetz; T. R. Loveland; et al.A. KommareddyA. EgorovL. ChiniC. O. JusticeJ. R. G. Townshend High-Resolution Global Maps of 21st-Century Forest Cover Change. Science 2013, 342, 850-853, 10.1126/science.1244693.
- Jun Chen; Jin Chen; Anping Liao; Xin Cao; Lijun Chen; Xuehong Chen; Chaoying He; Gang Han; Shu Peng; Miao Lu; et al.Weiwei ZhangXiaohua TongJon Mills Global land cover mapping at 30m resolution: A POK-based operational approach. ISPRS Journal of Photogrammetry and Remote Sensing 2015, 103, 7-27, 10.1016/j.isprsjprs.2014.09.002.
- Kaiming He, Xiangyu Zhang, Shaoqing Ren, Jian Sun; IEEE. Deep residual learning for image recognition. In Proceedings of the 2016 IEEE Conference on Computer Vision and Pattern Recognition, Las Vegas, NV, USA, 27–30 June 2016; pp. 770–778.
- Pontus Olofsson; Giles M. Foody; Martin Herold; Stephen V. Stehman; Curtis E. Woodcock; Michael A. Wulder; Good practices for estimating area and assessing accuracy of land change. Remote Sensing of Environment 2014, 148, 42-57, 10.1016/j.rse.2014.02.015.
- Aileen Y Chang; Maria E Parrales; Javier Jimenez; Magdalena E Sobieszczyk; Scott M Hammer; David J Copenhaver; Rajan P Kulkarni; Combining Google Earth and GIS mapping technologies in a dengue surveillance system for developing countries. International Journal of Health Geographics 2009, 8, 49-49, 10.1186/1476-072X-8-49.
- Alec M. Bodzin; Integrating Instructional Technologies in a Local Watershed Investigation With Urban Elementary Learners. The Journal of Environmental Education 2008, 39, 47–57, 10.3200/joee.39.2.47-58.
- Lei Luo; Xinyuan Wang; Huadong Guo; Rosa Lasaponara; Pilong Shi; Nabil Bachagha; Li Li; Ya Yao; Nicola Masini; Fulong Chen; et al.Wei JiHui CaoChao LiNingke Hu Google Earth as a Powerful Tool for Archaeological and Cultural Heritage Applications: A Review. Remote Sensing 2018, 10, 1558, 10.3390/rs10101558.
- Haijun Wang; Puze Wang; Xu Zhao; Wenxia Zhang; Jing Li; Chi Xu; Ping Xie; What triggered the Asian elephant's northward migration across southwestern Yunnan?. The Innovation 2021, 2, 100142, 10.1016/j.xinn.2021.100142.

