 +1 credit
| Version | Summary | Created by | Modification | Content Size | Created at | Operation |
|---|---|---|---|---|---|---|
| 1 | Yongfeng Gao | + 3765 word(s) | 3765 | 2020-03-20 09:26:01 | | | |
| 2 | Rita Xu | -47 word(s) | 3718 | 2020-03-23 02:57:41 | | | | |
| 3 | Rita Xu | -47 word(s) | 3718 | 2020-03-23 03:00:55 | | | | |
| 4 | Rita Xu | -56 word(s) | 3662 | 2020-10-26 05:01:08 | | |
Video Upload Options
Metal tolerance proteins (MTPs) are plant divalent cation transporters that play important roles in plant metal tolerance and homeostasis. Poplar is an ideal candidate for the phytoremediation of heavy metals because of its numerous beneficial attributes. Here, 22 MTP genes in P. trichocarpa were identified and classified into three major clusters and seven groups according to phylogenetic relationships. An evolutionary analysis suggested that PtrMTP genes had undergone gene expansion through tandem or segmental duplication events. Moreover, all PtrMTPs were predicted to localize in the vacuole and/or cell membrane, and contained typical structural features of the MTP family, cation efflux domain. The temporal and spatial expression pattern analysis results indicated the involvement of PtrMTP genes in poplar developmental control. Under heavy metal stress, most of PtrMTP genes were induced by at least two metal ions in roots, stems or leaves. In addition, PtrMTP8.1, PtrMTP9 and PtrMTP10.4 displayed the ability of Mn transport in yeast cells, and PtrMTP6 could transport Co, Fe and Mn. These findings will provide an important foundation to elucidate the biological functions of PtrMTP genes, and especially their role in regulating heavy metal tolerance in poplar.
1. Introduction
1.1. Identification and Classification of MTP Genes in P. trichocarpa Genome
By using the sequences of 12 AtMTP proteins as queries, we identified a total of 22 MTP genes in P. trichocarpa genome, three more than previous results [1]. The 22 PtrMTP proteins were named PtrMTP1.1 to PtrMTP12, according to the phylogenetic relationship, sequence identity and cover values between PtrMTP and AtMTP proteins (Figure 1, Supplementary Table S3, and Table 1). A phylogenetic tree showed that except for AtMTP2, there was at least one homolog of Arabidopsis MTP proteins in P. trichocarpa (Figure 1).
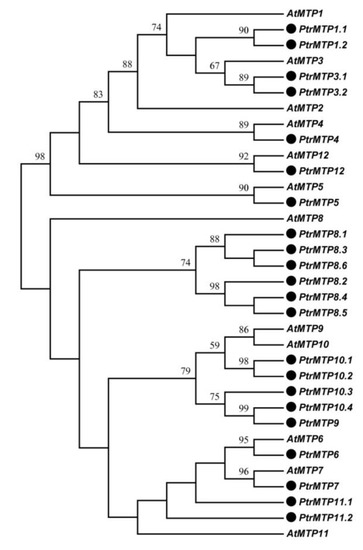
Figure 1. Phylogenetic relationship of MTP proteins in P. trichocarpae and Arabidopsis. The PtrMTP proteins were named according to the sequence identity and cover values, as well as the orthologous relationship compared with AtMTPs. The black solid circles represent the MTP proteins from P. trichocarpae.
To further analyze the phylogenetic relationship of PtrMTP proteins to their counterparts from other plants, a total of 118 MTP sequences from eight plant species were used to construct a phylogentic tree. The 22 PtrMTP proteins could be categorized to seven groups (1, 5, 6, 7, 8, 9 and 12). Among them, group 9 is the largest one, containing 7 PtrMTP members; group 1 includes 5 PtrMTP members, while groups 5, 6, 7 and 12 contain only one PtrMTP each. Amazingly, group 8 contains 5 tandem repeat PtrMTP members from PtrMTP8.2 to PtrMTP8.6 and a single PtrMTP8.1 (Figures 2). Further, the seven PtrMTP groups are classified into Zn-CDFs, Zn/Fe-CDFs and Mn-CDFs clusters.
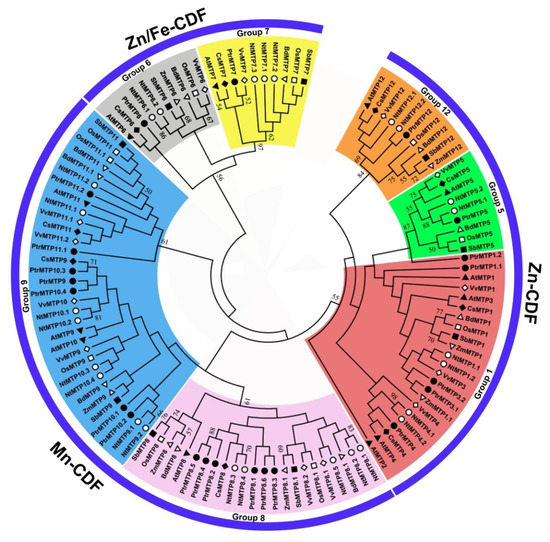
Figure 2. Phylogenetic relationships of MTP proteins in P. trichocarpae and other plant species. One hundred and eighteen MTP proteins are clustered into three major substrate-specific groups and seven primary groups, which are highlight in different colors. The different symbols represent the MTP proteins of different species as follows. Solid triangles: Arabidopsis thaliana; hollow triangles: Brachypodium diastychon; reverse hollow triangles: Zea mays; solid diamonds: Cucumis sativus; hollow diamonds: Vitis vinifera; solid circles: Populus trichocarpae; hollow circles: Nicotiana tabacum; solid squares: Sorghum bicolor; hollow squares: Oryza sativa.
2. Structure and Characteristics Analysis of PtrMTP Genes
The genome annotation files of poplar were applied to the TBtools software for an exon-intron organizations analysis of PtrMTP genes. As shown in Figure 3a–b, although the number of introns in the PtrMTP genes of the three clusters ranged from 0 to 12, most of the related members that clustered closely shared similar introns in terms of number and phase. Of the three clusters, Zn-CDFs contained the smallest number of introns (group 1 contained only one, and group 12 contained none), except for group 5, which harbored 9 introns; Mn-CDFs contained 3–6 introns (group 8 contained 3, 5 or 6, and group 9 all contained 5), whereas Zn/Fe-CDFs contained the largest number of introns (group 6 contained 10, group 7 contained 12) (Figure 3a–b). Additionally, all the PtrMTP genes contained phase 0 and phase 2 introns, while only the members of group 5–7 contained phase 1 intron (Figure 3a–b).
Next, the physicochemical parameters of the 22 PtrMTPs were analyzed further. The length of the coding sequence (CDS) of PtrMTP genes ranged from 498 bp (PtrMTP8.6) to 2610 bp (PtrMTP12), with 165 to 869 amino acids, as well as a relative molecular weight (MW) ranging from 18.375 to 97.498 KDa (Table 1). The total average of hydropathicity (GRAVY) of the PtrMTP proteins ranged from –0.235 (PtrMTP10.1) to 0.329 (PtrMTP4) (Table 1). Moreover, PtrMTP7 has the highest isoelectric point (pI), i.e., 7.24, whereas those of other PtrMTPs were below 7 (Table 1). Furthermore, all PtrMTP proteins were expected to localize in the vacuole, and notably, some (PtrMTP9, PtrMTP10.2, PtrMTP10.3 and PtrMTP10.4) were also localized in the cytoplasm membrane (Table 1). In addition, most PtrMTP proteins contained 4–6 typical TMDs, whereas PtrMTP11.2 had only three, and PtrMTP12 harbored 12; none was found in PtrMTP6 and PtrMTP8.6 proteins (Table 1).
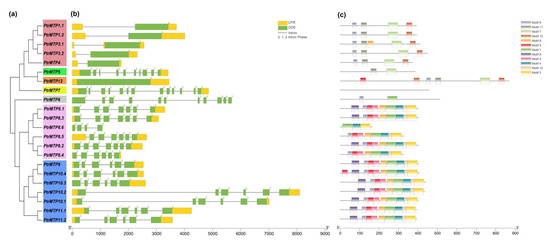
Figure 3. Phylogenetic relationships, gene structure and conserved motifs in MTP genes from P. trichocarpae. (a) A phylogenetic tree was constructed using the MEGA 6.0 software based on the full-length sequences of poplar MTP proteins. Seven primary groups are shown in different colors. (b) Exon-intron structure of poplar MTP genes. Yellow boxes indicate untranslated 5′- and 3′-regions (UTR); green boxes indicate exons; gray lines indicate introns. The number indicates the phases of corresponding introns. (c) Conserved motifs were identified by MEME and are displayed in different colored boxes.
Table 1. Detail information of 22 PtrMTP genes identified in current study.
|
Gene Name. |
Gene ID |
Chromosome Location |
Strand |
CDS (bp) |
Protein Size(aa) |
MW (KDa) |
PI |
GRAVY |
Sub-Cellular Localization |
TMD Number |
|
PtrMTP1.1 |
Potri.014G106200 |
Chr14:8357551.8361095 |
+ |
1182 |
393 |
43.47 |
5.81 |
0.074 |
Vacuole |
6/In-In |
|
PtrMTP1.2 |
Potri.002G180100 |
Chr02:13987567.13990838 |
+ |
1182 |
393 |
43.55 |
5.9 |
0.07 |
Vacuole |
6/In-In |
|
PtrMTP3.1 |
Potri.011G150600 |
Chr11:16906810.16909370 |
- |
1242 |
413 |
45.24 |
6.02 |
0.064 |
Vacuole |
6/In-In |
|
PtrMTP3.2 |
Potri.001G450900 |
Chr01:48519109.48521426 |
+ |
1347 |
448 |
48.94 |
5.85 |
-0.174 |
Vacuole |
6/In-In |
|
PtrMTP4 |
Potri.001G245800 |
Chr01:25633268.25635016 |
+ |
1122 |
373 |
41.43 |
5.47 |
0.329 |
Vacuole |
6/Out-Out |
|
PtrMTP5 |
Potri.016G045200 |
Chr16:2844025.2847434 |
- |
1161 |
386 |
43.24 |
6 |
0.173 |
Vacuole |
6/In-In |
|
PtrMTP6 |
Potri.T034500 |
scaffold_36:109770.116219 |
+ |
1542 |
513 |
55.86 |
6.58 |
-0.012 |
Vacuole |
0 |
|
PtrMTP7 |
Potri.010G251300 |
Chr10:22330375.22335229 |
- |
1380 |
459 |
50.51 |
7.24 |
-0.017 |
Vacuole |
4/In-In |
|
PtrMTP8.1 |
Potri.003G215600 |
Chr03:21264228.21267534 |
+ |
1206 |
401 |
45.08 |
5.24 |
0.038 |
Vacuole |
5/In-Out |
|
PtrMTP8.2 |
Potri.001G010200 |
Chr01:654690.657190 |
- |
1212 |
403 |
45.31 |
6.04 |
-0.033 |
Vacuole |
5/In-Out |
|
PtrMTP8.3 |
Potri.001G010300 |
Chr01:657997.661070 |
- |
1212 |
403 |
45.62 |
5.2 |
-0.034 |
Vacuole |
4/Out-Out |
|
PtrMTP8.4 |
Potri.001G010100 |
Chr01:651043.652778 |
- |
984 |
327 |
36.95 |
5.51 |
0.205 |
Vacuole |
5/In-Out |
|
PtrMTP8.5 |
Potri.001G010000 |
Chr01:647003.649031 |
- |
984 |
327 |
37.11 |
5.78 |
0.149 |
Vacuole |
5/In-Out |
|
PtrMTP8.6 |
Potri.001G009900 |
Chr01:643504.644577 |
- |
498 |
165 |
18.38 |
5.48 |
0.048 |
Vacuole |
0 |
|
PtrMTP9 |
Potri.008G083600 |
Chr08:5257637.5260169 |
- |
1215 |
404 |
46.52 |
6.68 |
-0.165 |
Cell membrane/Vacuole |
5/In-Out |
|
PtrMTP10.1 |
Potri.010G172800 |
Chr10:17367355.17374280 |
+ |
1212 |
403 |
46.52 |
6.77 |
-0.235 |
Vacuole |
6/In-In |
|
PtrMTP10.2 |
Potri.010G172900 |
Chr10:17376155.17384476 |
+ |
1305 |
434 |
50.17 |
6.8 |
-0.198 |
Cell membrane/Vacuole |
4/Out-Out |
|
PtrMTP10.3 |
Potri.010G172700 |
Chr10:17359356.17361845 |
+ |
1317 |
438 |
49.89 |
6.24 |
-0.064 |
Cell membrane/Vacuole |
5/In-Out |
|
PtrMTP10.4 |
Potri.010G172600 |
Chr10:17355982.17358522 |
+ |
1224 |
407 |
46.73 |
6.88 |
-0.076 |
Cell membrane/Vacuole |
5/In-Out |
|
PtrMTP11.1 |
Potri.010G211300 |
Chr10:19986602.19990567 |
+ |
1185 |
394 |
44.87 |
5.05 |
-0.053 |
Vacuole |
4/Out-Out |
|
PtrMTP11.2 |
Potri.008G049600 |
Chr08:2924867.2928439 |
- |
1185 |
394 |
44.74 |
4.88 |
-0.055 |
Vacuole |
3/Out-In |
|
PtrMTP12 |
Potri.005G110300 |
Chr05:8489679.8492954 |
- |
2610 |
869 |
97.5 |
6.95 |
-0.026 |
Vacuole |
12/In-In |
3. Chromosomal Localization and Gene Duplication Analysis of PtrMTP Genes
To explore the physical locations of the PtrMTP genes, genome annotation files were downloaded from the phytozome12 database and analyzed using the TBtools software. The results showed that the 21 out of the 22 PtrMTP genes were located on nine poplar chromosomes with an uneven distribution pattern (Figure 4). Most PtrMTP genes were assigned to chromosomes 01 and 10, which contained 7 and 6 PtrMTP genes, respectively. Interestingly, some PtrMTP genes were closely located to one another in a chromosome, such as five PtrMTP genes (PtrMTP8.2-PtrMTP8.5) on chromosome 01, and four PtrMTP genes (PtrMTP10.1-PtrMTP10.4) on chromosome 10. PtrMTP9 and PtrMTP11.2 were located on chromosome 08, whereas other PtrMTPs were separately located on chromosomes 02, 03, 05, 11, 14 and 16, with one PtrMTP gene on each chromosome (Figure 4). Nevertheless, the PtrMTP6 gene located on scaffold_36 could not be mapped onto any chromosome based on the current version of P. trichocarpa genome sequence.
The obtained physical locations information of the PtrMTP genes prompted us to check the gene duplication events in PtrMTP gene family. The results showed that five genes pairs (PtrMTP8.2/PtrMTP8.3, PtrMTP8.2/PtrMTP8.4, PtrMTP8.4/PtrMTP8.5, PtrMTP10.1/PtrMTP10.2 and PtrMTP10.3/PtrMTP10.4) from chromosomes 01 and 10 were identified as tandem duplication events in the PtrMTP family (Figure 4). At the same time, five pairs (PtrMTP1.1/PtrMTP1.2, PtrMTP3.1/PtrMTP3.2, PtrMTP8.1/PtrMTP8.6, PtrMTP9/PtrMTP10.4 and PtrMTP11.1/PtrMTP11.2) from six different chromosomes were found as segmental duplication events.
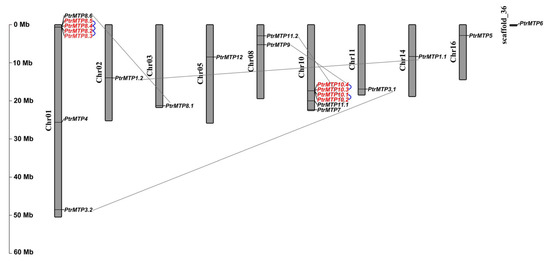
Figure 4. Distribution of the PtrMTP genes on P. trichocarpae chromosomes. The chromosome number is indicated on the left side of each chromosome, and the size is labeled on the left of the figure. Tandem duplicated genes are outlined with red; tandem and segmental duplicated gene pairs are linked with blue and gray lines, respectively.
To better understand the selection type of these duplication genes, the ratios of the number of nonsynonymous substitutions per nonsynonymous site (Ka) to the number of synonymous substitutions per synonymous site (Ks) of the 10 gene pairs mentioned above were further calculated. As shown in Table 2, the Ka/Ks ratios of all duplicated pairs of the PtrMTP gene were less than 1, which suggested that all these duplication events were under negative selection, based on the summaries from Hurst [2].
Table 2. Ka/Ks analysis and duplicated date calculation for PtrMTP genes.
|
Duplicatedpair |
Duplicate type |
Ka |
Ks |
Ka/Ks |
Positive selection |
|
PtrMTP1.1/PtrMTP1.2 |
Segmental |
0.0752 |
0.2006 |
0.374875 |
No |
|
PtrMTP3.1/PtrMTP3.2 |
Segmental |
0.0591 |
0.3208 |
0.184227 |
No |
|
PtrMTP8.1/PtrMTP8.6 |
Segmental |
0.0683 |
0.2624 |
0.26029 |
No |
|
PtrMTP9/PtrMTP10.4 |
Segmental |
0.0627 |
0.2097 |
0.298999 |
No |
|
PtrMTP11.1/PtrMTP11.2 |
Segmental |
0.0388 |
0.2849 |
0.136188 |
No |
|
PtrMTP8.2/PtrMTP8.3 |
Tandem |
0.1652 |
1.1124 |
0.148508 |
No |
|
PtrMTP8.2/PtrMTP8.4 |
Tandem |
0.0027 |
0.0044 |
0.613636 |
No |
|
PtrMTP8.4/PtrMTP8.5 |
Tandem |
0.016 |
0.0313 |
0.511182 |
No |
|
PtrMTP10.1/PtrMTP10.2 |
Tandem |
0.0152 |
0.0257 |
0.59144 |
No |
|
PtrMTP10.3/PtrMTP10.4 |
Tandem |
0.1409 |
0.7069 |
0.199321 |
No |
Notes: Ka/Ks <1 means negative selection, Ka/Ks = 1 means neutral selection, and Ka/Ks >1 means positive selection.
4. Conserved Motif and Domain Architectures Analysis of PtrMTP Proteins
Our study found that PtrMTP proteins contained a total of twelve conserved motifs (Figure 3c), among which only three encode functional domains according to the annotation from the Pfam or InterProScan tools (Figure 3c and Supplementary Table S4). Motifs 1 and 7 encode Cation efflux, while motif 2 encodes ZT_dimer. Motif 6 was widely shared by all PtrMTPs, except for PtrMTP5, PtrMTP7 and PtrMTP8.6 (Figure 3c). Motifs 7, 11 and 12 were mainly distributed in the Zn-CDFs cluster, while motifs 1, 2, 3, 4, 5, 8, 9 and 10 were specifically distributed in the Mn-CDFs cluster. It was also found that the members of the same cluster or group had similar motif types and distributions (Figure 3c). Of the three clusters, Zn/Fe-CDFs contained the smallest number of motifs (group 6 only contained two, and group 7 contained none), Zn-CDFs contained 2–6 motifs (group 1 contained 4 or 5, group 5 contained 2, and group 12 contained 6), whereas Mn-CDFs had the largest number and the most similar types (group 8 contained 8 or 9, and group 9 contained 9 or 10), except for PtrMTP8.6, which contained only three (Figure 3c).
A conserved domain analysis showed that all the PtrMTP proteins contained the cation efflux domain (Figure 5), a typical feature of the MTP protein [5], whereas the members of groups 6, 8 (except for PtrMTP8.6) and 9 possessed a ZT dimer, an important zinc transporter dimerization domain.
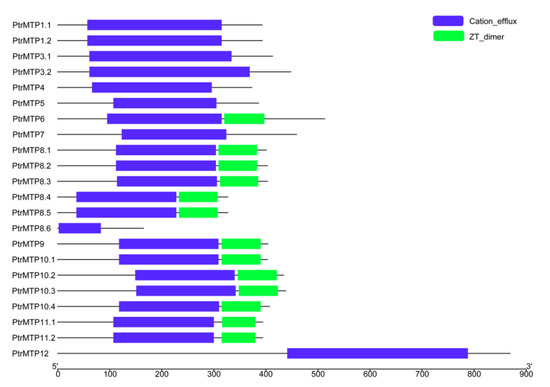
Figure 5. Distributions of the conserved domains in PtrMTP proteins. Blue boxes indicate cation_efflux domains; Green boxes indicate ZT_dimers.
5. Cis-Acting Elements in the Promoter Regions of PtrMTP Genes
A total of 1271 cis-acting regulatory elements were identified, which were classified into nine major classes, i.e., 917 elements for gene transcription, 52 elements for abiotic stress, 1 element for biotic stress, 8 elements for tissue expression, 5 elements for secondary metabolism, 80 elements for phytohormonal response, 168 elements for light response, 5 elements for circadian control and 35 elements for site binding (Table 3 and Supplementary Table S5).
Among these, gene transcription elements including 366 CAAT elements and 551 TATA-box elements, which were the most abundance elements, and light responsiveness elements, such as ACE, ATCT-motif, Box 4 and CATT-motif, were commonly present in all PtrMTPs. Responsive elements of various phytohormones, such as ABRE, P-box, GARE-motif, TATC-box and SARE, were found in all PtrMTP genes, except for the PtrMTP1.1 and PtrMTP1.2 genes. Abiotic stress elements including LTR, MBS, TC-rich repeat, WUN-motif, ARE and GC-motif were distributed in the promoters of all PtrMTP genes except for PtrMTP1.1. In comparison, the AT-rich element involved in biotic stress responsive was detected only in the promoter of the PtrMTP3.2 gene. Additionally, tissue expression elements including CAT-box and GCN4_motif were present in promoters of PtrMTP1.2, PtrMTP3.2, PtrMTP4, PtrMTP6, PtrMTP9, PtrMTP10.1, PtrMTP10.3 and PtrMTP10.4 genes. Moreover, secondary metabolism elements were only detected in the promoters of PtrMTP1.1, PtrMTP3.2, PtrMTP6 and PtrMTP12, including MBSI involved in flavonoid metabolism and O2-site zein involved in zein metabolism. Notably, site-binding elements were found in all PtrMTP genes, except for PtrMTP1.1, PtrMTP7, PtrMTP8.5, PtrMTP6, PtrMTP10.4 and PtrMTP12, whereas circadian control elements were only present in promoters of PtrMTP8.4, PtrMTP8.5 and PtrMTP8.6 (Table 3 and Supplementary Table S5). These results indicated a diverse and complicated control of PtrMTP gene expression at the transcriptional level.
Table 3. Summary of the cis-acting regulatory elements identified in the promoter regions of PtrMTP genes.
|
Gene name |
Gene Transcription |
Abiotic Stress |
Biotic Stress |
Tissue Expression |
Secondary Metabolism |
Phytohormonal Responsive |
light Response |
Circadian Control |
Site-Binding |
|
PtrMTP1.1 |
43 |
0 |
0 |
0 |
2 |
0 |
2 |
0 |
0 |
|
PtrMTP1.2 |
63 |
4 |
0 |
1 |
0 |
0 |
5 |
0 |
1 |
|
PtrMTP3.1 |
33 |
3 |
0 |
0 |
0 |
1 |
3 |
0 |
1 |
|
PtrMTP3.2 |
73 |
4 |
1 |
1 |
1 |
1 |
7 |
0 |
3 |
|
PtrMTP4 |
41 |
3 |
0 |
1 |
0 |
5 |
12 |
0 |
1 |
|
PtrMTP5 |
30 |
1 |
0 |
0 |
0 |
4 |
2 |
0 |
1 |
|
PtrMTP6 |
58 |
1 |
0 |
1 |
1 |
3 |
5 |
0 |
1 |
|
PtrMTP7 |
34 |
4 |
0 |
0 |
0 |
2 |
4 |
0 |
0 |
|
PtrMTP8.1 |
57 |
1 |
0 |
0 |
0 |
6 |
12 |
0 |
4 |
|
PtrMTP8.2 |
20 |
3 |
0 |
0 |
0 |
2 |
5 |
0 |
1 |
|
PtrMTP8.3 |
32 |
3 |
0 |
0 |
0 |
7 |
13 |
0 |
3 |
|
PtrMTP8.4 |
20 |
2 |
0 |
0 |
0 |
3 |
7 |
1 |
2 |
|
PtrMTP8.5 |
39 |
2 |
0 |
0 |
0 |
2 |
9 |
2 |
0 |
|
PtrMTP8.6 |
20 |
3 |
0 |
0 |
0 |
3 |
6 |
2 |
2 |
|
PtrMTP9 |
20 |
1 |
0 |
1 |
0 |
1 |
5 |
0 |
0 |
|
PtrMTP10.1 |
33 |
2 |
0 |
1 |
0 |
7 |
15 |
0 |
4 |
|
PtrMTP10.2 |
33 |
2 |
0 |
0 |
0 |
7 |
14 |
0 |
2 |
|
PtrMTP10.3 |
27 |
1 |
0 |
1 |
0 |
5 |
4 |
0 |
1 |
|
PtrMTP10.4 |
45 |
1 |
0 |
1 |
0 |
1 |
6 |
0 |
0 |
|
PtrMTP11.1 |
25 |
5 |
0 |
0 |
0 |
11 |
12 |
0 |
5 |
|
PtrMTP11.2 |
60 |
1 |
0 |
0 |
0 |
3 |
11 |
0 |
3 |
|
PtrMTP12 |
111 |
5 |
0 |
0 |
1 |
6 |
9 |
0 |
0 |
6. Potential miRNA Target Sites in PtrMTP Genes
To explore the probable regulatory mechanism of PtrMTP gene expression at the post-transcriptional level, potential miRNAs target sites were predicted using psRNATarget. Finally, we successfully identified a total of 11 miRNAs that targeted 8 PtrMTP genes (Table 4). Among these, PtrMTP12 comprised target sites for three miRNAs (ptc-miR6427-3p, ptc-miR172b-5p and ptc-miR172g-5p), four PtrMTP genes, i.e., PtrMTP7, PtrMTP8.1, PtrMTP11.1 and PtrMTP11.2, contained target sites for two miRNAs, and the remaining three (PtrMTP1.1, PtrMTP3.1 and PtrMTP10.3) possessed target sites for single miRNA. Moreover, most of the identified miRNAs function by cleaving target mRNAs, while ptc-miR6426a, ptc-miR6426b, ptc-miR473b and ptc-miR480 work by translation inhibition. In addition, the value of target accessibility-maximum energy to unpair the target site (UPE) of the miRNA/PtrMTP varied from 13.362 (ptc-miR480/PtrMTP7) to 19.17 (ptc-miR6466-3p/PtrMTP10.3).
Table 4. The potential miRNA target sites in PtrMTP genes.
|
miRNA Acc. |
Target Acc. |
Expectation |
UPE |
miRNA Length |
Target Start-End |
miRNA Aligned Fragment |
Target Aligned Fragment |
Inhibition |
|
ptc-miR473b |
PtrMTP1.1 |
2.5 |
15.471 |
20 |
932–951 |
GCUCUCCCUCAGGGCUUCCA |
UUGAAGUCCUGAUGGAGAGC |
Cleavage |
|
ptc-miR2111a |
PtrMTP11.2 |
3 |
16.046 |
21 |
550–571 |
UAAUCUGC-AUCCUGAGGUUUG |
GCAACUUUAGGAUUGCAGAUUA |
Cleavage |
|
ptc-miR2111a |
PtrMTP11.1 |
3 |
13.919 |
21 |
550–571 |
UAAUCUGC-AUCCUGAGGUUUG |
GCAACUUUAGGAUUGCAGAUUA |
Cleavage |
|
ptc-miR2111b |
PtrMTP11.2 |
3 |
16.046 |
21 |
550–571 |
UAAUCUGC-AUCCUGAGGUUUG |
GCAACUUUAGGAUUGCAGAUUA |
Cleavage |
|
ptc-miR2111b |
PtrMTP11.1 |
3 |
13.919 |
21 |
550–571 |
UAAUCUGC-AUCCUGAGGUUUG |
GCAACUUUAGGAUUGCAGAUUA |
Cleavage |
|
ptc-miR6426a |
PtrMTP8.1 |
3 |
19.01 |
21 |
162–182 |
GUGGAGACAUGGAAGUGAAGA |
UUUUCACUUUAAUGUCUCUAA |
Translation |
|
ptc-miR6426b |
PtrMTP8.1 |
3 |
19.01 |
21 |
162–182 |
GUGGAGACAUGGAAGUGAAGA |
UUUUCACUUUAAUGUCUCUAA |
Translation |
|
ptc-miR6427-3p |
PtrMTP12 |
3 |
15.602 |
21 |
900–920 |
GUGGGAAUGAACAUUAUGAGA |
AAUUAUACUGUUUAUUCCUGC |
Cleavage |
|
ptc-miR172b-5p |
PtrMTP12 |
3.5 |
16.256 |
21 |
1705–1725 |
GGAGCAUCAUCAAGAUUCACA |
GGUGGCUCUGGAUCAUGCUCC |
Cleavage |
|
ptc-miR172g-5p |
PtrMTP12 |
3.5 |
16.256 |
21 |
1705–1725 |
GGAGCAUCAUCAAGAUUCACA |
GGUGGCUCUGGAUCAUGCUCC |
Cleavage |
|
ptc-miR473b |
PtrMTP3.1 |
3.5 |
18.76 |
20 |
989–1008 |
GCUCUCCCUCAGGGCUUCCA |
UGGAGGUUCUCAUGGAGAGC |
Translation |
|
ptc-miR480 |
PtrMTP7 |
3.5 |
13.362 |
24 |
1122–1145 |
ACUACUACAUCAUUGACGUUGAAC |
AAUAGAUUUCAAUGGAGUAGUGGU |
Translation |
|
ptc-miR6464 |
PtrMTP7 |
3.5 |
14.684 |
21 |
344–364 |
UGAUUGCUUGUUGGAUAUUAU |
AACAUAGUCAACGAGCAGUCA |
Cleavage |
|
ptc-miR6466-3p |
PtrMTP10.3 |
3.5 |
19.17 |
21 |
1009–1029 |
UAUCAAUCAUCAAAUGUUCGU |
GAGAACGUUUGGUCGUUGAUC |
Cleavage |
7. The Temporal and Spatial Expression Patterns of PtrMTP Genes
The tissue expression patterns of PtrMTPs were investigated by using transcriptome data. As shown in Figure 6, all 22 PtrMTP genes were expressed in the 12 tested tissues (log2(FPKM+1) > 0), except for PtrMTP8.6 (which had weak expression only in late dormant bud, root and male catkin) and PtrMTP10.3 (unexpressed in female catkin, fully open bud, root tip and early dormant bud). Among these, seven genes (PtrMTP3.2, PtrMTP12, PtrMTP11.2, PtrMTP6, PtrMTP1.1, PtrMTP5 and PtrMTP7) showed constitutive expression (log2(FPKM+1) > 1 in all tissues), and PtrMTP3.2 had the highest expression levels compared with other PtrMTPs in all detected tissues, except for in late dormant bud, whereas two genes (PtrMTP8.6 and PtrMTP10.2) exhibited the lowest expression levels in all tissues (0 < log2(FPKM+1) < 1). Moreover, some genes exhibited tissue-specific expression. For instance, four genes (PtrMTP8.5, PtrMTP8.2 and PtrMTP8.4) in late dormant bud, three genes (PtrMTP9 and PtrMTP10.3) in root, four genes (PtrMTP3.1, PtrMTP10.1 and PtrMTP11.1) in male catkin, and one gene (PtrMTP10.4) in stem nodes showed the highest transcript abundances.
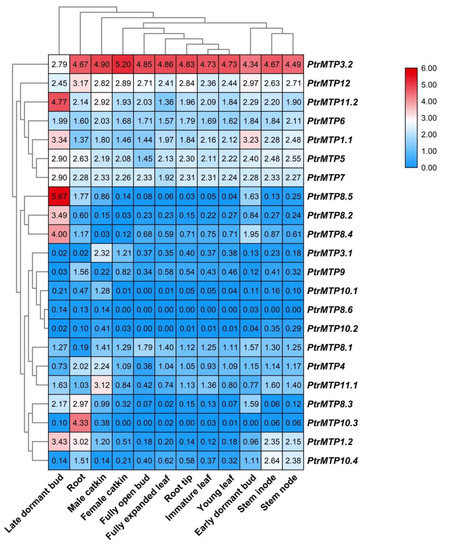
Figure 6. Heatmap analysis of the abundance of PtrMTP transcripts in different poplar tissues at different developmental stages. Normalized gene expression (FPKM+1) is expressed in log2 ratio.
8. Expression Profiles of PtrMTPs under Different Heavy Metal Treatments
To gain more insight into the gene expression regulatory mechanism of PtrMTPs, four-week-old tested tube plantlets of P. trichocarpa were subjected to seven different metal treatments. The relative expression levels of PtrMTPs in roots, stems and leaves were investigated.
Under normal conditions, the expression levels of PtrMTP4, PtrMTP8.3, PtrMTP8.4, PtrMTP8.5, PtrMTP10.2 and PtrMTP10.4 were higher in roots, whereas those of the PtrMTP1.1, PtrMTP7, PtrMTP9, PtrMTP10.1, PtrMTP10.3, PtrMTP11.1 and PtrMTP12 genes displayed higher expression levels in stems, and PtrMTP3.1, PtrMTP3.2, PtrMTP11.2 genes displayed higher expression levels in leaves. However, the PtrMTP1.2, PtrMTP5 and PtrMTP8.2 genes showed similar expression levels in roots and stems, which were higher than those in the leaves. PtrMTP6, PtrMTP8.1 and PtrMTP8.6 have similar expression levels in stems and leaves, which were higher than those in roots (Figure 7).
We present an overview of the expression levels of all the PtrMTP genes under heavy metal toxicity relative to these under normal conditions in Table 5. In detail, we summarized the PtrMTP genes in each tissue with expression changes over four times: In root, Cd enhanced the expression of PtrMTP11.1; Cu increased the expression levels of PtrMTP8.1 and PtrMTP10.3, but decreased the expression levels of PtrMTP9; Mn repressed the expression levels of PtrMTP9 and PtrMTP10.3; Ni also repressed the expression levels of PtrMTP10.3, but Zn enhanced its expression. In stem, Cd repressed the expression levels of PtrMTP12; Co increased the expression levels of PtrMTP8.6 but decreased the expression levels of PtrMTP10.3; Cu increased the expression levels of PtrMTP8.3; Mn increased the expression levels of PtrMTP8.1, PtrMTP8.3, PtrMTP8.4, PtrMTP8.5, PtrMTP10.4 and PtrMTP11.2; Ni repressed the expression levels of PtrMTP10.3. In leaf, Cu enhanced the expression of PtrMTP5, PtrMTP8.2, PtrMTP8.3, PtrMTP8.4, PtrMTP8.5, PtrMTP10.1, PtrMTP10.2, PtrMTP10.3, PtrMTP10.4, and PtrMTP11.1; Fe increased the expression levels of PtrMTP9, PtrMTP10.1, and PtrMTP10.3; Mn increased the expression levels of PtrMTP10.3; Zn increased the expression levels of PtrMTP8.4, PtrMTP10.1, PtrMTP10.3, and PtrMTP10.4 (Figure 7 and Table 5). However, the expression levels of the PtrMTP3.1, PtrMTP3.2 and PtrMTP6 genes nearly did not change in each tissue under heavy metal toxicity (Figure 7 and Table 5).
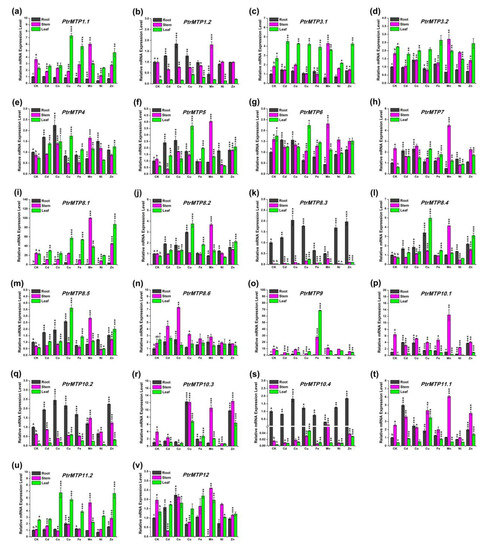
Figure 7. Relative expression levels of PtrMTP genes under various metal ion stresses in roots, stems or leaves. Data represent means ± SD of three biological replicates. CK represent control samples. Different letters (a, b and c) indicate significant differences among roots, stems and leaves under normal condition (n = 9, p < 0.05, Student’s t-test). Asterisks indicate significant differences between the treatment samples and the corresponding control samples in roots, stems or leaves. (n = 9, p < 0.05, Student’s t-test). (a–v) stands for the PtrMTP1.1-PtrMTP12, respectively.
Table 5. Overview of PtrMTP genes in response to different heavy metal stresses.
|
Gene Name |
In Roots |
|
In Stems |
|
In Leaves |
||||||||||||||||||
|
Cd |
Co |
Cu |
Fe |
Mn |
Ni |
Zn |
|
Cd |
Co |
Cu |
Fe |
Mn |
Ni |
Zn |
|
Cd |
Co |
Cu |
Fe |
Mn |
Ni |
Zn |
|
|
PtrMTP1.1 |
No |
No |
No |
No |
No |
- |
No |
|
- |
No |
No |
No |
No |
- |
No |
|
No |
No |
+ |
+ |
No |
No |
+ |
|
PtrMTP1.2 |
No |
No |
No |
No |
- |
No |
No |
|
No |
No |
No |
No |
No |
No |
No |
|
No |
No |
+ |
No |
No |
No |
No |
|
PtrMTP3.1 |
No |
No |
No |
No |
No |
No |
No |
|
No |
No |
No |
No |
+ |
No |
No |
|
No |
No |
No |
No |
No |
No |
No |
|
PtrMTP3.2 |
No |
No |
No |
No |
No |
No |
No |
|
No |
No |
- |
No |
No |
No |
No |
|
No |
No |
No |
No |
No |
No |
No |
|
PtrMTP4 |
No |
+ |
No |
No |
No |
No |
No |
|
No |
No |
No |
No |
No |
No |
No |
|
No |
+ |
+ |
No |
No |
No |
No |
|
PtrMTP5 |
+ |
+ |
No |
No |
No |
No |
No |
|
- |
No |
No |
No |
+ |
No |
No |
|
+ |
No |
++ |
+ |
+ |
No |
+ |
|
PtrMTP6 |
No |
No |
No |
No |
- |
No |
No |
|
No |
No |
No |
No |
No |
No |
No |
|
No |
No |
No |
No |
No |
No |
No |
|
PtrMTP7 |
+ |
+ |
No |
No |
No |
No |
No |
|
No |
No |
No |
No |
No |
- |
No |
|
+ |
+ |
+ |
+ |
No |
No |
+ |
|
PtrMTP8.1 |
+ |
No |
++ |
No |
No |
No |
+ |
|
- |
- |
No |
- |
++ |
- |
No |
|
No |
No |
+ |
+ |
No |
No |
+ |
|
PtrMTP8.2 |
No |
No |
+ |
No |
No |
No |
No |
|
No |
No |
No |
No |
+ |
No |
No |
|
No |
No |
++ |
+ |
No |
No |
+ |
|
PtrMTP8.3 |
No |
+ |
No |
No |
- |
No |
No |
|
No |
+ |
++ |
No |
+++ |
No |
+ |
|
No |
No |
++ |
+ |
No |
No |
+ |
|
PtrMTP8.4 |
No |
No |
+ |
No |
No |
No |
+ |
|
No |
No |
No |
No |
++ |
No |
No |
|
No |
No |
++ |
+ |
No |
No |
++ |
|
PtrMTP8.5 |
No |
No |
+ |
No |
No |
No |
No |
|
No |
No |
No |
No |
++ |
No |
No |
|
No |
No |
++ |
+ |
No |
No |
+ |
|
PtrMTP8.6 |
+ |
+ |
No |
No |
+ |
No |
No |
|
+ |
++ |
No |
No |
No |
No |
No |
|
No |
No |
No |
No |
No |
No |
No |
|
PtrMTP9 |
No |
No |
-- |
No |
--- |
No |
No |
|
- |
No |
- |
+ |
No |
No |
No |
|
- |
No |
No |
+++ |
No |
No |
No |
|
PtrMTP10.1 |
+ |
+ |
No |
No |
No |
- |
+ |
|
- |
No |
No |
No |
No |
- |
No |
|
+ |
+ |
+++ |
++ |
+ |
No |
++ |
|
PtrMTP10.2 |
No |
+ |
+ |
No |
No |
No |
+ |
|
No |
No |
No |
No |
+ |
No |
No |
|
No |
No |
++ |
+ |
+ |
No |
+ |
|
PtrMTP10.3 |
No |
No |
+++ |
No |
No |
-- |
+++ |
|
No |
--- |
+ |
- |
+ |
-- |
+ |
|
+ |
No |
+++ |
++ |
++ |
No |
+++ |
|
PtrMTP10.4 |
No |
No |
No |
No |
- |
No |
No |
|
No |
No |
+ |
- |
+++ |
No |
+ |
|
+ |
+ |
+++ |
+ |
+ |
+ |
+++ |
|
PtrMTP11.1 |
++ |
+ |
No |
No |
No |
No |
No |
|
No |
No |
No |
No |
+ |
- |
No |
|
+ |
No |
+++ |
+ |
No |
No |
+ |
|
PtrMTP11.2 |
No |
No |
+ |
No |
No |
No |
No |
|
No |
No |
No |
No |
++ |
No |
+ |
|
No |
+ |
+ |
No |
No |
No |
+ |
|
PtrMTP12 |
No |
+ |
No |
No |
---- |
No |
No |
|
-- |
No |
- |
No |
No |
No |
No |
|
No |
No |
No |
No |
No |
No |
No |
Notes: “+” and “-” indicate 2 < change fold < 4; “+ +” and “- -” indicate 4 < change fold < 8; “+ + +” and “- - -” indicate 8 < change fold < 16; “- - - -” indicates 16 < change fold. “No” indicates that the transcript underwent no change (change fold<2).
9. Effect of PtrMTP Genes on Yeast Growth
According to the expression analysis results and the categories of PtrMTP genes, we selected six representative PtrMTP genes (PtrMTP4, PtrMTP6, PtrMTP8.1, PtrMTP8.4, PtrMTP9, and PtrMTP10.4) as the objects for a yeast metal sensitivity testing assay. These genes were expressed in the parental strain BY4741 and five yeast mutants that are highly sensitive to Cd (Δycf1), Co (Δcot1), Fe (Δccc1), Mn (Δpmr1) and Zn (Δzrc1), respectively. As shown in Figure 8, the expression of PtrMTP6 could rescue the sensitivities of Δcot1, Δccc1 and Δpmr1 to Co, Fe and Mn, respectively. Moreover, the expressions of PtrMTP8.1, PtrMTP9 and PtrMTP10.4 alleviated the sensitivity of Δpmr1 to Mn. However, the expression of PtrMTP4 and PtrMTP8.4 could not alter any sensitive phenotypes of the mutants tested. These results suggested that PtrMTP8.1, PtrMTP9 and PtrMTP10.4 could transport Mn2+, while PtrMTP6 could transport Mn2+, Co2+ and Fe2+ in yeast cells.
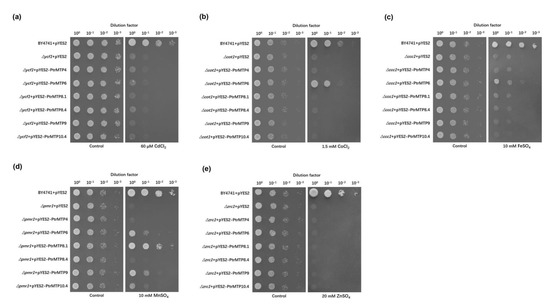
Figure 8. Complementation of yeast mutants on solid medium containing heavy metals. S. cerevisiae wild-type strain BY4741 was transformed with the empty vector pYES2, and mutants strains were transformed with the empty vector pYES2 or with the vectors carrying the PtrMTP gene, respectively. Yeast cultures were adjusted to OD600 = 0.2, and 2 μL of serial dilutions (10-fold, from left to right in each panel) were spotted on SD-Ura/Gal medium supplemented with 60 μM CdCl2 (a), 1 mM CoCl2 (b), 10 mM FeSO4 (c), 10 mM MnSO4 (d), or 20 mM ZnSO4 (e) or on the SD-Ura/Glu medium (control) without supplementation. The plates were incubated for 2–4 days at 30 °C. The images are representative for three independent experiments.
References
- Aude Migeon; Damien Blaudez; Olivia Wilkins; Barbara Montanini; Malcolm M. Campbell; Pierre Richaud; Sébastien Thomine; Michel Chalot; Genome-wide analysis of plant metal transporters, with an emphasis on poplar. Cellular and Molecular Life Sciences 2010, 67, 3763-3784, 10.1007/s00018-010-0445-0.
- Laurence D. Hurst; The Ka/Ks ratio: diagnosing the form of sequence evolution.. Trends in Genetics 2002, 18, 486-487, 10.1016/s0168-9525(02)02722-1.


