Over the past decade, there have been an increasing number of articles in the ergonomics literature that have used wearable sensors to capture human motion data for analysis and decision-making. The relationship between the postures and the occupations of adults has been studied for a long time, and in terms of evacuation, researchers have found that adopting different postures significantly affects survival rates, but little is known about children. Moreover, children are more vulnerable than adults during evacuation, as they are physically, mentally, and physiologically underdeveloped. Recently, researchers have become increasingly interested in the motor skills and evacuation behavior of children. However, ergonomic findings on the evacuation behavior of children with a motion capture system remain limited; therefore, an in-depth study concerning the dynamic behavior of children is necessary.
1. Analysis on Research Results
1.1. Evacuation Postures
1.1.1. Upright Walking
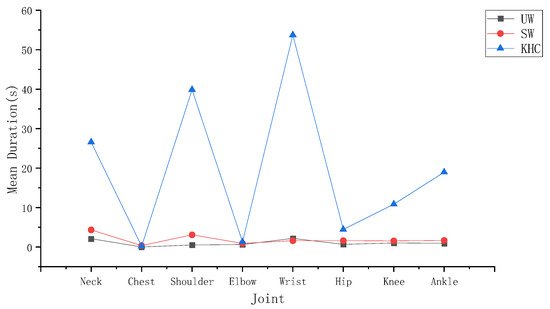
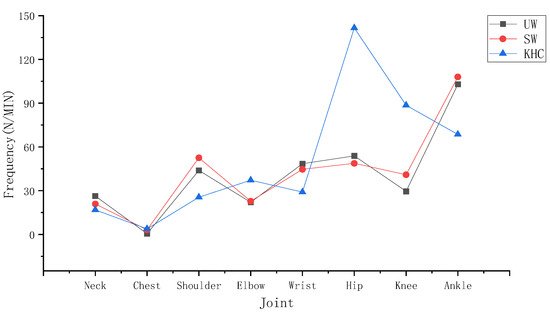
During upright walking, several characteristics can be observed according to Figure 1 and Figure 2. First, the wrist had the highest mean duration of angles above the alert threshold (2.34 S) among the joints measured in UW. The ankle had the highest frequency of angles above the alert threshold (105.89 N/MIN) among the joints. Second, to further analyse the level of variability between the joints, an ANOVA test was conducted, which showed that there was a significant difference both between the neck and other joints (p < 0.05) and between the ankle and other joints (p < 0.05). In conclusion, the neck and the ankle are more prone to fatigue than the other joints during UW.
Figure 1. The mean joint duration. UW—upright walking; SW—stoop walking; KHC—knee and hand crawling.
Figure 2. The joint frequency. UW—upright walking; SW—stoop walking; KHC—knee and hand crawling.
To further analyse which key action makes the wrist and ankle more fatigued in UW, a paired t-test was conducted to determine the differences between the exposure corresponding to different actions. According to Table 1, in terms of the mean duration of the wrist, the key action ADD/ABD (1.5 S) was close to the FLE/EXT (1.29 S). the results indicated that no significant difference was observed for the wrist measurements (p > 0.05) in UW. Similarly, in terms of the ankle frequency, the key action FLE/EXT (83.55 N/MIIN) was 2.36 times higher than the ROT (21.887 N/MIN). The ankle measurement (p < 0.05) was significantly different between FLE/EXT and ROT, which means that FLE/EXT was more likely to fatigue the ankle than ROT during UW.
Table 1. Kinematic characteristics of joints in different postures.
| Posture |
Joint |
Action |
Mean |
p |
| UW |
Wrist |
ADD/ABD |
1.50 |
0.40 |
| FLE/EXT |
1.29 |
| Ankle |
ROT |
21.87 |
0.00 |
| FLE/EXT |
83.55 |
| SW |
Neck |
FLE/EXT |
4.14 |
0.00 |
| ROT |
0.22 |
| LF |
0.22 |
| Ankle |
ROT |
25.34 |
0.00 |
| FLE/EXT |
85.13 |
| KHC |
Wrist |
FLE/EXT |
59.70 |
0.00 |
| ADD/ABD |
28.56 |
| Hip |
ADD/ABD |
40.25 |
0.18 |
| FLE/EXT |
45.65 |
| ROT |
56.85 |
1.1.2. Stoop Walking
In stoop walking, as seen in Figure 1 and Figure 2, the neck had the highest mean angle duration exceeding the alert threshold (4.58 S) among the joints measured during SW. The ankle had the highest angle frequency exceeding the alert threshold (110.47 N/MIN) among the joints measured in SW. To further analyse the level of variability between the joints, an ANOVA test was conducted , which showed significant differences both between the neck and the other joints (p < 0.05) and between the ankle and the other joints (p < 0.05). In conclusion, the neck and ankle are more prone to fatigue than other joints during SW.
To further demonstrate which key action made the neck and ankle more fatigued during SW, paired t-tests was conducted for the ankle and ANOVA tests for the neck. According to Table 1, in terms of the mean duration of the neck, the key action FLE/EXT (4.14 S) was much longer than the ROT (0.22 S) and the LF (0.22 S). Moreover, according to Table 1, the neck measurements during SW (p < 0.05) were significantly different among the key actions FLE/EXT, ROT, and LF, which means that FLE/EXT was more likely to fatigue the neck than ROT and LF. In terms of the ankle frequency, the key action FLE/EXT (85.13 N/MIIN) was 1.69 times higher than ROT (25.34 N/MIN). The ankle measurement (p < 0.05) was significantly different between FLE/EXT and ROT, which means that FLE/EXT was more likely to fatigue the ankle than ROT during SW.
1.1.3. Knee and Hand Crawling
During knee and hand crawling, as seen in Figure 1 and Figure 2, the wrist had the highest mean duration angle exceeding the alert threshold (88.26 S) among the joints measured during KHC; the hip had the highest angle frequency exceeding the alert threshold (142.75 N/MIN) among the joints. To further analyse the level of variability in each joint, an ANOVA test was conducted, which showed significant differences both between the wrist and the other joints (p < 0.05) and between the hip and the other joints (p < 0.05). In summary, the wrist and hip are more prone to fatigue than the other joints during KHC.
To further analyse which key action makes the wrist and hip more fatigued in KHC, data statistics with paired t-tests was conducted for the wrist and ANOVA tests for the hip. In terms of the mean duration of the wrist, the key action FLE/EXT (59.70 S) was 109% higher than that of ADD/ABD (28.56 S). As shown in Table 1, there was a significant difference between the action FLE/EXT and ADD/ABD (p < 0.05), which means that FLE/EXT was more likely to fatigue than the wrist than ADD/ABD. In terms of the frequency of the hip, the key action ROT (56.85 N/MIIN) was 41% and 25% higher than ADD/ABD (40.25 N/MIN) and FLE/EXT (45.65 N/MIN), respectively. According to Table 1, however, the results indicate that no significant difference was observed for the measurement of the hip (p > 0.05) in KHC.
1.1.4. Comparison of the Three Situations
The effect of different postures were evaluated on the joints based on the mean duration and the frequency of joints reaching the alert thresholds in different postures. To further validate the results, the related variable measurements were compared among these three situations using the ANOVA test, and all were tested at a 95% confidence level.
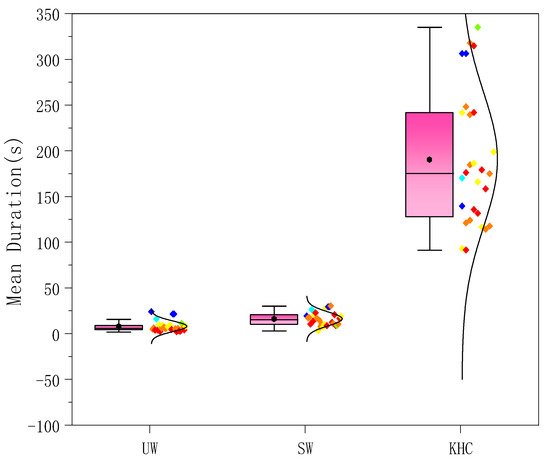
The mean duration of each joint in the different postures was counted for the subjects. Figure 3 shows the average for the 27 subjects. The mean duration of the joints during KHC far exceeded that of UW and SW. According to Table 2, there were significant differences among the three postures (p < 0.05), specifically between KHC and UW (p < 0.05) and between KHC and SW (p < 0.05).
Figure 3. The mean duration of joints in three postures. UW—upright walking; SW—stoop walking; KHC—knee and hand crawling.
Table 2. Relationship among postures with motion-capture measures.
| Motion Indicators |
UW-SW |
UW-KHC |
SW-KHC |
KHC-SW-UW |
| p |
p |
p |
p |
| Mean Duration |
0.484 |
0.000 |
0.000 |
0.000 |
| Frequency |
0.378 |
0.006 |
0.054 |
0.018 |
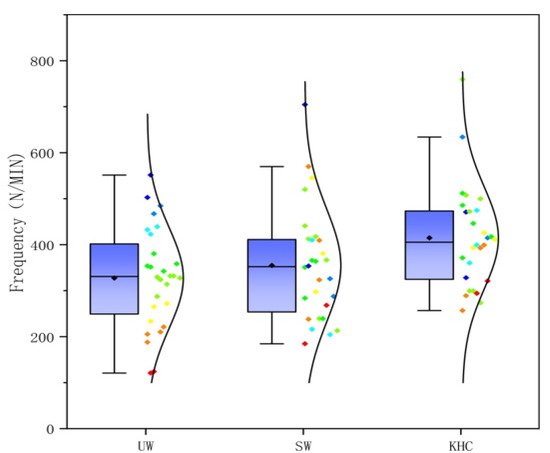
The frequency of each joint in different postures was counted for the subjects. Figure 4 shows the average for the 27 subjects. The relationship for the frequency among the three postures was KHC > UW > SW, with KHC being 26.57% and 16.88% higher than UW and SW, respectively. As seen in Table 2, there was a significant difference (p < 0.05) among the three postures, specifically between KHC and SW (p < 0.05) and between KHC and UW (p < 0.05).
Figure 4. The frequency of joints in three postures. UW—upright walking; SW—stoop walking; KHC—knee and hand crawling.
1.2. The Effect of Age/Gender on Children’s Joints
In order to analyse whether gender/age had an effect on the joints when the children were in different postures, statistical analyses were conducted, and the data were subjected to paired t-tests for gender and ANOVA tests for age.
1.2.1. Gender
To analyse whether there was an effect resulting from gender on the joints in different postures, independent t-tests were conducted, and a 95% confidence level test was performed. As shown in Table 3, although the mean duration and frequency in the three postures were different, the independent t-tests indicated that the mean duration and frequency were not significantly different in three different postures for the gender measurement (p > 0.05).
Table 3. Relationship between gender with motion-capture measures.
| Motion Indicators |
Gender |
UW |
SW |
KHC |
| Mean |
p |
Mean |
p |
Mean |
p |
| Mean Duration (S) |
Boy |
9.58 |
0.637 |
41.01 |
0.689 |
138.01 |
0.146 |
| Girl |
8.39 |
31.38 |
194.70 |
| Frequency (N/MIN) |
Boy |
382.04 |
0.157 |
384.83 |
0.065 |
406.65 |
0.648 |
| Girl |
317.13 |
298.67 |
429.99 |
1.2.2. Age
To analyse whether there was an effect of age on the joints in different postures, we conducted an ANOVAL test. In the experiment, we collected the complete motion data from 27 children, 8 of whom were four years of age, 9 of whom were five years of age, and 10 of whom were six years of age.
As shown in Table 4, although the mean duration and frequency in three postures were different, the ANOVA tests indicated that the mean duration and frequency were not significantly different in the three different postures for the age measurement (p > 0.05).
Table 4. Relationship among ages with motion-capture measures.
| Behavioral Indicators |
Age |
UW |
SW |
KHC |
| Mean |
p |
Mean |
p |
Mean |
p |
| Mean Duration (S) |
4 |
6.47 |
0.388 |
36.32 |
0.610 |
176.98 |
0.125 |
| 5 |
11.27 |
58.57 |
123.58 |
| 6 |
8.71 |
18.09 |
60.84 |
| Frequency (N/MIN) |
4 |
315.89 |
0.673 |
288.50 |
0.429 |
370.72 |
0.119 |
| 5 |
383.03 |
345.10 |
410.89 |
| 6 |
348.28 |
369.21 |
472.81 |
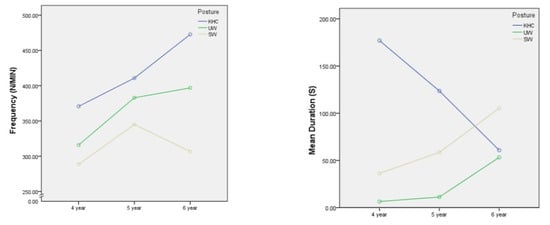
It is worth noting that when analysing the relationship between motion indicators and age, an ANOVA test was conducted. As shown in Figure 5, in the KHC posture, there is a decreasing trend in the estimated marginal means of the mean duration of joint as age increases, but the frequency increases. One possible reason for this is that children become more aware of their bodies and their ability to control them as they grow older. During KHC, when the joint angle exceeds the alert threshold, older children may immediately perceive the discomfort and make appropriate adjustments to continue crawling, whereas younger children may not be able to perceive the discomfort immediately or have no ability to adjust in time because they are not as well developed as older children. This results in a longer mean duration in younger children, while older children make appropriate adjustments resulting in an increase in frequency and a decrease in mean duration.
Figure 5. The estimated marginal mean of joints exceeding the threshold. UW—upright walking; SW—stoop walking; KHC—knee and hand crawling.
2. Current Insights
This study provides a new method to assess the effects of different evacuation postures on children’s body joints. Based on a field experimental analysis of three postures, upright walking (UW), stoop walking (SW), knee and hand crawling (KHC), this study presents the potential of motion data collected from wearable motion capture sensors to understand children’s joints during evacuation by showing differences in the mean duration and the frequency among different types of postures and the effects of gender and age.
The result of the level of joint fatigue for knee and hand crawling was heavier than bipedal walking, which is similar to the results of previous studies of evacuation postures in adults
[1]. This study showed that the wrist (
p < 0.05) and hip (
p < 0.05) were more fatigued in KHC. The results are similar to the results of previous studies on adults
[2][3]. However, the results different from those obtained during a study on infants when they crawl (Li Zhang et al., 2019). The level of distal limb joint (wrist and ankle) fatigue was heavier than proximal joint (shoulder and hip) fatigue
[4]. The possible reason for this could be due to the different growth and development of body at different stages.
In addition, the evacuation speed of the subjects in different postures was collected. The results showed that different postures were affected significantly (
p < 0.05).The average UW speed was measured at 2.29 ± 0.53 m/s, the average SW travel speed was measured at 2.07 ± 0.62 m/s, and the average KHC travel speed was measured at 0.58 ± 0.20 m/s. The average bipedal walking velocity measured during this study was faster than the velocity of children measured in previous studies
[5][6][7]. This study focused on individual behavior rather than group behavior, which would be less likely to collide. As uch the results may be faster than previous studies. Moreover, the children were even faster than adults are in bipedal walking
[8][1]. Similar results could be found in previous child evacuation studies
[6]. This new finding indicates that children are slower than adults during KHC. A paired
t-test showed that bipedal walking was significantly faster than crawling (
p < 0.05). UW was faster than SW (
p < 0.05). The velocity relationship among the different postures is similar to that of previous studies
[1]. Quadratic fitting was conducted to observe the relationship between travel distance and individual velocity. For average velocity, the adjusted R
2 of over 0.8 were achieved, with the exception of the KHC. For the fitted situation, the highest speed was found at the distances of 13.08 m, 13.17 m, and 11.60 m under UW, SW, and KHC posture, respectively. The results are different from the study on adults, whose velocities for KHC decreased significantly after traveling up to 9.14 m
[1].
The findings suggested that SW is recommended when there is a large amount of smoke. The respirable height is reduced based on the comparison analysis relationship among the postures, joints, and travel velocities. As the speed of SW, which is larger than KHC, is similar to the UW, the joint fatigue level of SW is not significantly different from UW but is lower than KHC. When adopting KHC, it is necessary to consider the effects of the reduced evacuation speed on the evacuation time. The negative impact of crawling on the joints is the heaviest among the three situations, and crawling for a long time will cause joints fatigue or could even lead to injury. It is also important to note that, in addition to the 22 m distance covered in the experiment, the children would have to continue walking during an actual evacuation. The travel velocity is likely to be further reduced due to the accumulation the fatigue level in the joints, ultimately affecting the risk level of the children, especially during emergency situations.
 +1 credit