1000/1000
Hot
Most Recent
 +1 point
Mobile laser scanning (MLS) is a progressive technology that has already demonstrated its ability to provide highly accurate measurements of road networks. Mobile innovation of the laser scanning has also found its use in forest mapping over the last decade. In most cases, existing methods for forest data acquisition using MLS result in misaligned scenes of the forest, scanned from different views appearing in one point cloud. These difficulties are caused mainly by forest canopy blocking the global navigation satellite system (GNSS) signal and limited access to the forest. We propose an approach to the processing of MLS data of forest scanned from different views with two mobile laser scanners under heavy canopy. Misaligned scenes of the forest acquired from different views were successfully extracted from the raw MLS point cloud using GNSS time-based point clustering. In order to align extracted MLS data acquired from different views under heavy forest canopy, the iterative closest point (ICP) algorithm was used. An average misalignment of 7.2 mm was achieved for the point clouds aligned using ICP algorithm. DBH was estimated from the aligned MLS data using a simple circle-fitting method with a root-mean-square error of 3.06 cm.
Generally, two approaches to the positioning of mobile mapping system (MMS) are applied for forest mapping. Primarily, the global navigation satellite system (GNSS) and inertial measurement unit (IMU) integrated system is used for this purpose. Secondly, the location relative to the starting point of the MMS survey is recorded by a positioning system integrating IMU and SLAM. Processing of data acquired by GNSS-IMU-Based mobile laser scanning (MLS) with weak GNSS signal is a challenging task. Weak GNSS signal is typical for forests with heavy canopy. Outages in GNSS signal cause errors in MMS trajectory location. This leads to multiple copies of objects that appear in the MLS point cloud, generated using the erroneous trajectory each time the objects are scanned (Figure 1).
Spatial division of the misaligned MLS data from forest can lead to discontinuity in the GNSS time data. Therefore, the data scanned from different views are separated in the histogram of GNSS time by the gaps in the histogram (bins with no observations) (Figure 2). The gaps in the histogram of GNSS time represent time periods during which the laser beam emitted from the mobile laser scanner is occluded by the trees outside the area of interest, and thus the beam does not reach the trees or ground located within the area.
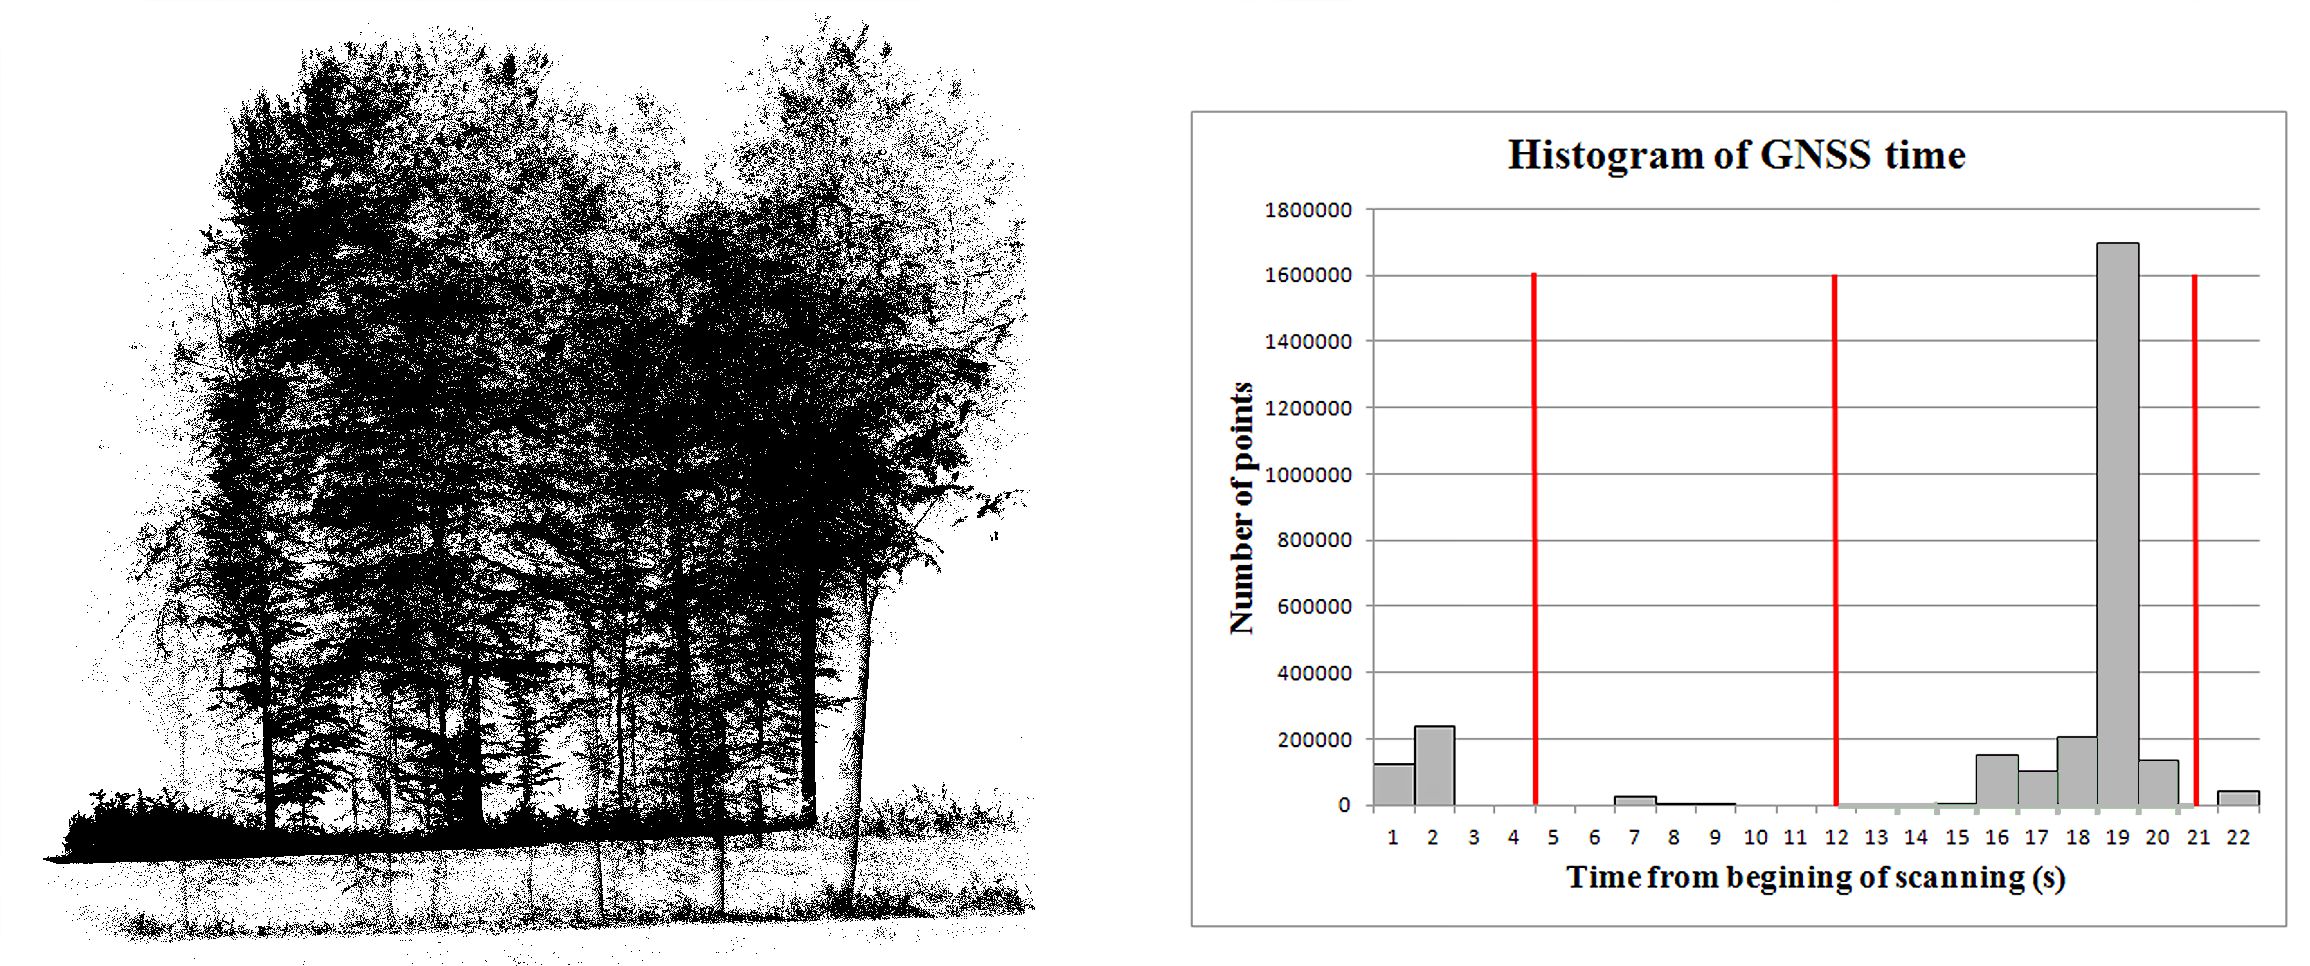
Figure 1. Part of the point cloud extracted using the geometry of the polygon feature with its histogram of GNSS time. The histogram of GNSS time for the point cloud is shown in the right part of the figure.
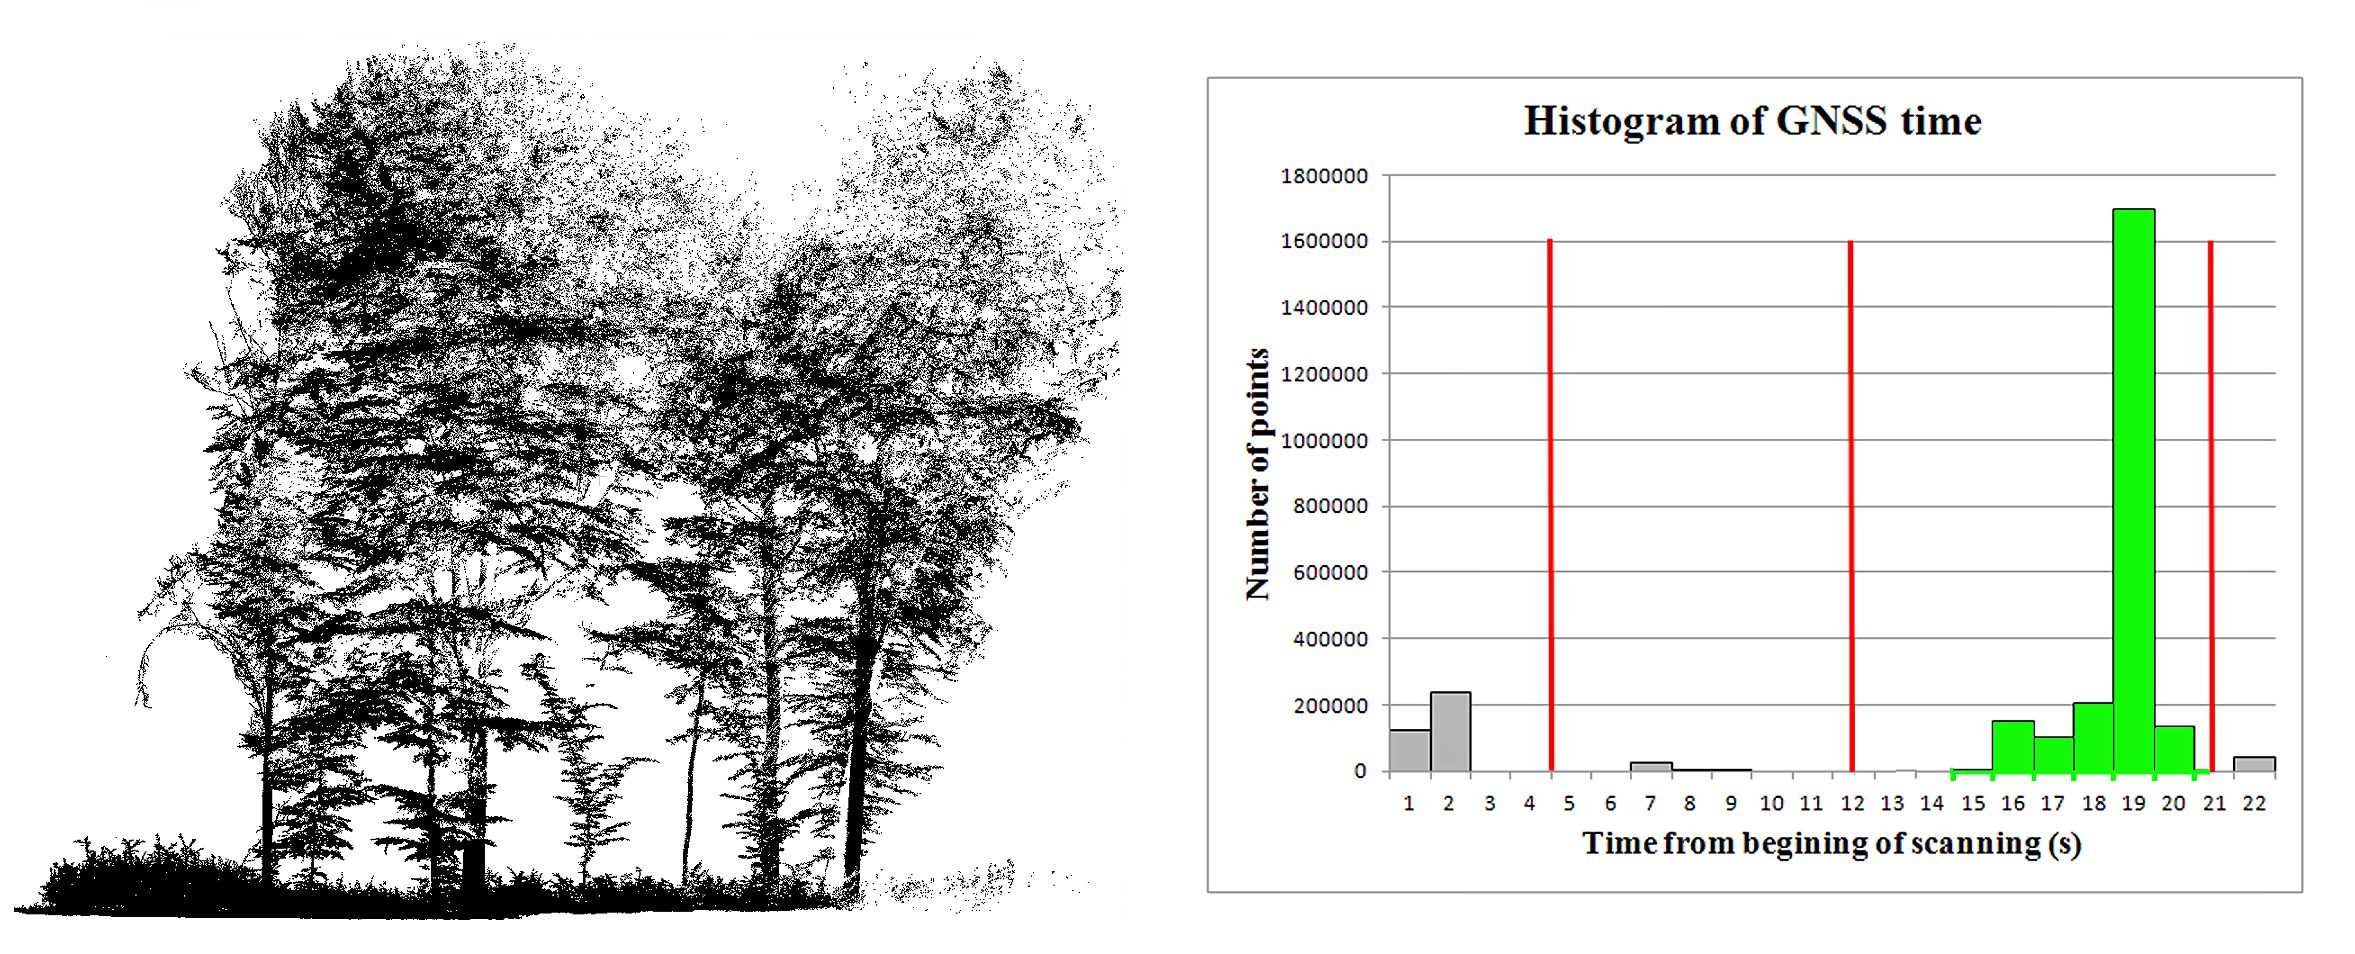
Figure 2. One of the point clouds extracted from the point cloud shown in Figure 1 using GNSS time-based point clustering. The point cloud consists of the highest number of points. The histogram of GNSS time for the point cloud is shown in the right part of the figure. The part of the histogram that corresponds to the displayed point cloud is highlighted in green.
Obviously, GNSS time-based point clustering leads to certain loss of points, which is dependent mostly on duration of GNSS signal outage and time from the latest static GNSS measurement (Figure 3). According to Čerňava et al. [1], the loss of points after the clustering can amount to 33.48% for point cloud from broadleaved forest with heavy forest canopy.
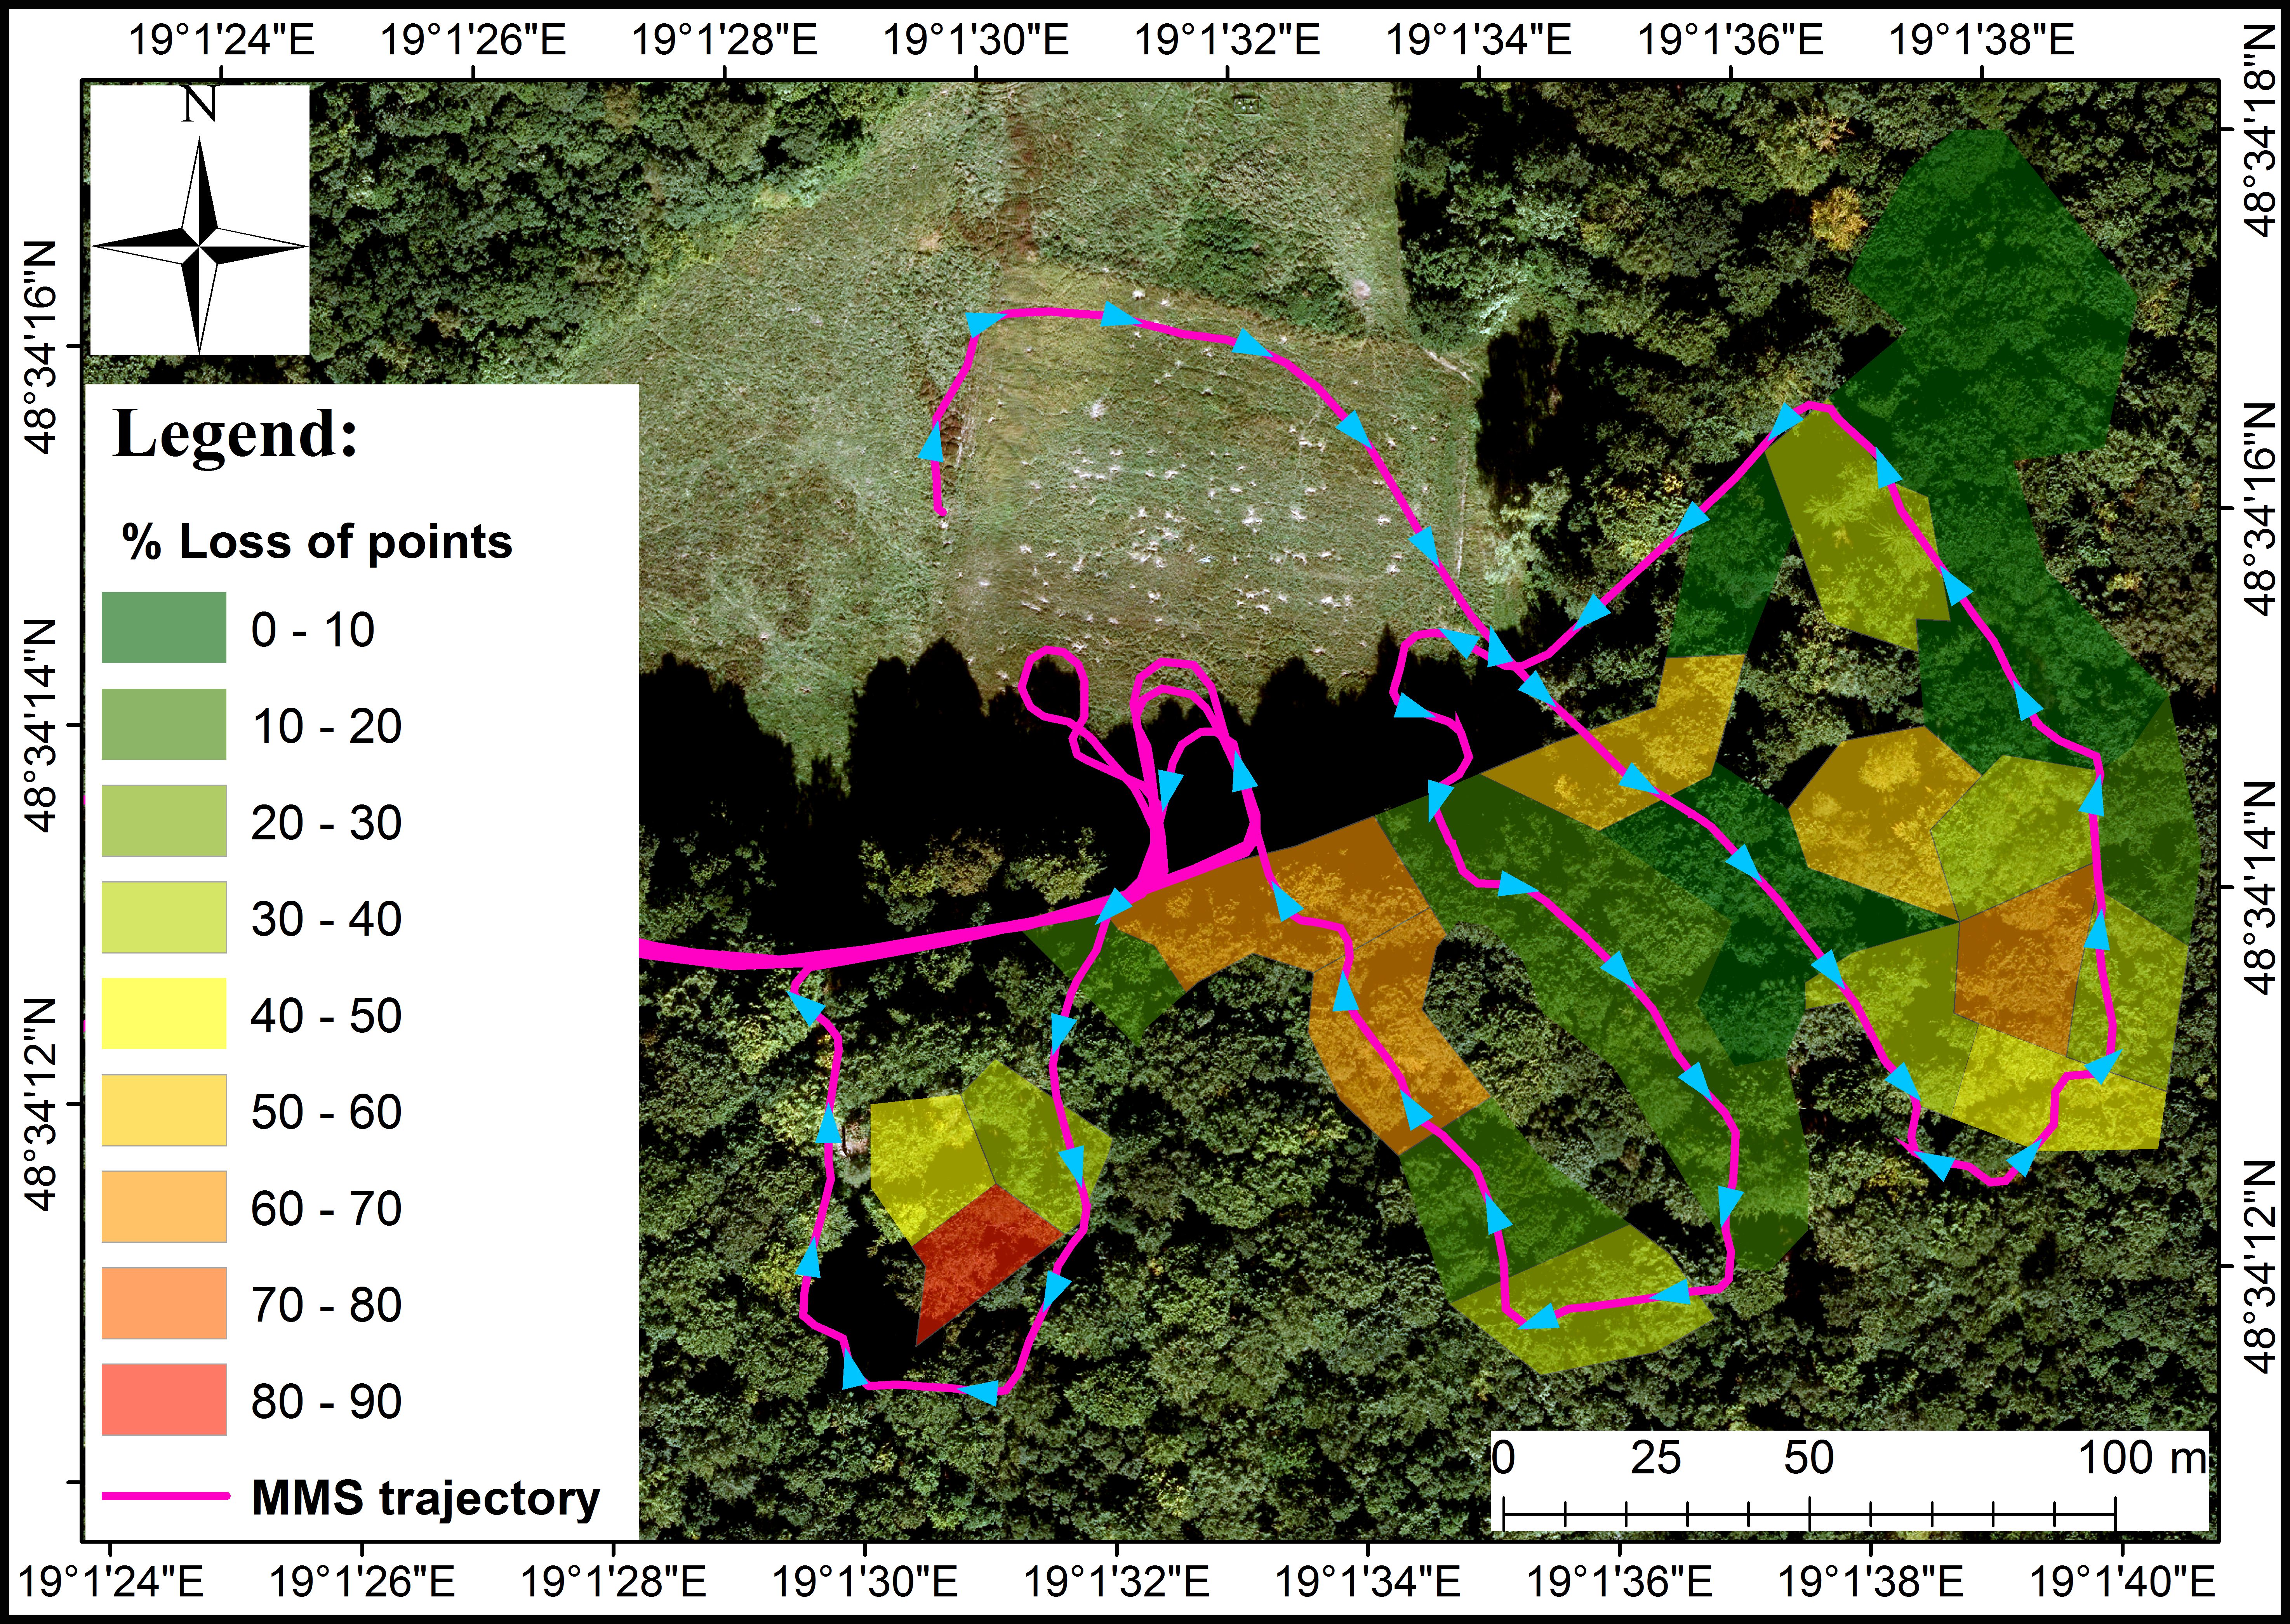
Figure 3. Percentage loss of points after GNSS time-based clustering for individual tiles of point cloud with static GNSS measurement at the begging of the survey. The direction of the MMS trajectory is highlighted by teal arrows.
In order to align extracted MLS data acquired from different views under heavy forest canopy, the iterative closest point (ICP) algorithm can be used (Figure 4).
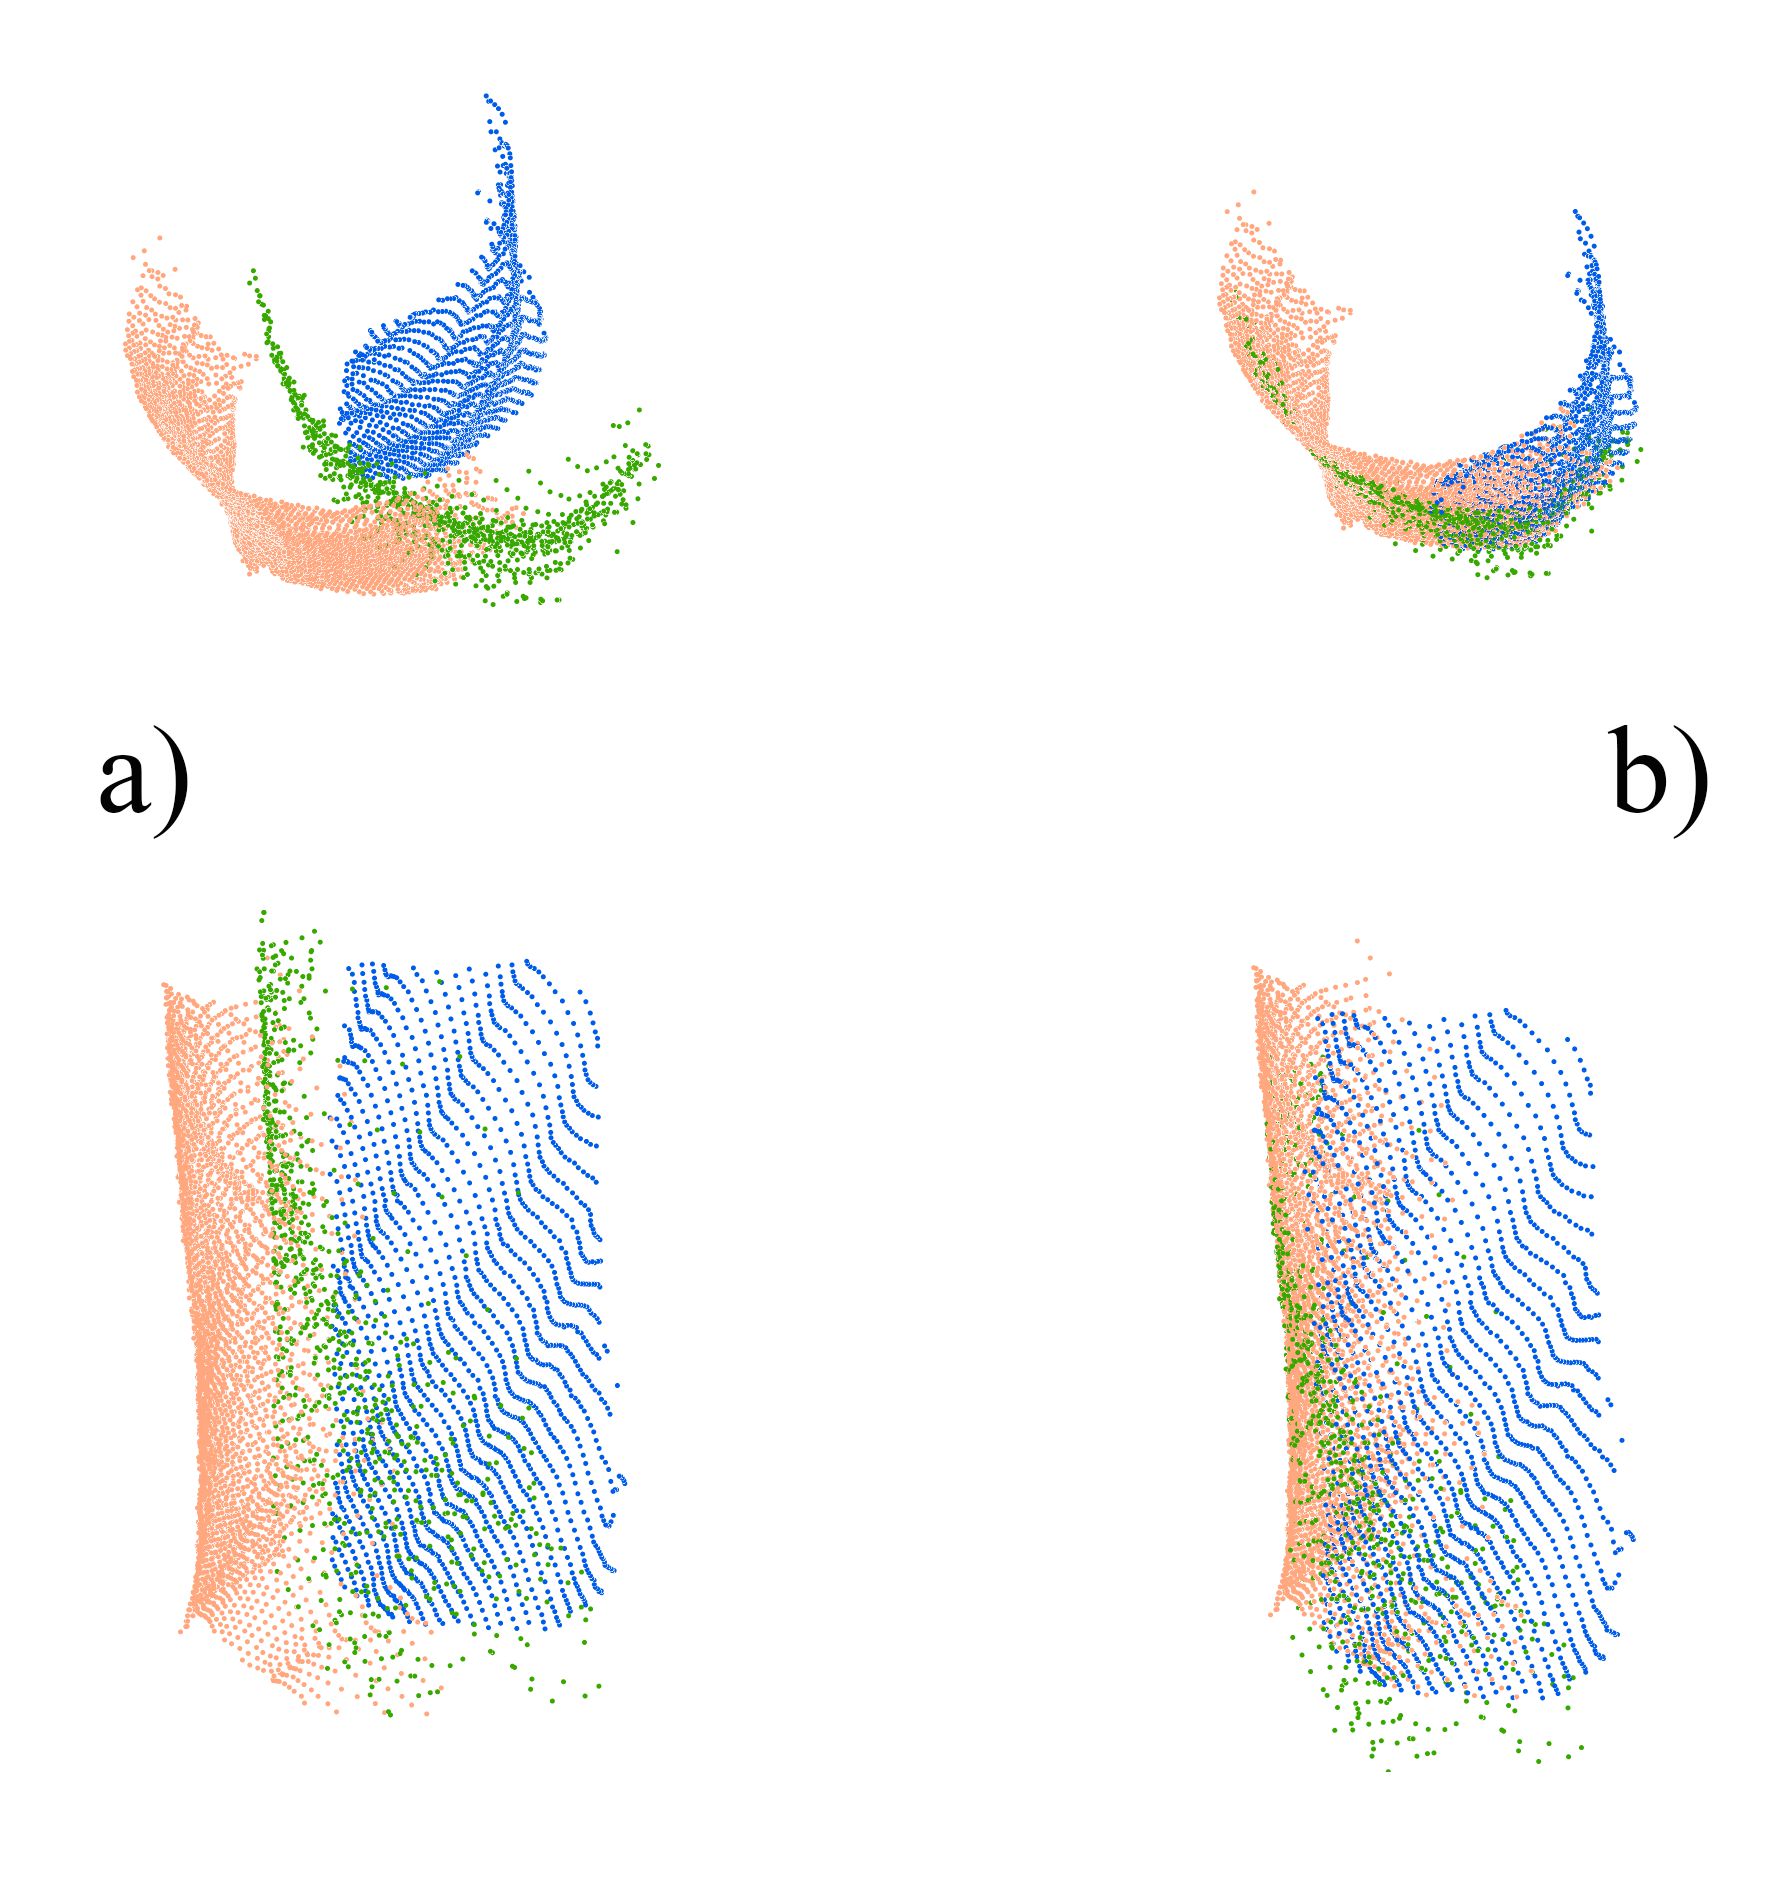
Figure 4. Point clusters from the same tree stem before (a) and after the ICP-based registration (b).
The average misalignment between the reference and the transformed point clouds defined as standard deviation of the residual point-to-plane distances of 7.2 mm was demonstrated in Čerňava et al. [1] using the ICP algorithm of Glira et al. [2]. The ICP-based registration can then improve MLS coverage of the scanned tree by a large amount. Generally, MLS coverage of the tree stem describes the feasibility of the point cloud for the tree modeling. Moreover, the MLS coverage influences the accuracy of DBH estimation. DBH can be estimated using a simple circle-fitting method with root-mean-square error of 3.06 cm from MLS data with 55.95% coverage of tree stem [1]. Further analysis of DBH estimation indicates that the accuracy of the DBH estimation from the GNSS-IMU-based MLS point cloud with higher coverage of the tree stem (above 60%) processed using ICP-based processing chain can be comparable with accuracy of the DBH estimation from SLAM-Based MLS point cloud (Table 1) [1].
Table 1. Mean error (e), absolute root-mean-square error (RMSE) and relative root-mean-square error (%RMSE) in DBH estimation from individual aligned MLS point clouds for different MLS coverage extent with sample size of N and mean diameter of d.
|
MLS Coverage (%) |
N |
d (cm) |
e (cm) |
RMSE (cm) |
%RMSE (%) |
|
20–30 |
5 |
58.30 |
–2.39 |
3.53 |
6.06 |
|
30–40 |
7 |
54.08 |
.44 |
6.74 |
12.46 |
|
40–50 |
38 |
44.88 |
1.22 |
3.11 |
6.92 |
|
50–60 |
45 |
42.68 |
0.73 |
3.13 |
7.33 |
|
60–70 |
44 |
46.51 |
0.84 |
2.05 |
4.41 |
|
70–80 |
11 |
38.63 |
–1.14 |
2.17 |
5.61 |
|
80+ |
4 |
41.31 |
–1.34 |
2.19 |
5.31 |


