Evidence indicates that patients with Alzheimer’s dementia (AD) show signs of copper (Cu) dyshomeostasis. This study aimed at evaluating the potential of Cu dysregulation as an AD susceptibility factor. We performed a meta-analysis of 56 studies investigating Cu biomarkers in brain specimens (pooled total of 182 AD and 166 healthy controls, HC) and in serum/plasma (pooled total of 2929 AD and 3547 HC). We also completed a replication study of serum Cu biomarkers in 97 AD patients and 70 HC screened for rs732774 and rs1061472 ATP7B, the gene encoding for the Cu transporter ATPase7B. Our meta-analysis showed decreased Cu in AD brain specimens, increased Cu and nonbound ceruloplasmin (Non-Cp) Cu in serum/plasma samples, and unchanged ceruloplasmin. Serum/plasma Cu excess was associated with a three to fourfold increase in the risk of having AD. Our replication study confirmed meta-analysis results and showed that carriers of the ATP7B AG haplotype were significantly more frequent in the AD group. Overall, our study shows that AD patients fail to maintain a Cu metabolic balance and reveals the presence of a percentage of AD patients carrying ATP7B AG haplotype and presenting Non-Cp Cu excess, which suggest that a subset of AD subjects is prone to Cu imbalance. This AD subtype can be the target of precision medicine-based strategies tackling Cu dysregulation.
1. Introduction
Alzheimer’s dementia (AD) is a multifactorial condition for which a new disease-modifying therapy, aducanumab, has been recently approved by FDA, even though post-approval studies have been requested to demonstrate its clinical efficacy
[1][2][3]. Hallmarks of AD are extracellular deposits of the beta-amyloid protein (Aβ), intraneuronal aggregates of the Tau protein, and reactive gliosis
[4][5]. Many modifiable risk factors contribute to shaping the disease onset and progression
[6]. In their analysis of primary prevention of AD, Norton et al. 2014
[6], extending studies from Barnes and Yaffe 2011
[7], excluded some potential modifiable risk factors from their estimation of a population-attributable risk (PAR) based on relative risks from existing meta-analyses and prevalence of these risk factors
[1]. PAR for dietary factors and metal imbalance has been in fact impeded since data regarding population prevalence of abnormal values were missing in the literature. Unfortunately, this initial gap contributed to hampering the full exploration of the hypothesis that metals might be modifiable risk factors for AD. Almost a decade ago, a novel metal hypothesis
[8] and several meta-analysis studies (reviewed in
[9]) had triggered a new interest in the pathogenic interaction between metals, mainly iron (Fe), copper (Cu), and zinc (Zn), and a set of AD-related proteins (primarily belonging to the Amyloid beta-Precursor Protein (AβPP)/Aβ system). Cu is an essential micronutrient, the catalyst or component of many metalloproteins or enzymes that help to control cellular life and energy production in a variety of biological systems. Nonbound ceruloplasmin (Non-Cp) Cu (also known as ‘free copper’) is the fraction of Cu in serum/plasma that does not bind to ceruloplasmin, the main protein that carries Cu in the blood (reviewed in
[9]). The expansion of the blood pool of Non-Cp Cu is toxic as, in this form, the metal can cross the blood–brain barrier (BBB), accumulate as “labile Cu” in the brain
[10], and participate in a variety of harmful and cell-damaging activities
[9], as exemplified by Wilson’s disease (WD), a rare autosomal recessive disorder caused by mutations of
ATP7B, the gene encoding for ATPase7B, a Cu pump located in hepatocytes, and endothelial cells of the BBB. Normally, Cu acts beneficially as a catalyst and critical component of metalloproteins and enzymes essential for cellular and brain functioning, such as the systemically important antioxidant Cu/Zn-Superoxide dismutase (SOD1), and cytochrome C oxidase, which produces neuron energy in the mitochondria. However, when not properly bound, Cu undergoes redox cycling reactions with O
2, resulting in the catalytic production of reactive oxygen species (ROS) of which H
2O
2 can diffuse through cell membrane and then produce the very reactive hydroxyl radical (HO•), catalyzed by Cu (Fenton-type reactions)
[11]. In the past decade, many studies have uncovered a link between AD pathogenesis and Cu dysmetabolism (reviewed in
[12]): AβPP/Aβ are Cu binding proteins with a potential role as natural Cu buffering proteins, and Cu
2+ binding dramatically changes Aβ aggregation propensity, structure, and toxicity
[13], with a plethora of effects spanning from reducing energy production in mitochondria to altering synaptic function and cognitive deterioration (reviewed in
[12]), as revealed by preclinical models of chronic Cu exposure
[14][15][16][17]. Furthermore, mutations in the genes involved in Aβ buildup and processing (AβPP, PSEN1/PSEN2) have been reported to disturb the metal-buffering AβPP/Aβ system
[12]. The ATPase7B pump loads Cu onto nascent ceruloplasmin in hepatocytes and onto the glycophosphatidyl inositol ceruloplasmin in astrocytes (reviewed in
[12]). Defects in these processes lead to increased release of Non-Cp Cu in the blood and activate cell-damaging events related to AD (reviewed in
[12]).
Meta-analysis on Cu in brain specimens
[18] and serum samples
[19] as well as on serum Non-Cp Cu
[20] and ceruloplasmin
[21] have been published, but they appear a little dated. Furthermore, despite this vast literature, the scientific community has not yet reached consensus on the role played by Cu in AD. Indeed, the topic and the clinical significance of Cu in AD are still considered controversial, probably as many studies on brain specimens have reported decreased Cu values in AD, while those on circulating Cu reported increased values, allowing contrasting interpretations. To help clarify the evidence, we aimed at summarizing the available case-control studies produced on brain and on circulating Cu in AD in a comprehensive meta-analysis to determine the associations of a panel of Cu biomarkers with the disease.
We also performed a replication study intended at evaluating levels of serum Cu, Non-Cp Cu, ceruloplasmin concentrations, ceruloplasmin activity, ceruloplasmin specific activity (iCp/eCp), and the Cu to ceruloplasmin ratio (Cu:Cp) in a sample of 97 AD patients and 70 healthy controls (HC). Individuals were screened for the two functional single nucleotide polymorphisms (SNPs) rs1061472 and rs732774 of
ATP7B [11], associated with an increased risk for AD
[22]. The role played by these SNPs was reported in a recent study
[23]. The SNP amino-acid substitutions K832R and R952K modulate the ATPase7B properties in vitro and alter serum Cu status
in vivo. rs1061472 and rs732774
ATP7B SNPs primarily affect the ATPase7B abundance and reduce its trafficking in response to elevated Cu
[23].
2.Copper Imbalance in Alzheimer’s Disease: Meta-Analysis of Serum, Plasma, and Brain Specimens, and Replication Study Evaluating ATP7B Gene Variants
2.1. Meta-Analysis
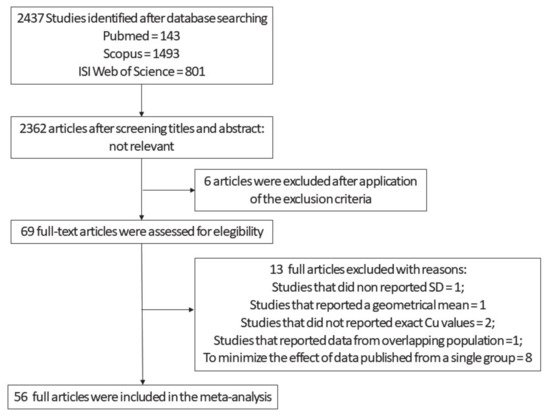
Our first selection produced an output of 2437 studies (
Figure 1). After screening titles and abstracts and the exclusion of the non-relevant studies, 75 articles remained. Out of this pool, we ran an additional screening and looked for manuscripts that reported Cu values, expressed as means and SD, obtained from AD and HC subjects. Sixty-nine full-text articles were assessed for eligibility. We excluded from the original 69 one study that did not report SD
[24], one that reported a geometrical mean
[25], and two that did not report the absolute value of Cu levels
[10][26]. We also excluded the study by Alimonti et al.
[27] because the data partially overlapped with some shown in a paper by Bocca and colleagues
[28]. To minimize the potential bias produced by data published from a single group, we included only a limited number of studies from ‘Fatebenefratelli research group’. Out of the 13 studies from the group, we chose five
[29][30][31][32][33] since these (i) employed different methods for the analysis of Cu, ceruloplasmin, and Non-Cp Cu; (ii) employed samples from populations living in different geographical areas of the country (Italy); and (iii) were performed by three independent laboratories. On the remaining 56 studies (
Figure 1,
Tables S1–S3, Supplementary Material), we carried out both study-wise and group-wise analyses. Finally, as an additional control, a supplementary analysis was performed in which all the studies produced by the Fatebenefratelli research group were pooled together and considered as a single study (
Figure S1, Supplementary Material). The evaluation of the quality of the studies was assessed by the Newcastle–Ottawa Scale. The maximum number of stars was eight. The average score was equal to 5. Since there is not yet a standard cut-off, we applied arbitrary cut-off: 0–4 poor quality, 5–6 fair quality, and ≥7 high quality. On this basis, 20.5% of the studies had a high quality, 47.7% fair, and 31.8% poor.
Figure 1. Flow diagram employed from the screening and selection of the analyzed Cu studies .
2.1.1. Meta-Analysis of Cu Data from Brain Tissues
Eighteen studies were identified in the primary screening; after the application of the exclusion criteria described above, six were excluded
[34][35][36][37][38][39]. Clinical data, demographic information limited to age, sex, ethnicity, and cerebral area of the metal measurements were obtained from 182 AD and 166 HC subjects. Cu concentrations in AD and HC subjects were analyzed and regionally stratified to investigate changes in the hippocampus (five studies), amygdala (two studies), the whole cortex (four studies), the frontal cortex (five studies), and the cerebellum (one study)
[40] (
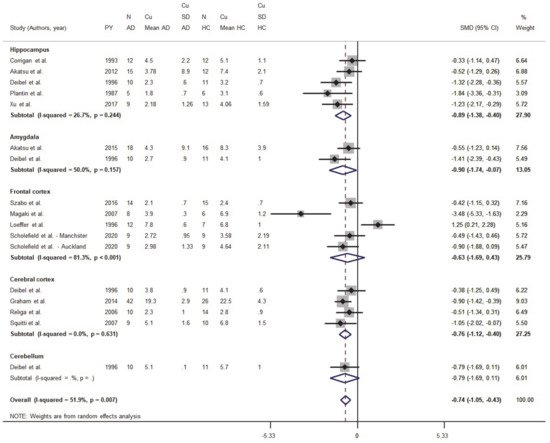
Figure 2). The standardized mean difference (SMD) differed and was equal to −0.74 (95% CI −1.05, −0.43;
p < 0.001), thereby indicating that Cu levels were depleted in most regions of the brain in the AD group (
Figure 2).
Figure 2. Standardized mean difference (SMD) computed from the studies on Cu brain levels (μg/g) in AD patients and HC subjects. SMDs between patients and controls are represented by squares, whose sizes are proportional to the sample size of the relative study. The whiskers represent the 95% confidence interval (CI). The diamond represents the pooled estimate based on the random-effects model, with the center representing the point estimate and the width indicating the associated 95% CI.
We also analyzed data from five studies focused on the hippocampus from a pool of 51 AD and 54 HC subjects. These studies reported normal or lower Cu levels in AD patients when compared to HC. The pooled SMD was = −0.89 (95% CI −1.38, −0.399; p < 0.001), while the heterogeneity was I2 = 26.7% (p = 0.244).
The amygdala was considered only in two studies for a total of 28 AD and 27 HC subjects . One study reported lower Cu concentrations in AD patients when compared to HC
[40]; in this group, the pooled SMD was equal to −0.90 (95% CI −1.74, −0.07;
p = 0.033). The heterogeneity was moderate (I
2 = 50%,
p = 0.157).
Five studies reported data collected from the frontal cortex of 52 AD and 46 HC subjects. While a study by Magaki and colleagues
[41] reported lower Cu levels in AD brains, a paper by Loeffler and colleagues indicated Cu increases in brain samples from AD patients
[42]. However, when the authors normalized Cu concentrations to the tissue protein content, Cu levels resulted lower in AD when compared to HC subjects. In this subset, the pooled SMD was = −0.63 (95% CI −1.69, 0.43;
p = 0.245) and an elevate heterogeneity was observed (I
2 = 81.3%,
p < 0.001).
Data on the whole cerebral cortex were obtained from four studies. All these studies reported lower Cu levels in AD patients when compared to HC subjects. However, the difference was evident only in two studies
[43][44] with a pooled SMD equal to −0.76 (95% CI −1.12, −0.40;
p < 0.001) and a heterogeneity I
2 = 0% (
p = 0.631).
2.1.2. Meta-Analysis of Cu in Serum/Plasma
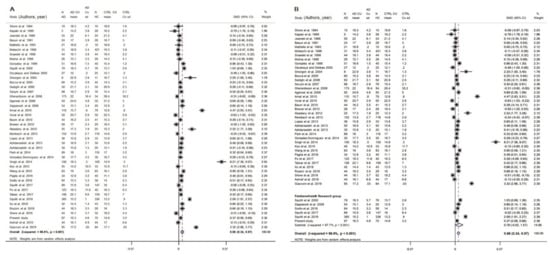
Thirty-five studies on serum Cu and an additional nine studies on plasma were selected (Figure 3 and Tables S1–S3, Supplementary Material).
Figure 3. Standardized mean difference (SMD) computed from the studies on Cu serum/plasma levels (μmol/L) in AD patients and HC subjects. SMDs between patients and controls are represented by squares, whose sizes are proportional to the sample size of the relative study. The whiskers represent the 95% confidence interval (CI). The diamond represents the pooled estimate based on the random-effects model, with the center representing the point estimate and the width indicating the associated 95% CI. In panel (A) is the study-wise analysis; in panel (B) is the group-wise analysis. Abbreviations: PY, publication year; N, number; SD, standard deviation; HC, healthy controls.
The analysis was performed initially considering studies on serum and plasma separately.
The results on serum samples showed significantly higher Cu values in AD patients than in HC (SMD = 0.54; 95% CI 0.23, 0.85;
p = 0.001) and a high heterogeneity (I2 = 95.8%;
p < 0.001). In fact, 17 studies reported higher value in AD patients than in HC
[29][31][32][33][45][46][47][48][49][50][51][52][53][54][55][56] and two studies showed lower Cu values in AD than in HC
[57][58], while the remaining studies reported no significant results.
The results on plasma samples showed no significant difference (SMD = 1.11; 95% CI−0.06, 2.27;
p = 0.062) and a high heterogeneity (I
2 = 98.2%;
p < 0.001). In fact, three studies reported no significant results
[59][60][61]. One study reported higher Cu values in AD patients than in HC
[62][63][64][65] and two showed lower Cu values in AD than in HC
[66][67].
We then carried out a comprehensive meta-analysis including both serum and plasma samples. Data came from 2929 AD patients and 3547 healthy controls (46 studies). Patient samples ranged from 5 to 385 individuals. The mean age of the participants was >70 years, except for a few studies that investigated younger subjects (Table S1, Supplementary Material). The percentage of women in the AD group ranged from 20% to 100%. The analyzed population was Caucasian in 20 studies, Asian in 17, and Argentinean in 1 study. Both study-wise and group-wise analyses showed higher serum/plasma Cu levels in AD patients when compared to HC subjects (SMD = 0.66, 95% CI 0.34, 0.97, p < 0.001; Figure 3). A supplementary analysis in which all studies carried out by ‘Fatebenefratelli research’ group were pooled together and taken into account as a single study, confirmed higher serum/plasma Cu levels in AD patients when compared to HC subjects (SMD = 0.64, 95% CI 0.31, 0.93, p < 0.001; Figure S1, Supplementary Material). Heterogeneity was high (I2 = 95.9%; p < 0.001).
The funnel plot (Figure S2, Supplementary Material) appeared asymmetrical, but asymmetry was not relevant (Egger test: beta = 1.30, SE = 2.21;
p = 0.560). The meta-regression revealed that the difference in the mean age between AD and HC subjects did not affect the analysis (beta = −0.01, SE = 0.019;
p = 0.714). The difference of the SMD for Cu in serum/plasma was 0.66 and therefore the formula,
2.1.3. Meta-Analysis of Non-Cp Cu
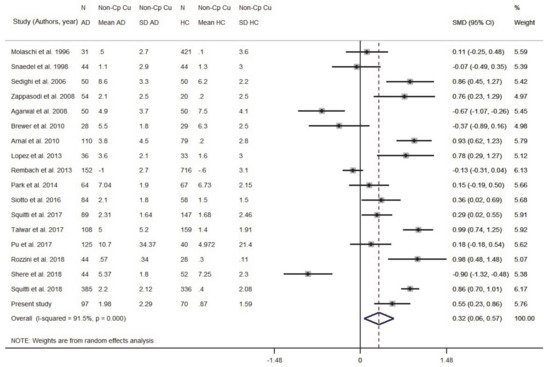
Eighteen studies were taken into consideration (Figure S4 and Table S3, Supplementary Material). Data originated from 1595 AD and 2399 HC subjects. The patient sample size ranged from 28 to 385 individuals; the control sample size ranged from 20 to 716 (Table S3, Supplementary Material). Results indicated that AD subjects had higher levels of Non-Cp Cu compared to HC subjects (SMD = 0.32, 95% CI 0.06, 0.57, p = 0.014; Figure 4). There was a high heterogeneity among the included studies (I2 = 91.5%; p < 0.001). To check for possible publication bias, we performed a funnel plot (Table S5, Supplementary Material) which revealed no evidence of asymmetry, as confirmed by the Egger test (b = −1.98, SE = 2.19; p = 0.380).
Figure 4. Standardized mean difference (SMD) computed from the studies on Non-Cp Cu(µmol/L) in AD patients and HC subjects. SMDs between AD subjects and controls are represented by squares, whose sizes are proportional to the sample size of the relative study. The whiskers represent the 95% confidence interval (CI). The diamond represents the pooled estimate based on the random-effects model, with the center representing the point estimate and the width indicating the associated 95% CI. Abbreviations: PY, publication year; N, number; SD, standard deviation; HC, healthy controls.
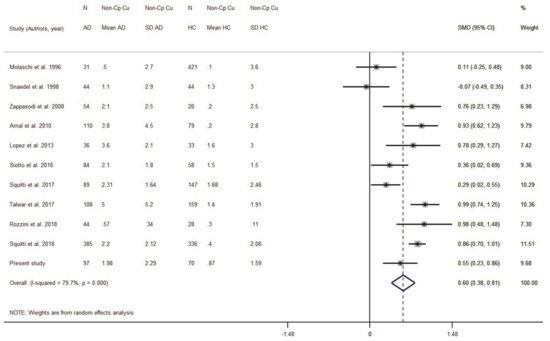
We ran a sensitivity analysis taking into account the Cu:Cp ratio as a Cu index for internal quality control to verify the ceruloplasmin calibration. The ratio provides information about the actual stoichiometry between Cu and ceruloplasmin in the specimens. As we discussed elsewhere
[20], a 6–8 Cu:Cp range in HC individuals allows us to obtain more reliable Non-Cp Cu values when applying the Walshe’s formula
[20][68]. On this basis, seven studies reporting in HC subjects a Cu:Cp ratio lower than 6 and higher than 8 were excluded from the meta-analysis (
Figure 5). By excluding these seven studies, the pooled AD sample was included 1082 subjects and the pooled HC sample 1289 subjects. The result was SMD = 0.59 (95% CI 0.38, 0.81;
p < 0.001) and the heterogeneity I
2 = 79.7% (
p < 0.001).
Figure 5. Standardized mean difference (SMD) computed from the studies on Non-Cp Cu(µmol/L) in AD patients and HC subjects when considering studies with a Cu:Cp ratio lower than 6 and higher than 8. SMDs between AD subjects and controls are represented by squares, whose sizes are proportional to the sample size of the relative study. The whiskers represent the 95% confidence interval (CI). The diamond represents the pooled estimate based on the random-effects model, with the center representing the point estimate and the width indicating the associated 95% CI. Abbreviations: PY, publication year; N, number; SD, standard deviation; HC, healthy controls.
The meta-regression revealed that the difference in the mean age between AD patients and HC did not affect the analysis (beta = 0.34, SE = 0.19; p = 0.095). The difference of the SMD for Non-Cp Cu in serum/plasma was 0.32, which delivered OR = 1.79 when applying Formula (1), indicating that for a µmol/L unit increase in Non-Cp Cu, there was a twofold increase in odds of having AD compared to HC. Considering the results of the sensitivity analysis, SMD = 0.59 gave OR = 2.91 (95% CI 1.99, −4.35; p < 0.001), indicating that for a µmol/L unit increase in Non-Cp Cu, there was a threefold increase in odds of having AD compared to HC.
2.1.4. Meta-Analysis of Ceruloplasmin in Serum/Plasma
Seventeen studies were included in the meta-analysis (Table S3, Supplementary Material). Data were from 1551 AD patients and 2371 HC. There was no difference in ceruloplasmin levels between AD patients and healthy controls (SMD = 0.04, 95% CI −0.11, 0.19 (p = 0.589); Figure S4 Supplementary, Materials). A high heterogeneity among the included studies was revealed (I2 = 75.3%, p < 0.001). No publication bias was observed (beta = 0.48, SE = 1.34; p = 0.727; Figure S5, Supplementary Material). The meta-regression did not show a relevant effect of the difference in the mean age between AD patients and HC subjects (beta = 0.088, SE = 0.12; p = 0.487).
3.2. Replication Study of Changes in Serum Cu Biomarkers in AD and HC Subjects
A total of 167 participants were recruited for this study (97 AD and 70 HC; Table 2). While ceruloplasmin did not correlate with age, a slightly positive association between age and specific activity of ceruloplasmin (r = 0.244; p = 0.002), Non-Cp Cu (r = 0.311; p < 0.001) and Cu:Cp ratio (r = 0.28; p < 0.001) was observed (Table 2).
Table 2. Demographics and biological variables of participants to the replication study investigating variations of Cu markers in the serum of AD subjects and healthy controls.
| Alzheimer’s Dementia |
Healthy Controls |
Statistics |
p-Value |
|
| N = 97 |
N = 70 |
| Demographic variables |
|
|
|
|
|
|
| Sex, M |
% (n/subjects) |
37.1% (36/97) |
22.9% (16/70) |
|
0.05 |
|
| Age |
mean (SD) |
71.1 (7.18) |
65.9 (7.53) |
|
0.01 |
|
| MMSE |
median (Q1-Q3) |
19 (15–23) |
29 (27.3–30) |
|
<0.001 * |
|
| Biological variables |
|
|
|
|
|
|
| Cu (µmol/L) |
mean (SD) |
15.8 (3.76) |
14.6 (2.95) |
F(1, 163) = 6.69 # |
0.011 |
|
| Ceruloplasmin (mg/dL) |
mean (SD) |
29.3 (4.89) |
29.2 (4.08) |
F(1, 163) = 1.13 # |
0.289 |
|
| Non-ceruloplasmin Cu *,&,† (µmol/L) |
median(Q1-Q3) |
1.4 (0.6–2.8) |
0.75 (−0.16–1.71) |
F(1, 163) = 9.88 # |
0.002 |
|
| Ceruloplasmin activity (IU) |
mean (SD) |
117.9 (26.13) |
110.4 (18.06) |
F(1, 163) = 10.21 # |
0.008 |
|
| eCp:iCp ratio |
mean (SD) |
4.0 (0.51) |
3.8 (0.44) |
F(1, 163) = 7.02 # |
0.009 |
|
| Cu:Cp ratio |
mean (SD) |
7.1 (0.74) |
6.6 (0.93) |
F(1, 163) = 10.21 # |
0.002 |
# All analyses were adjusted for sex and age; * non-parametric Mann–Whitney test; & logarithmic transformation was applied as described in method section; † mean (SD) value of Non-Cp Cu in AD patients was 2 (2.29) µmol/L and that in HC was 0.9 (1.59) µmol/L [F(1, 163) = 11.23, p = 0.001].
The two study groups were no different for sex distribution, even though men were prominent in the AD group (HC men: 22.9% (16/70) vs. AD men: 37.1% (36/97); Chi square = 3.85, df (1)
p = 0.050), and Cu, ceruloplasmin levels and activity were found to be different between men and women. To correct for this potential bias, all the analyses were corrected for sex and age. In HC subjects, the correlation between ceruloplasmin concentrations and serum Cu levels was 0.86 (
p < 0.001), the correlation between ceruloplasmin concentrations and ceruloplasmin activity values was 0.75 (
p < 0.001), the correlation between ceruloplasmin activity and serum Cu levels was 0.77 (
p < 0.001), and between Non-Cp Cu and the Cu:Cp ratio was 0.97 (
p < 0.001). The Cu:Cp ratio in HC was 6.6 (0.81), thereby demonstrating a good agreement between Cu and ceruloplasmin, allowing the application of Walshe’s formula
[68]. Among the variables under study, total serum Cu, Non-Cp Cu, and the Cu:Cp ratio were higher in AD patients (
Table 2), and 44% of AD patients had values of Non-Cp Cu higher than 1.6 µmol/L (upper limit of normal)
[68][69][70].
The genetic study analyzed the allele, genotype, and haplotype distribution of ATP7B rs732774 and rs1061472 in association with the main demographic and clinical characteristics of 91 AD patients and 69 HC (genotype data from six AD patients and one HC were not available). A difference between AD patients and HC was found when analyzing genotype frequencies for rs732774 (adjusted p-values = 0.032). As for allele carrier frequencies (AA + AG), carriers of at least one A allele were more frequent in the AD group compared to HC (92% vs.78%; adjusted p-values = 0.011, OR = 3.33, 95% CI 1.28, 8.70).
As for rs1061472, no differences emerged between the two study groups (adjusted p-values = 0.097), while carriers of at least one G allele (GG + GA) were more frequent in the patient group (89% vs. 75%; adjusted p-values = 0.031, OR = 2.65, 95% CI 1.13, 6.21).
Finally, we built the haplotypes of the two polymorphisms and observed that cluster genotype frequencies were different between AD and HC (adjusted p-values = 0.022); in particular, AG haplotype carriers were more frequent in the AD group (89% vs. 75%; adjusted p-values = 0.012, OR = 3.30, 95% CI 1.26, 8.69).
A univariable binary logistic regression model was applied to evaluate the effect of biochemical variables on the probability of having AD. The model also took into consideration AG haplotype, age, and sex. A multivariable analysis was performed that included the biochemical variables with a p-value < 0.10 at the univariable analysis. The model revealed an effect of Non-Cp Cu on the probability of having AD with an increased risk of 1.32 times (95% CI 1.06, 1.64; p = 0.012) for each µmol/L unit increase in Non-Cp Cu when keeping all other independent variables constant. In the multivariable model, the effect of the AG haplotype on the probability of having AD was less consistent (95% CI 0.99, 6.28; p = 0.053) with respect to the result obtained in the univariable model (OR = 2.7 95% CI 1.13, 6.23, p = 0.026), with a probability of having AD that was about 2.49 times higher in the individual carriers of the AG haplotype compared to the GA/GA haplotype carriers, likely due to the limited number (only 27) of individual carriers of the GA/GA haplotype).
 +1 credit