Your browser does not fully support modern features. Please upgrade for a smoother experience.
Subjects:
Optics
- serial blockface histology
- intrinsic optical contrast
- brain imaging
Over the last decades, technological advances in imaging assisted the scientific community in linking functions to structures inside the brain. Neuroimaging modalities such as magnetic resonance imaging (MRI), diffusion MRI (dMRI), functional MRI (fMRI), positron emission tomography (PET), and others have revolutionized our understanding of the brain. These tools were used to study, among other investigations, brain metabolism and neurodegenerative diseases [1,2]. Alongside these modalities, neurophotonics methods were developed to observe the brain with optical means, providing better spatial and temporal resolutions [3,4]. Light–tissue interaction mechanisms that can be used to study biological tissues include reflection, refraction, absorption, scattering, and some nonlinear optical effects such as two-photon excitation fluorescence (TPEF), second- and third-harmonic generation (SHG and THG, respectively), and Raman scattering [5].
Despite the ubiquitous use of MRI and PET imaging in neuroscience, these techniques are not well-suited when it comes to studying the brain structure at a micrometer scale. This finer imaging resolution requirement arises in multiple neuroscience research fields. For example, it has been hypothesized that some neurodegenerative diseases could be related in part to brain microvascular pathologies such as microvascular dementia, microvascular incidents, endothelial disfunction, or mild cognitive diseases [6,7,8,9]. To test these hypotheses, neuroscientists need an imaging tool that enables the mapping of the neuronal tissue at micrometer scale across the whole brain. In the field of neurophotonics, a tool that meets this increasing resolution requirement is serial blockface histology (SBH). This technology combines a tissue-slicing apparatus with an optical microscope. The brain is sequentially sliced to reveal new tissue layers that are imaged with the microscope. The process is repeated until the whole sample has been imaged. Then, through advanced registration methods, the thousands of image tiles acquired are assembled into a single 3-D volume. The first automated SBH systems used fluorescent confocal microscopy and TPEF microscopy (TPEFm) [10,11,12]. These tools were an essential component of many high-profile neuroscience projects to map genome-wide gene expression [13] and to obtain a micrometer scale connectome in a whole mouse brain [14,15]. Building on the success of SBH, other groups have coupled this technique with intrinsic optical contrast imaging modalities (ICI). The main rationale motivating this effort is a reduction in tissue preparation complexity that leads to an improvement in serial histology acquisition times.
This paper is a review of SBH using intrinsic optical contrast with applications of this technology to image whole brains in 3-D. The first section describes the various optical contrast mechanisms of brain tissues. Some imaging modalities discussed include Optical Coherence Tomography (OCT), polarization-sensitive OCT (PS-OCT), Raman scattering techniques (Raman microscopy, Coherent Anti-stokes Raman Spectroscopy (CARS), and Stimulated Raman Spectroscopy (SRS)), intrinsic fluorescence and multi-photon microscopy without labeling, Second- and Third-Harmonic Generation (SHG/THG), and photoacoustic imaging. The second section of this paper deals with SBH for whole brain imaging. This section presents the main components of an SBH setup, ranging from tissue slicing and acquisition automation to data processing and reconstruction. The paper then concludes with a review of the two main applications of ICI-SBH reported in the literature: validation studies and the creation of multimodal brain atlases.
2. Intrinsic Optical Contrast Imaging (ICI) of Brain Tissue
In this section, we review the distinct intrinsic optical contrast sources that can be exploited to image the brain. Representative brain images for each optical modality discussed in this section are illustrated in Figure 1. The light–tissue interactions presented are reflectivity and scattering, absorption, birefringence, nonlinear optical processes such as second- and third-harmonic generation, and Raman scattering. For comparison purposes, more details about the different imaging techniques are provided in Table 1.
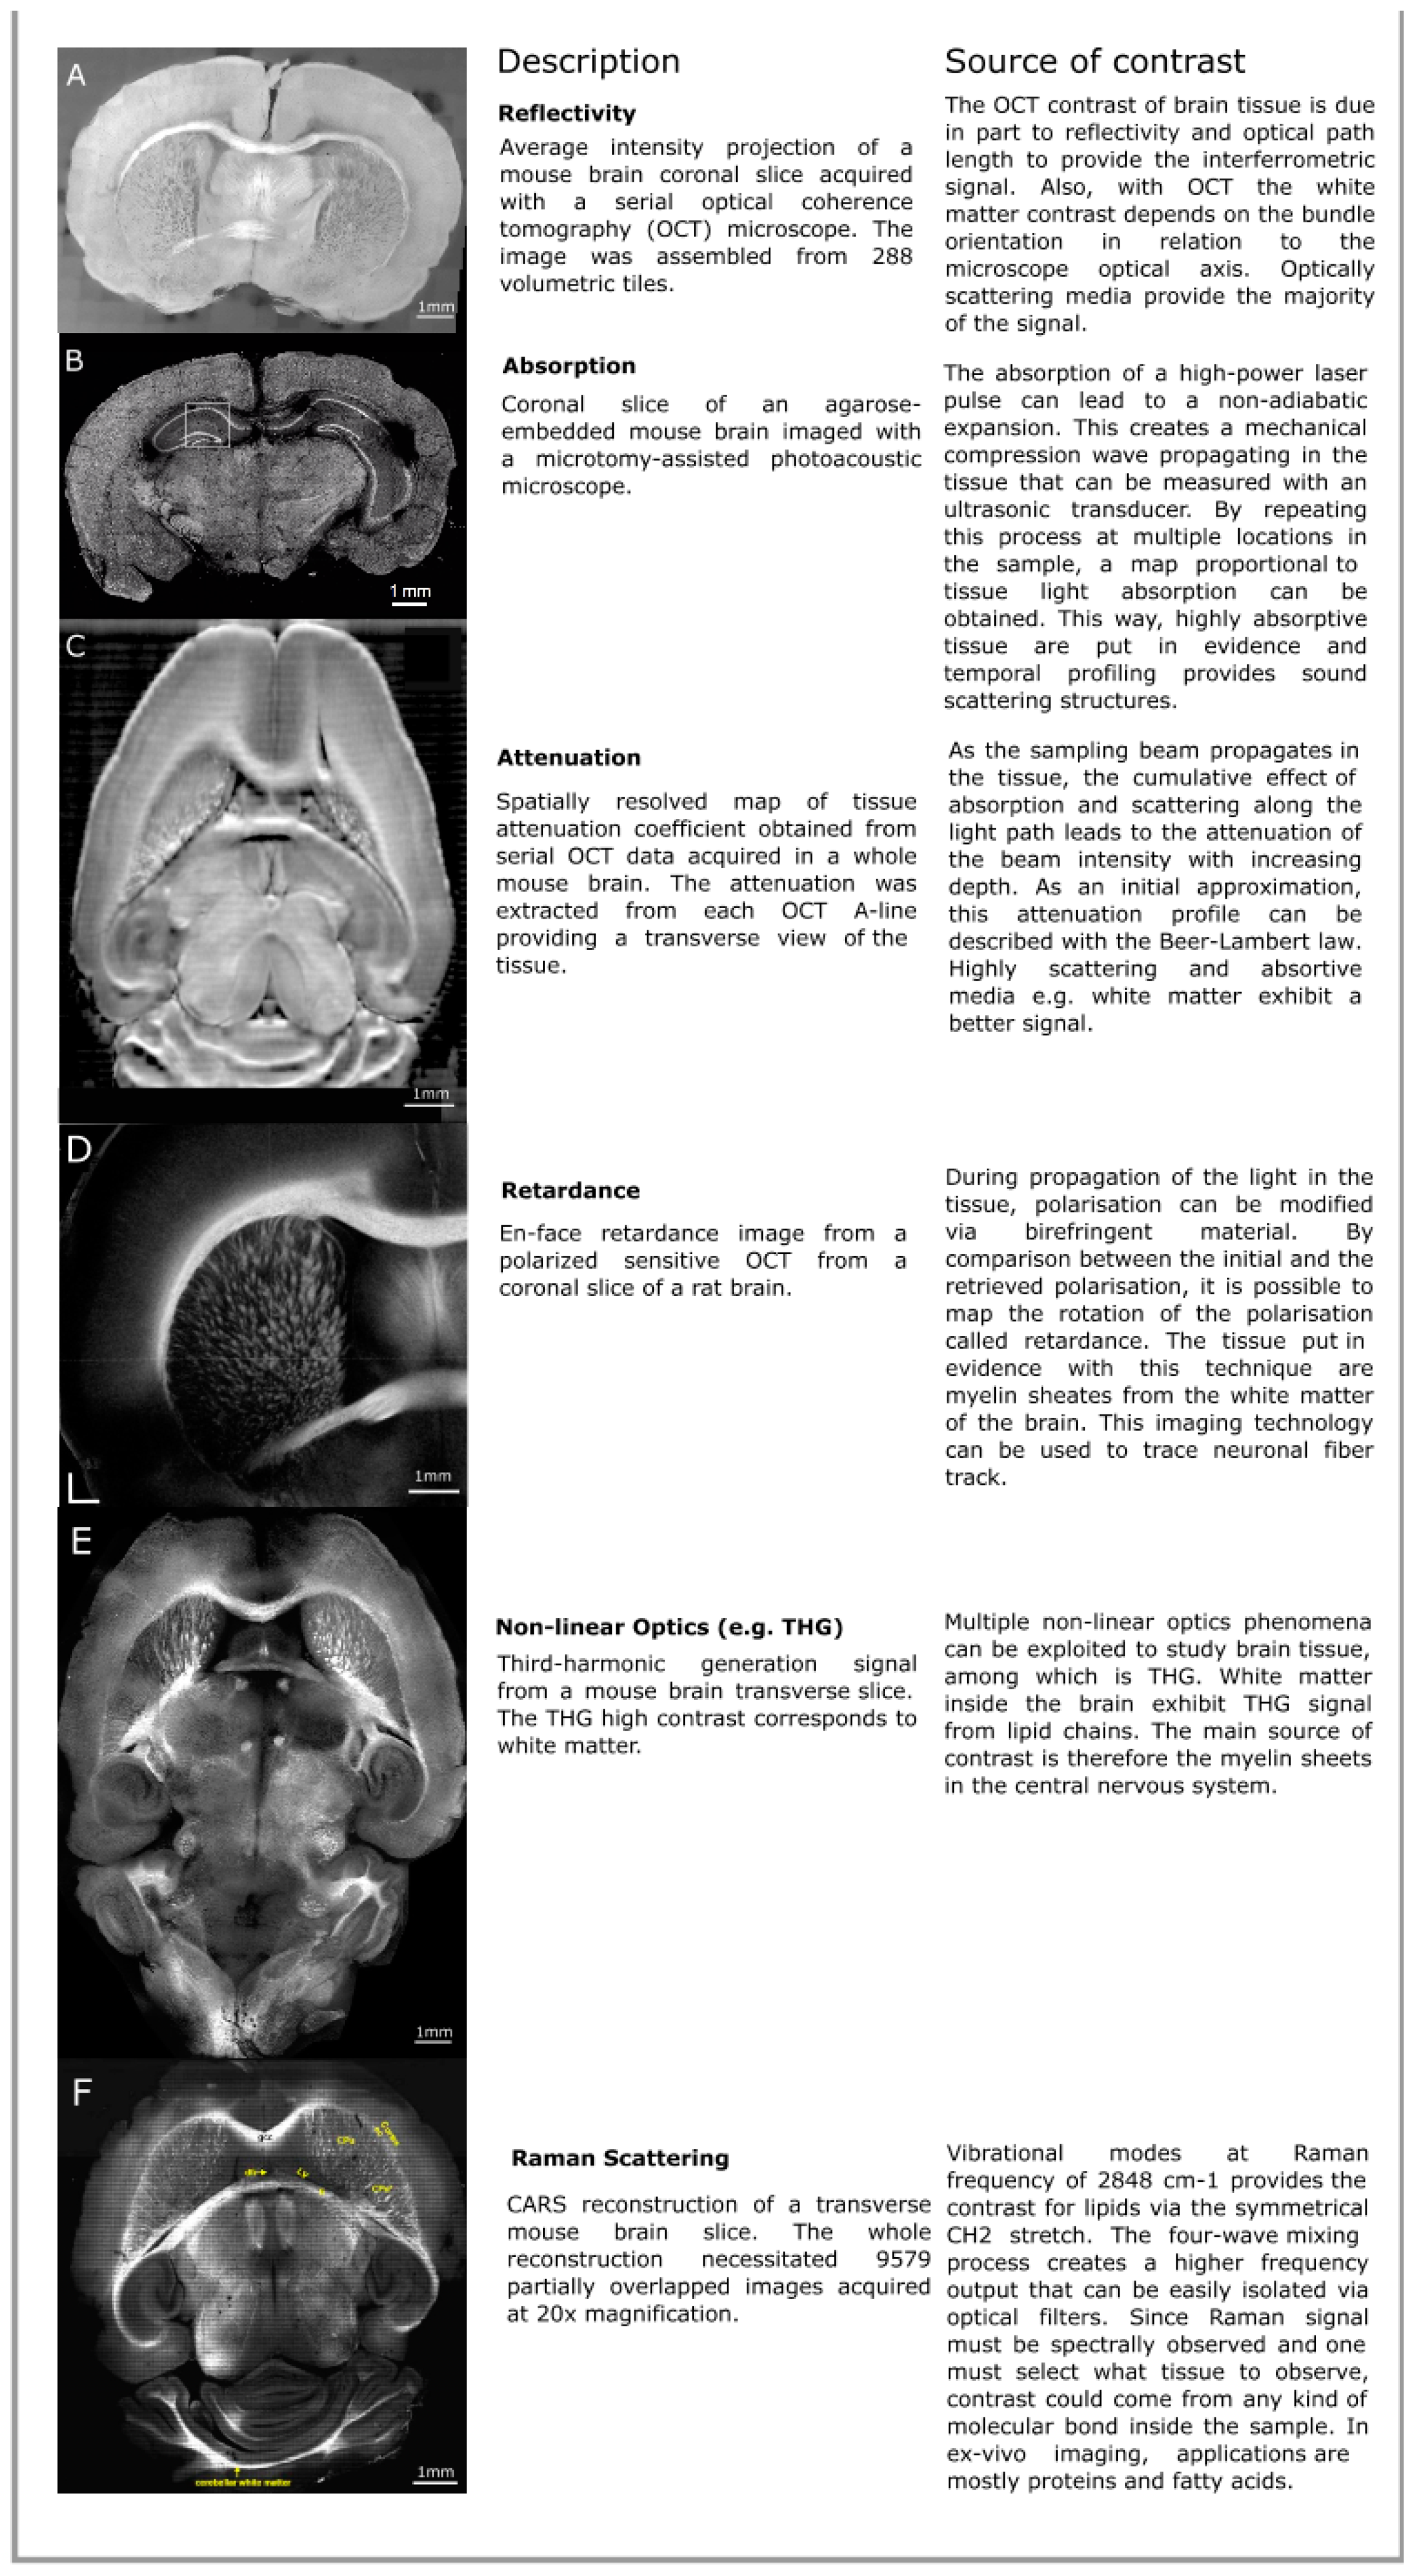
Figure 1. Examples of various intrinsic optical contrast mechanisms that can be used to image the brain: (A) Reflectivity, (B) absorption from photo-acoustics microscopy (PAM), (C) attenuation, (D) retardance from Optical Coherence Tomography (OCT) imaging, (E) nonlinear optics such as third-harmonic generation (THG), and (F) Raman scattering. The images for Figure 1A,C come from our previous work [16]. For more information about the images presented, consult the appropriate references. The absorption image is an excerpt from a still frame from the supplementary video 3 of Wong2017 [17], the THG image is a reproduction of Figure 3 from Farrar2011 [18], the retardance image comes from Wang2014 [19], and the Coherent Anti-stokes Raman Spectroscopy (CARS) image is taken from Fu2008 [20].
Table 1. A comparative table for different intrinsic contrast imaging (ICI) techniques: In the case of autofluorescence two-photon excitation fluorescence microscopy (TPEFm), the sensitivity of the signal is highly dependent on the effective cross section of the excitation from the targeted molecule. Moreover, the examples shown here are dependent on the resolution desired for the microscopic observation. In the case where slow modality was used, high magnification microscope objective tended to slow the speed of acquisition. This duality between resolution and speed is an important factor to consider, and in the optimization for applications such as ex-vivo microscopy, speed is often put aside for the benefit of resolution and vice versa for in vivo imaging. OCT: Optical Coherence Tomography, PS-OCT: Polarization-sensitive OCT, SDOCT: Spectral Domain OCT, PAM: Photoacoustic Microscopy, SHG: Second-harmonic generation, THG: Third-harmonic generation, SRS: Stimulated Raman Scattering, CARS: Coherence Anti-Stokes Raman Spectroscopy, IR: Infrared, NIR: Near Infrared.
| Imaging Technique | Sensitivity | Spatial Resolution (Voxel Size) | Speed | Wavelength |
|---|---|---|---|---|
| OCT/PS-OCT/SDOCT | 90 dB–110 dB [21] | 6 × 6 × 3.5 µm3 [19] 25 × 25 × 25 µm3 [16] |
Fast (4 cm3/h) [19] | NIR-IR |
| Autofluorescence TPEFm | Highly variable [22] | 1 × 1 × 2.5 µm3 [12] | Slow (190 mm3/h) [12] | NIR |
| PAM | ~65 dB [23] | 1.5 mm × 1.5 mm [24] | Fast (18 cm3/h) [24] | Visible-NIR |
| SHG/ THG | >20 dB [25] | 0.6 × 0.6 × 2 µm3 [26] | Slow (125 µm3/h) [26] | NIR-IR |
| SRS/CARS | >20 dB [27] | 0.3 × 0.3 × 1.5 µm3 [28] | Slow (4000 µm3/h) [28] | NIR-IR |