The total world production of milk from sheep and goats is constantly growing, and its main industrial use is for cheesemaking [1]. In some geographical areas, such as the Mediterranean Basin, although products are often differentiated in many local varieties, they are characterized by their high quality and are labelled with official designations, which identifies and enhances their specificity [2]. Quality of cheese is linked to characteristics of milk and to cheesemaking technologies. Cheese yield (CY%), which is calculated as the percentage of raw milk that is transformed into fresh curd, measures the efficiency of the cheesemaking process. The CY% is closely related to the concentration of fat and protein [3], and it is therefore predicted on the basis of fat and protein content. The current payment systems for sheep and goat milk in relation to quality must necessarily guarantee compliance with the minimum microbiological characteristics, but those also apply a bonus or a penalty to farmers according to the percentage of fat and protein [4]. Nevertheless, cheese yield and the final quality of the products cannot be solely attributable to the chemical composition of milk. In the past, several mathematical formulas have been developed for the prediction of those characters at the dairy industry level [5]. Although the use of those formulas represents a valid control tool for the dairy industry, laboratory methods can provide a useful and complete overview of the real coagulation process and the achievement of phenotypic data during many steps of the dairy chain.
Milk coagulation can be activated by many types of biochemical and physical processes. The most common coagulating agent at dairy plants is the rennet, which contains the chymosin enzyme. Chymosin starts the primary phase of milk coagulation, the proteolytic phase, breaking down the biochemical bond between the two amino acids phenylalanine and methionine, respectively, at positions 105 and 106 of the κ-casein protein chain. The event causes the destabilization of milk micellar structure. Later, during the secondary phase of coagulation, destabilized micelles precipitate and aggregate into a gel. The cutting of the gel into pieces, which is normally made during the cheesemaking processes, is the starting point of a phenomenon named syneresis, during which the network formed by the aggregated micelles facilitates whey expulsion and finally the formation of the fresh curd [6].
Several techniques have been proposed and used to investigate the phases of milk coagulation, both at industrial and laboratory level. The most common devices are classified as mechanical, which exploit the drag force exerted by the clot; vibrational, based on the use of probes that vibrate in different ways as a response to milk coagulation; and optical, which record the changes of properties, color, and absorbance of milk during the coagulation phases [7]. Among the mechanical devices, the Formagraph instrument (Foss Electric A/S, Hillerød, Denmark) is very common at research and dairy plant laboratories. The Formagraph produces a graphic representation of the coagulation phases (Figure 1) based on the signals transmitted by steel pendula immersed in milk samples mixed with a rennet solution. The pendula record the changes of milk from the liquid to the gel state and the increase of curd firmness and syneresis [8]. The Formagraph method is based on the analysis of a small quantity of milk, 10 mL, and the achievement of the so-called traditional milk coagulation properties (MCPs, Figure 1): The rennet coagulation time (RCT), the curd firming time, k20, and the curd firmness, a30.
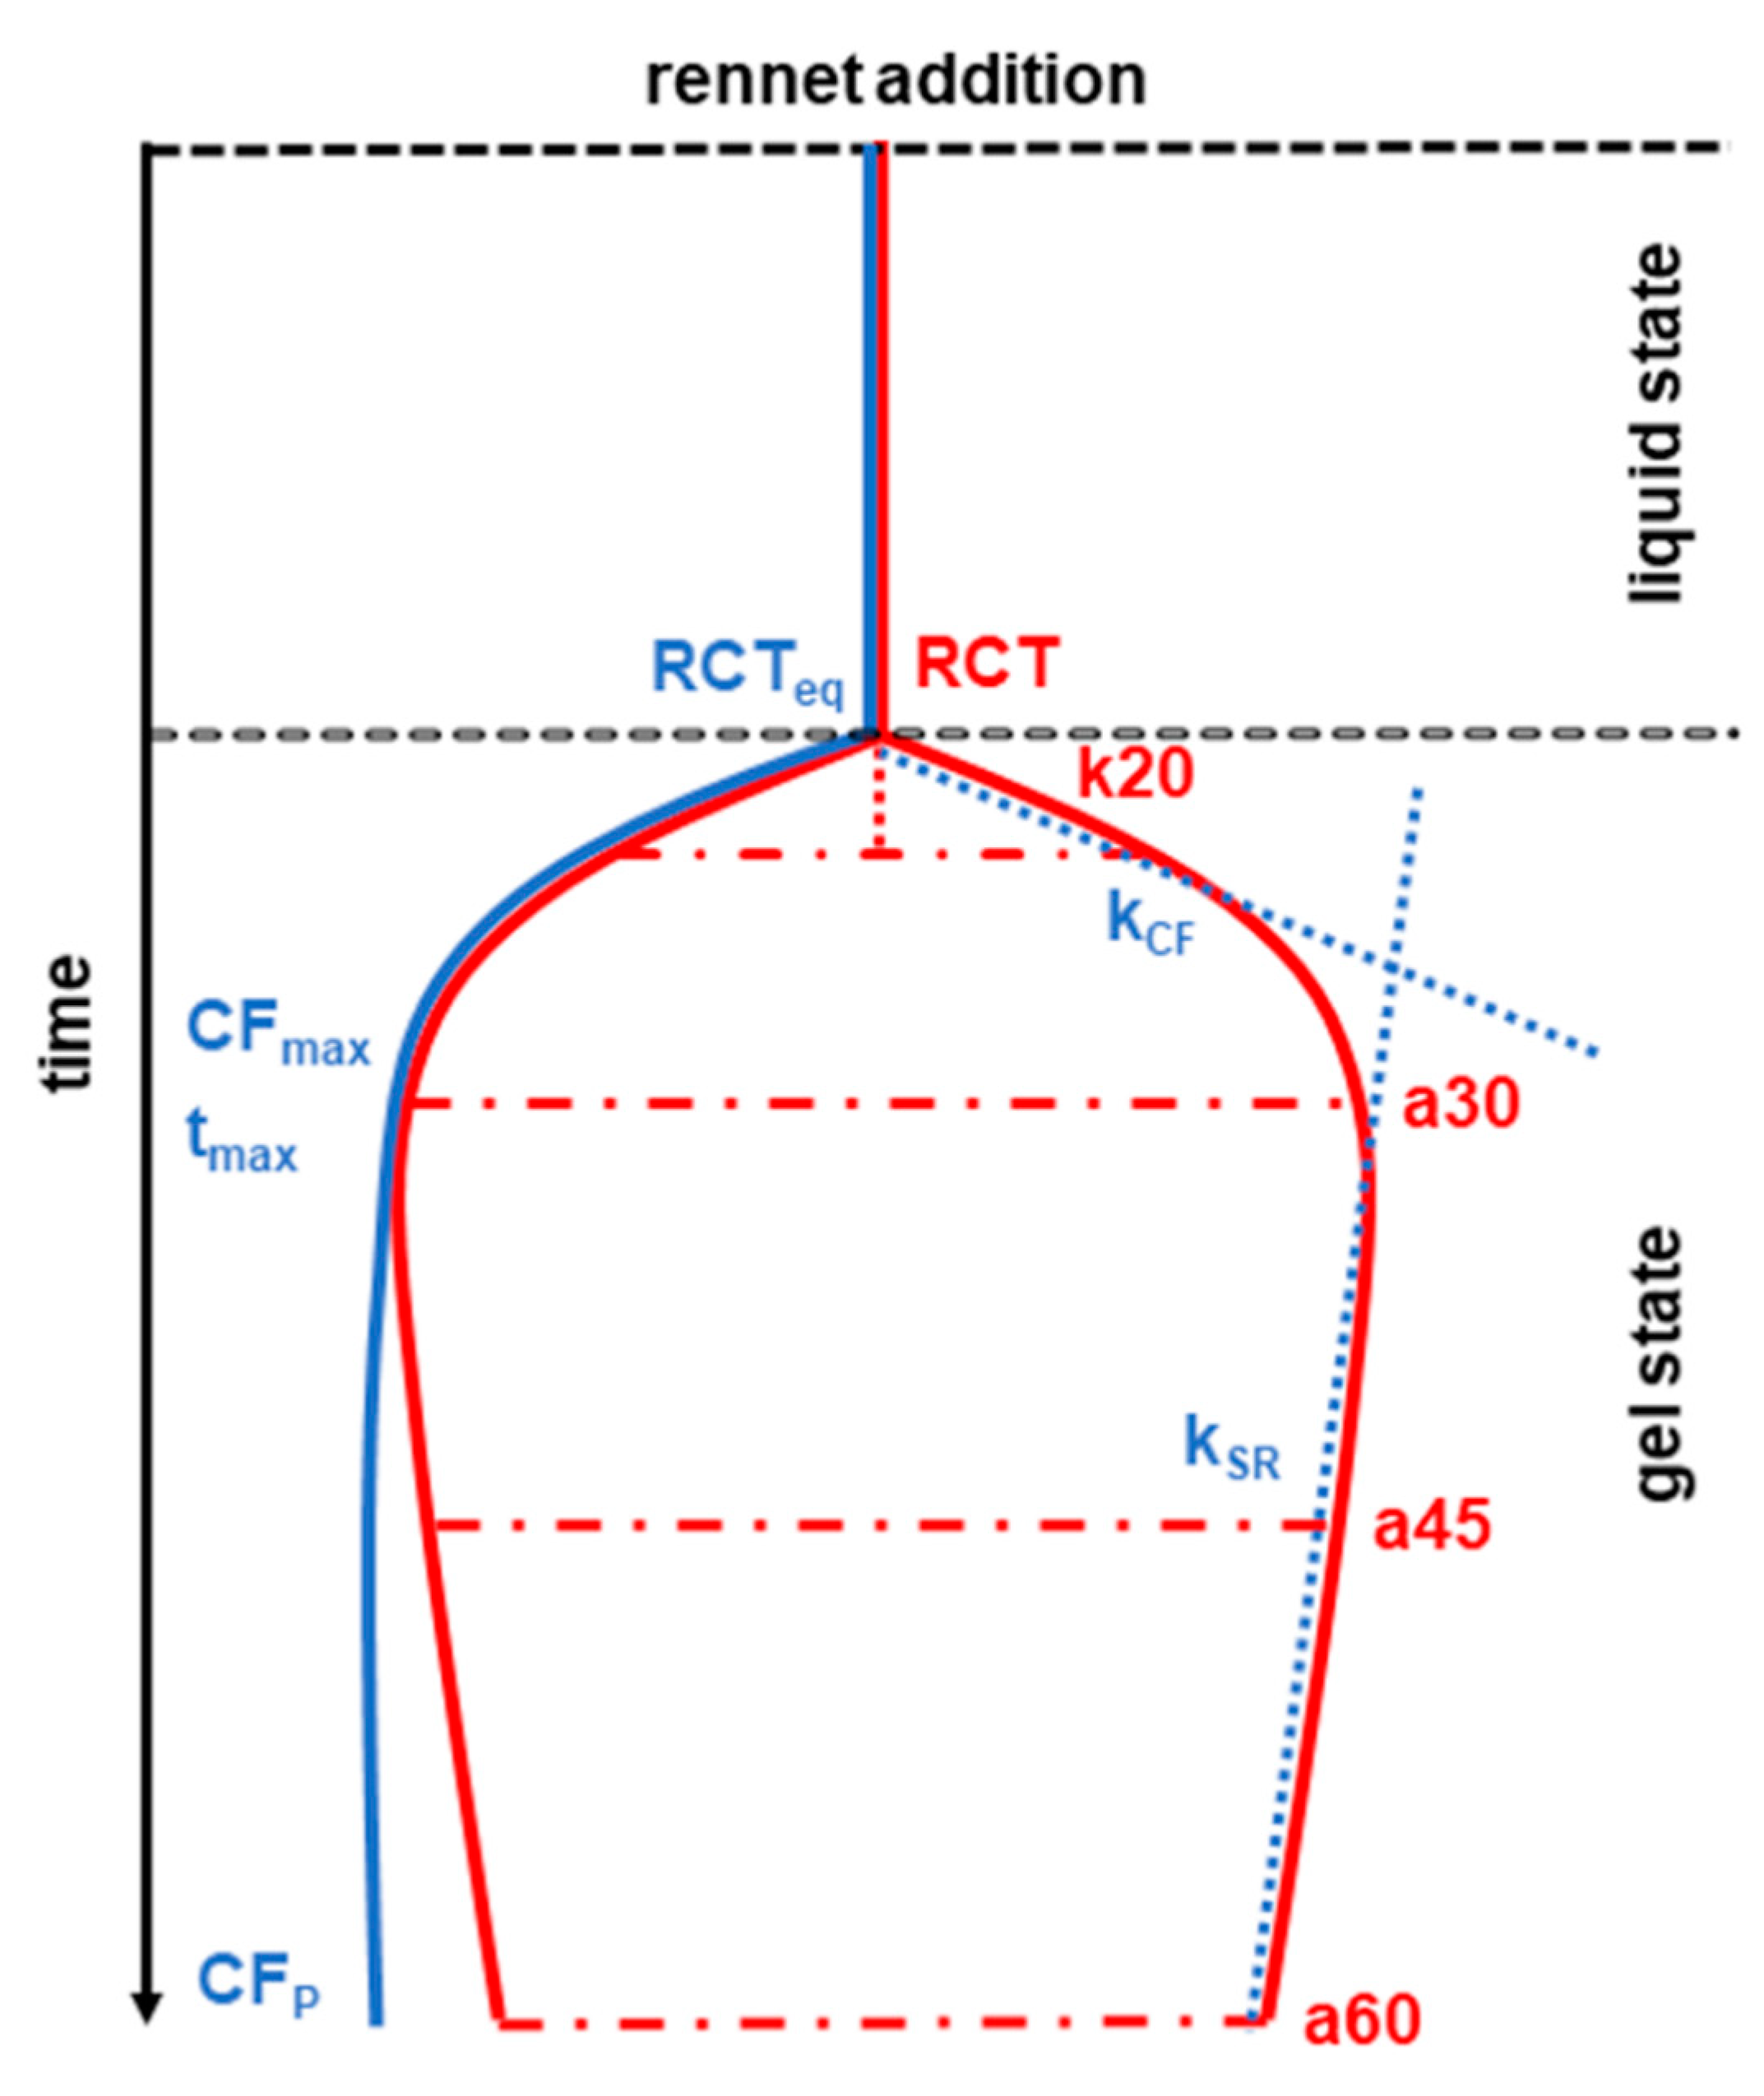
Figure 1. Graphic representation of milk coagulation traits based on the papers and illustrations by McMahon and Brown [8], Bittante [9], and Bittante et al. [10,11]. Traditional or single-point milk coagulation properties (MCPs) are reported in red: The rennet coagulation time (RCT) (measured in min) is i.e.,the interval between rennet addition and coagulation; k20, curd firming time (min), the interval between milk coagulation, and a width of 20 mm of the bell diagram; a30, a45, and a60, curd firmness (mm), the width of the bell diagram at 30, 45, and 60 min after rennet addition. Modeled curd firming over time (CFt) traits are in blue: Rennet coagulation time estimated by the CFt equation (min) (RCTeq); the maximum potential curd firmness after an infinite time (mm) (CFP); curd-firming rate constant (% × min−1) (kCF), the higher the value, the faster the curd firming; syneresis rate constant (% × min−1) (kSR), the higher the value, the stronger the syneresis force; maximum curd firmness (mm) (CFmax); time to attain CFmax (min) (tmax).
The Formagraph method has some weaknesses [9,12]. It provides static phenotypes, which have been called "single-point" traits because those are recorded in a single moment and therefore do not provide the complete description of the coagulation process. In addition, traditional MCPs often show low repeatability, and many samples, for which no coagulation is recorded within the time period of 30 min, are labelled as “non-coagulating” (NC). Another negative aspect of the Formagraph, and in general of all the mechanical devices, is the loss of time, because 30 min are necessary for the recording of the MCPs from 10 milk samples.
Bittante [9] and Bittante et al. [10] proposed an extension of the Formagraph analysis up to 60 min and the elaboration of statistical models to examine the complete dataset extrapolated from the traditional Formagraph layout. Indeed, the instrument records the firmness of milk samples every 15 s for a total of 240 observations during 60 min, which are used to calculate the so-called traits of curd firmness over time (CFt) (Figure 1). The CFt equation provides the estimated rennet coagulation time (RCTeq), the maximum potential curd firmness after an infinite time (CFP), the curd-firming rate constant (kCF), the syneresis rate constant (kSR), the maximum curd firmness (CFmax), and the time to attain the maximum curd firmness (tmax). Despite CFt traits are not directly achievable from the Formagraph instrument, those can provide more dynamic data on the coagulation and syneresis processes and complete the information from the traditional MCP.
In order to improve the routinely measurement of MCP and CFt traits, numerous studies investigated the possibility of an indirect prediction of coagulation traits through the calibration of the near and mid-infrared spectra [12–14]. Another recent development of the Formagraph method is represented by the laboratory method called the 9 mL milk cheesemaking assessment (9-MilCA). Through some modifications of the original Formagraph procedure and operations that simulate the cutting, pressing, and draining of the curd, the 9-MilCA allows the calculation of the CY% and the recoveries of milk nutrients in the curd [15].
Methods and papers described above have been developed and tested on cow milk, whereas the first studies dealing with small ruminant species date back to the late 80s [16]. The aim of the present review is to describe the state of the art and possible development of researches about coagulation properties of sheep and goat milk.