Your browser does not fully support modern features. Please upgrade for a smoother experience.
Serotypes in Adult Pneumococcal Pneumonia: History

Subjects:
Infectious Diseases
Lower respiratory tract infections are an important cause of severe disease worldwide. We studied changes in serotype distribution and antimicrobial susceptibility in adult pneumococcal pneumonia in Spain (2011-2019). Differences were found in serotype composition and antimicrobial resistance by age and type of infection. The maintenance of serotype 3 as a leading cause of adult pneumococcal pneumonia and the increase of highly invasive (serotype 8) or antimicrobial resistant (serotype 11A) serotypes is worrisome. Further studies will be re-quired to analyse the impact of the upcoming broader conjugate vaccines.
- Streptococcus pneumoniae
- pneumonia
- serotype
- antimicrobial resistance
1. Introduction
Lower respiratory tract infections are an important cause of severe disease worldwide. In children, Streptococcus pneumoniae is an important cause of invasive and non-invasive diseases [1]. Furthermore, it is among the leading causes of pneumonia in adults [2] with a significant impact on hospital admissions, morbidity/mortality and medical costs [3].
The capsule is the main pneumococcal virulence factor and also the basis for vaccine development. Vaccines are useful to prevent pneumococcal diseases, but the diversity of the capsular polysaccharide (at least 100 pneumococcal capsular types described) limits its effectiveness. The introduction of pneumococcal conjugate vaccines (PCVs) in children changed the epidemiology of pneumococcal diseases worldwide. In Spain, the current PCVs have been available on voluntary basis since 2009 (PCV10) and 2010 (PCV13) for children, and since 2012 (PCV13) for adults. PCV13 was included in the Spanish paediatric official vaccination schedule in 2016. The introduction of PCV13 in 2010 caused a sharp decrease in the incidence of invasive pneumococcal disease (IPD) in adults due to herd protection [4]. PCV13 also showed to be effective in preventing pneumococcal pneumonia caused by vaccine types [5]. Despite this, the impact of PCVs on the incidence of the different vaccine serotypes has not been homogeneous. For instance, no significant decrease in pneumococcal diseases caused by serotype 3 has been observed after the introduction of PCV13 [6].
Besides PCVs, the 23-valent pneumococcal polysaccharide vaccine (PPV23) is also included in the Spanish systematic vaccination calendar (adults over 65 years old) since 2004, with a vaccine uptake of 68.9% in 2017 [7]. As PPV23 does not prevent colonization, its impact on the epidemiology of the pneumococcal serotypes is limited. PPV23 has been shown to be effective in preventing IPD [8] but its efficacy in preventing pneumococcal pneumonia is controversial [9,10].
2. Changes in Serotype Distribution over the Study Period
The distribution of the number of episodes by period was: 303 in 2011–2013, 315 in 2014–2016, and 277 in 2017–2019. Figure 1 shows the frequency of the pneumococcal serotypes by period. Among PCV13 serotypes, serotypes 7F (5.6% vs. 1.1%) and 19A (9.6% vs. 4.3%) significantly decreased from 2011–2013 to 2017–2019. Serotype 3 ranked first in all three periods (18.5%, 19.0%, and 14.8%, respectively). Two non-PCV13 serotypes showed a statistically significant increase: serotypes 8 (3.3% vs. 9.4%) and 11A (3.6% vs. 8.3%).
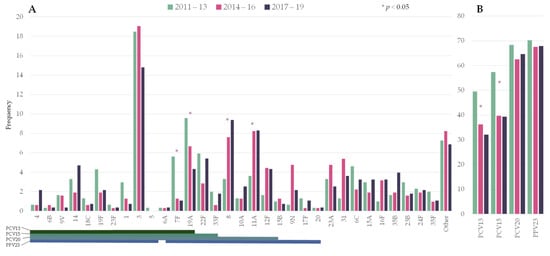
Figure 1. Changes in the serotype distribution of pneumococci causing pneumococcal pneumonia by period. (A) Individual serotypes; (B) Frequency of episodes caused by serotypes included in pneumococcal vaccines. Asterisks indicate significant changes between 2011–2013 and 2017–19. Lines below the serotypes indicate the serotype composition of the different vaccines. PCV13: 13-valent pneumococcal conjugate vaccine (PCV); PCV15: 15-valent PCV; PCV20: 20-valent PCV; PPV23: 23-valent pneumococcal polysaccharide.
Overall, PCV13 serotypes declined from 49.5% to 32.1% over the study period (RR 0.649 [0.5285–0.7971]). In the last period, the putative coverage for the upcoming conjugate vaccines PCV15 and PCV20 were 39% and 65%, respectively.
3. Distribution of Pneumococcal Serotypes Causing Pneumonia by Age Group
Figure 2 and Table 1 show the serotype distribution by age group. Serotype 3 was the most frequent serotype in all age groups (range 17–18%). Serotypes 4, 7F, 8, 12F and 19F were statistically more represented in people younger than 65 years old and accounted for 27% of the episodes (11% for people ≥65 years old). Among these serotypes, serotype 8 alone accounted for 10% of the episodes in younger adults (5% in people ≥65 years old). On the other hand, serotypes 19A, 16F and 24F were more commonly found in older adults, accounting for 15% of the episodes (6% in younger adults). In the last period (2017–2019), the putative coverage of the different pneumococcal vaccines were higher in adults aged 18–64 years old than among people over 65: PCV13 (42% vs. 38%), PCV15 (48% vs. 44%), PCV20 (72% vs. 61%, p < 0.001) and PPV23 (77% vs. 64%, p < 0.001).
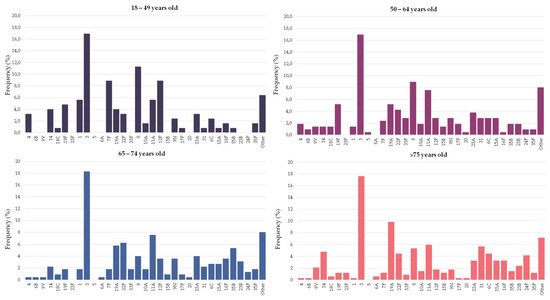
Figure 2. Serotype distribution of pneumococci causing pneumonia by age group. Bars indicate the frequency of each serotype in the particular age group.
Table 1. Pneumococcal serotypes causing pneumonia in young and older adults. Data show the frequency of each serotype in the age group. Only serotypes accounting for ≥10 episodes are shown. Statistically significant results are highlighted in bold. NS: not statistically significant.
| Serotype | Vaccine Type | 18–64 (%) n = 336 |
>64 (%) n = 559 |
p-Value | |||
|---|---|---|---|---|---|---|---|
| PCV13 | PCV15 | PCV20 | PPV23 | ||||
| 3 | X | X | X | X | 17.0 | 17.9 | NS |
| 8 | X | X | 9.8 | 4.8 | 0.006 | ||
| 11A | X | X | 6.8 | 6.6 | NS | ||
| 12F | X | X | 5.1 | 2.5 | 0.043 | ||
| 19F | X | X | X | X | 5.1 | 1.4 | 0.002 |
| 19A | X | X | X | X | 4.8 | 8.2 | 0.048 |
| 7F | X | X | X | X | 4.8 | 1.4 | 0.005 |
| 22F | X | X | X | 3.9 | 5.2 | NS | |
| 23A | 3.6 | 3.6 | NS | ||||
| 1 | X | X | X | X | 3.0 | 0.9 | NS |
| 9N | X | 2.7 | 3.8 | NS | |||
| 6C | 2.7 | 2.5 | NS | ||||
| 14 | X | X | X | X | 2.4 | 3.8 | NS |
| 4 | X | X | X | X | 2.4 | 0.4 | 0.014 |
| 31 | 2.1 | 4.3 | NS | ||||
| 15A | 2.1 | 3.0 | NS | ||||
| 10A | X | X | 1.8 | 1.6 | NS | ||
| 33F | X | X | X | 1.8 | 1.3 | NS | |
| 35B | 1.5 | 3.0 | NS | ||||
| 23B | 1.2 | 2.7 | NS | ||||
| 35F | 1.19 | 1.43 | NS | ||||
| 16F | 0.9 | 3.4 | 0.033 | ||||
| 9V | X | X | X | X | 0.9 | 3.0 | NS |
| 24F | 0.6 | 3.0 | 0.026 | ||||
| Other | 12.2 | 11.8 | NS | ||||
4. Differences in the Serotype Composition of Pneumococci Causing Bacteremic and Non-Bacteremic Pneumococcal Pneumonia
There was great variation in the propensity of the serotypes to be found in BPP or non-BPP episodes (Figure 3). Serotypes 1, 7F, 8, 10A, 12F, 14, 19A, 22F and 24F were significantly more frequent among BPP episodes, with ORs above 1. On the other hand, serotypes 3, 11A, 19F, 23A and 23B were more frequent among non-BPP episodes and had ORs below 1. In spite of that, serotypes 3 and 8 were the most frequent serotypes causing BPP, accounting for more than a fifth of episodes. With regard to non-BPP episodes, these were dominated by the occurrence of serotypes 3 and 11A.
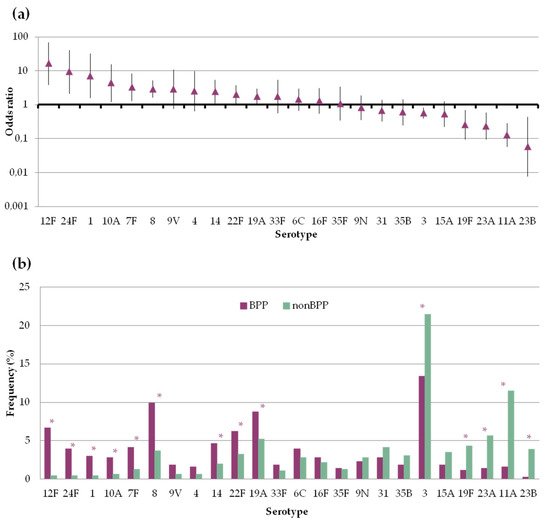
Figure 3. Frequency of pneumococcal serotypes in bacteremic (BPP) and non-bacteremic pneumonia (non-BPP). Only serotypes accounting for ≥10 episodes are shown (a) Serotype specific odds ratio and 95% CI comparing BPP and non-BPP. (b) Serotype distribution of pneumococci causing BPP or non-BPP. Asterisks indicate statistically significant changes (p < 0.05).
5. Antimicrobial Susceptibility
We compared the antimicrobial non-susceptibility rates of pneumococci causing BPP and non-BPP. Antimicrobial resistance rates of non-BPP episodes were globally the highest (Table 2), although statistically significant differences were only found for amoxicillin (11% in BPP vs. 17% in non-BPP). By age group, pneumococci found in adults over 65 years old also showed the highest rates of resistance. These differences were statistically significant for penicillin (24% vs. 30%) and erythromycin (18% vs. 24%).
Table 2. Changes in antimicrobial non-susceptibility rates by type of infection (a), age group (b) and period (c). Percentages correspond to EUCAST clinical breakpoints of non-susceptibility for penicillin (>0.06 mg/L), amoxicillin (>0.5 mg/L) and cefotaxime (>0.5 mg/L) and resistance for erythromycin (>0.5 mg/L) and levofloxacin (>2 mg/L). Statistically significant results are highlighted in bold. MIC50 and MIC90 are given in mg/L.
| (a) | BPP (n = 433) | Non-BPP (n = 462) | |||||
| Antibiotic | MIC50 | MIC90 | % | MIC50 | MIC90 | % | p-Value |
| Penicillin Amoxicillin |
<0.06 | 1 | 26% | <0.06 | 2 | 29% | 0.29 |
| <0.06 | 1 | 11% | <0.06 | 2 | 17% | 0.009 | |
| Cefotaxime Erythromycin |
<0.06 | 0.5 | 9% | <0.06 | 1 | 10% | 0.63 |
| <0.25 | >32 | 21% | <0.25 | >32 | 23% | 0.59 | |
| Levofloxacin | 1 | 1 | 1% | 0.5 | 1 | 2% | 0.44 |
| (b) | 18–64 (n = 336) | >65 (n = 559) | |||||
| Antibiotic | MIC50 | MIC90 | % | MIC50 | MIC90 | % | p-Value |
| Penicillin Amoxicillin |
<0.06 | 1 | 24% | <0.06 | 2 | 30% | 0.045 |
| <0.06 | 1 | 13% | <0.06 | 2 | 14% | 0.76 | |
| Cefotaxime Erythromycin |
<0.06 | 0.5 | 9% | <0.06 | 1 | 10% | 0.48 |
| <0.25 | >32 | 18% | <0.25 | >32 | 24% | 0.037 | |
| Levofloxacin | 1 | 1 | 1% | 1 | 1 | 2% | 0.39 |
| (c) | 2011–13 (n = 303) | 2017–19 (n = 277) | |||||
| Antibiotic | MIC50 | MIC90 | % | MIC50 | MIC90 | % | p-Value |
| Penicillin Amoxicillin |
<0.06 | 1 | 31% | <0.06 | 2 | 26% | 0.15 |
| <0.06 | 1 | 14% | <0.06 | 2 | 15% | 0.72 | |
| Cefotaxime Erythromycin |
<0.06 | 0.5 | 10% | <0.06 | 0.5 | 8% | 0.46 |
| <0.25 | >32 | 27% | <0.25 | >32 | 19% | 0.04 | |
| Levofloxacin | 1 | 1 | 2% | 1 | 1 | 1% | 0.7 |
Through the study period, a reduction in the proportion of non-susceptible pneumococcal strains was observed for most antimicrobials. These differences were statistically significant for erythromycin (27% vs. 19%, 2011–2013 vs. 2017–2019). Furthermore, an increase in the MIC90 of penicillin and amoxicillin was observed (from 1 to 2 mg/L) and was associated with the increase in serotype 11A isolates.
This entry is adapted from the peer-reviewed paper 10.3390/microorganisms9112245